| Param | Original file | Final file |
|---|---|---|
| Filename | modeM0/AS1P01_161T02_9000000066_00393cztM0_level2.evt | modeM0/AS1P01_161T02_9000000066_00393cztM0_level2_quad_clean.evt |
| Size (bytes) | 22,052,160 | 2,116,800 |
| Size | 21.0 MB | 2.0 MB |
| Events in quadrant A | 177,937 | 11,604 |
| Events in quadrant B | 167,342 | 11,044 |
| Events in quadrant C | 153,677 | 11,782 |
| Events in quadrant D | 156,206 | 11,113 |
| Mode SS | |||
|---|---|---|---|
| Quadrant | BADHDUFLAG | Total packets | Discarded packets |
| A | 0 | 2 | 0 |
| B | 0 | 2 | 0 |
| C | 0 | 2 | 0 |
| D | 0 | 2 | 0 |
| Mode M0 | |||
|---|---|---|---|
| Quadrant | BADHDUFLAG | Total packets | Discarded packets |
| A | 0 | 629 | 1 |
| B | 0 | 594 | 0 |
| C | 0 | 553 | 0 |
| D | 0 | 566 | 0 |
| Quadrant | Total seconds | Saturated seconds | Saturation percentage |
|---|---|---|---|
| A | 137 | 6 | 4.379562% |
| B | 137 | 0 | 0.000000% |
| C | 137 | 0 | 0.000000% |
| D | 137 | 0 | 0.000000% |
Noise dominated data is calculated using 1-second bins in cleaned event files. If a bin has >2000 counts, and if more than 50% of those come from <1% of pixels, then it is considered to be noise-dominated and hence unusable.
| Quadrant | # 1 sec bins | Bins with >0 counts | Bins with >2000 counts | High rate bins dominated by noise | Noise dominated (total time) | Noise dominated (detector-on time) | Marked lightcurve |
|---|---|---|---|---|---|---|---|
| A | 137 | 137 | 6 | 6 | 4.38% | 4.38% | 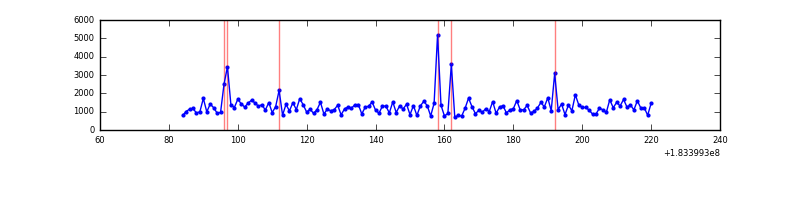 |
| B | 137 | 137 | 7 | 7 | 5.11% | 5.11% | 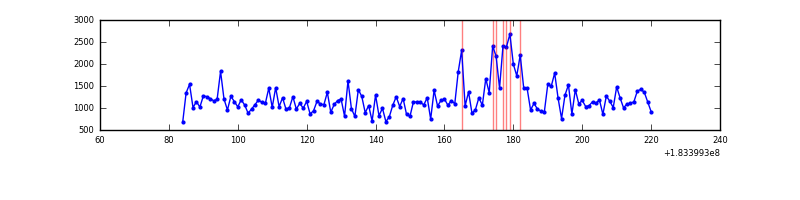 |
| C | 137 | 137 | 0 | 0 | 0.00% | 0.00% | 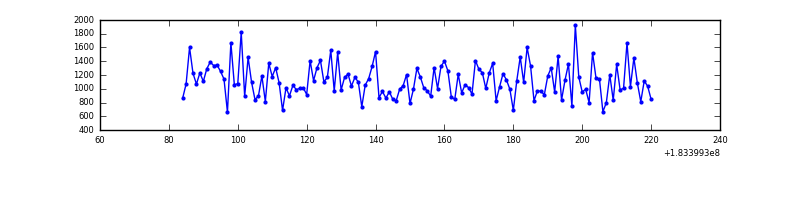 |
| D | 137 | 137 | 0 | 0 | 0.00% | 0.00% |  |
Top three noisy pixels from each quadrant. If the there are fewer than three noisy pixels in the level2.evt file, extra rows are filled as -1
| Pixel properties | Quadrant properties | ||||||
|---|---|---|---|---|---|---|---|
| Quadrant | DetID | PixID | Counts | Sigma | Mean | Median | Sigma |
| A | 15 | 200 | 16451 | 1489.27 | 39 | 39 | 11.0 |
| A | 0 | 238 | 4081 | 366.78 | 39 | 39 | 11.0 |
| A | 13 | 8 | 1501 | 132.67 | 39 | 39 | 11.0 |
| B | 0 | 23 | 13632 | 1245.7 | 38 | 38 | 10.9 |
| B | 6 | 0 | 3164 | 286.45 | 38 | 38 | 10.9 |
| B | 5 | 2 | 1328 | 118.21 | 38 | 38 | 10.9 |
| C | 2 | 53 | 602 | 45.66 | 38 | 39 | 12.3 |
| C | 10 | 19 | 530 | 39.82 | 38 | 39 | 12.3 |
| C | 5 | 234 | 310 | 21.98 | 38 | 39 | 12.3 |
| D | 13 | 174 | 5287 | 392.6 | 37 | 38 | 13.4 |
| D | 13 | 216 | 1780 | 130.29 | 37 | 38 | 13.4 |
| D | 13 | 7 | 1056 | 76.14 | 37 | 38 | 13.4 |
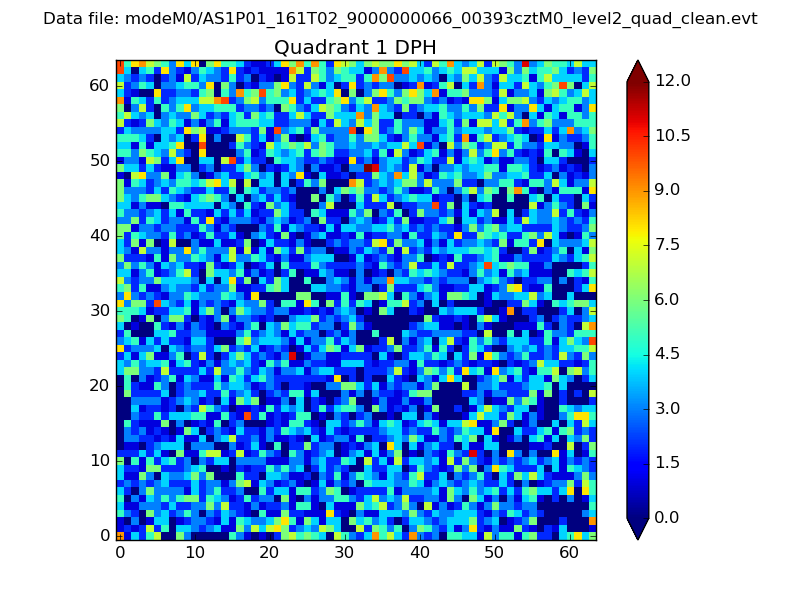
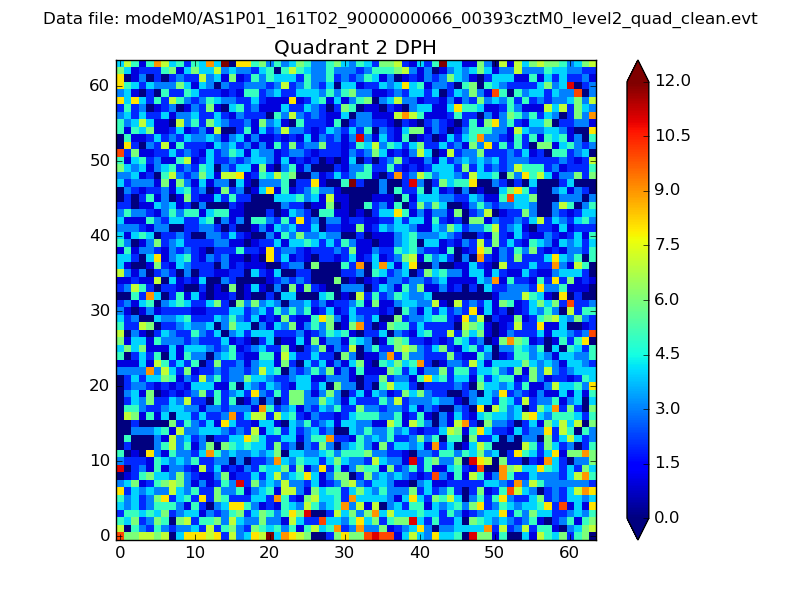
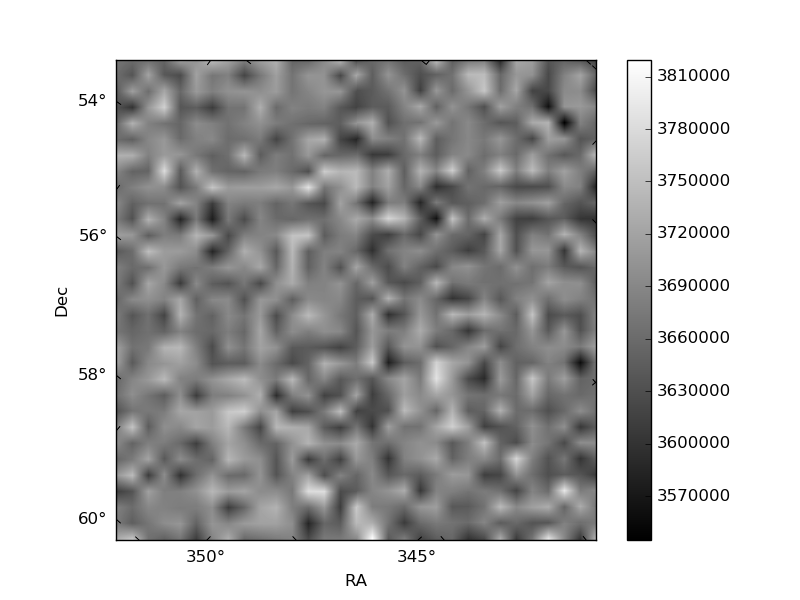
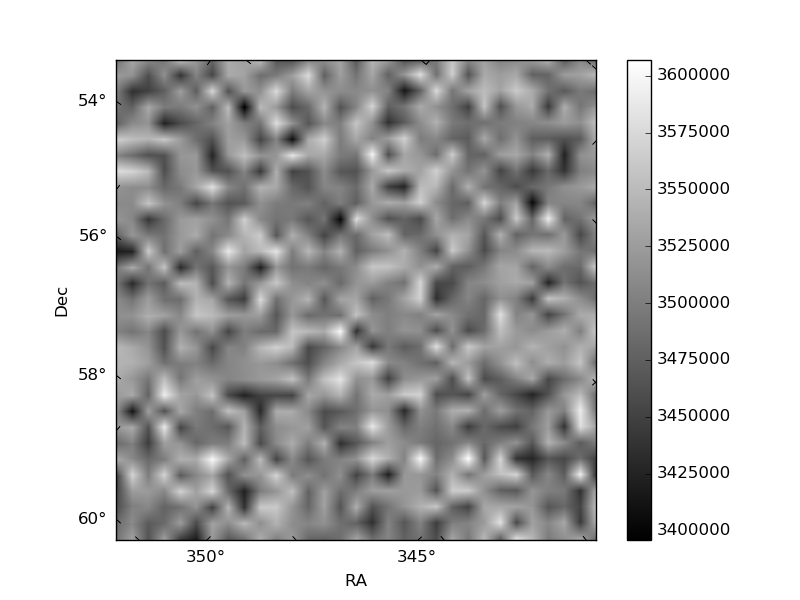
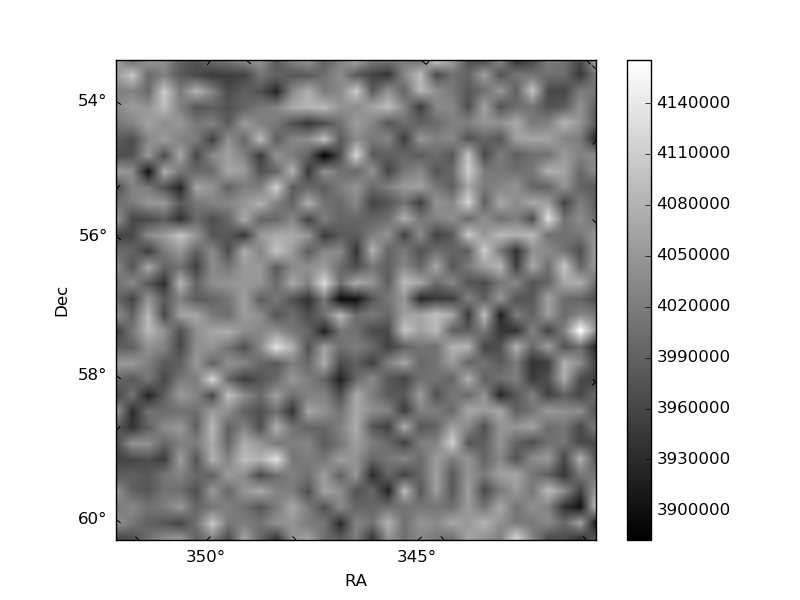
Histogram calculated using DETX and DETY for each event in the final _common_clean file
| Quadrant A | 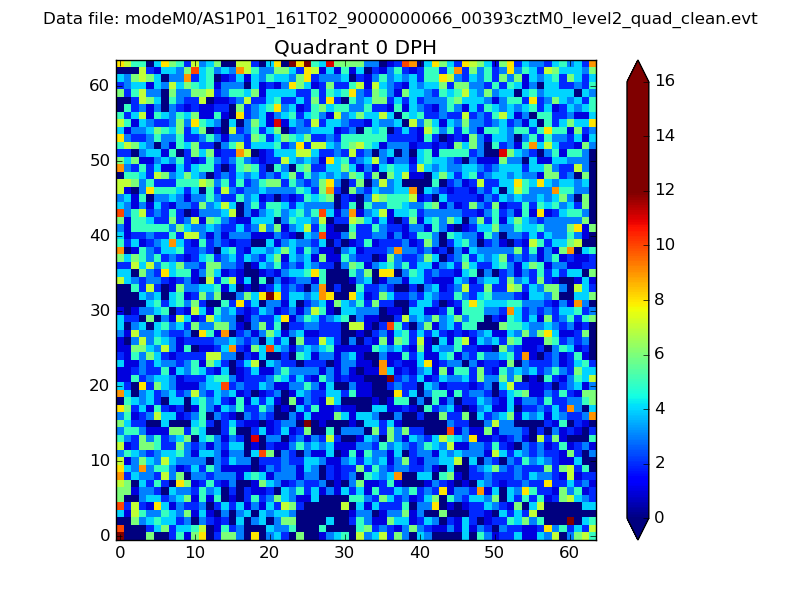 |
 |
Quadrant B |
|---|---|---|---|
| Quadrant D | 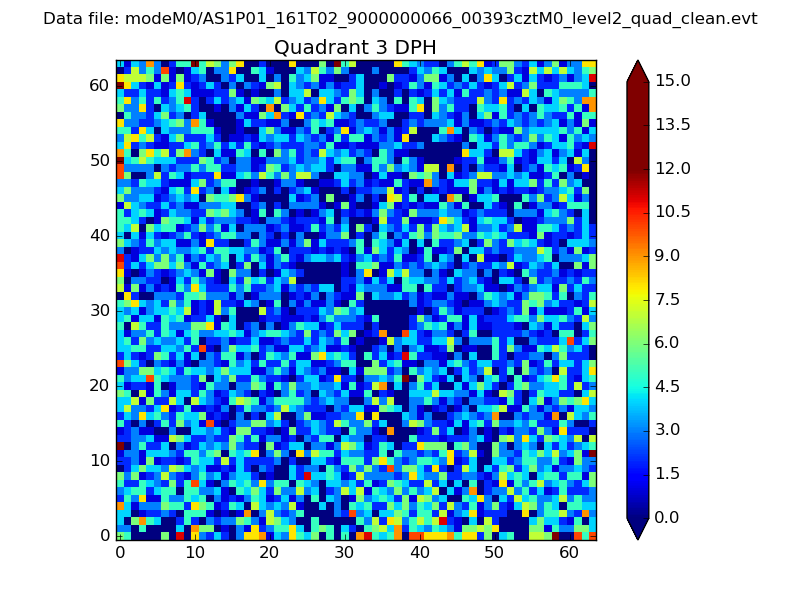 |
 |
Quadrant C |
| Plot type | Count rate plots | Images |
|---|---|---|
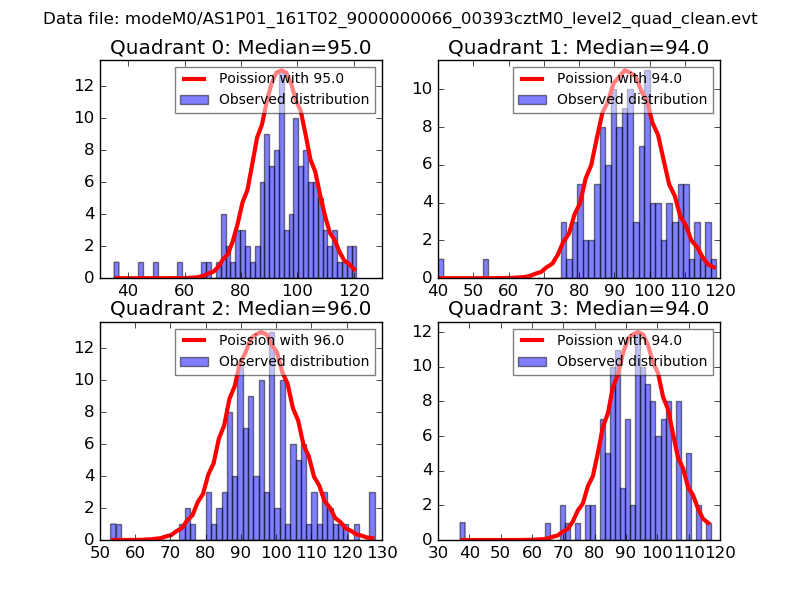
| Comparison with Poisson distribution Blue bars denote a histogram of data divided into 1 sec bins. Red curve is a Poisson curve with rate = median count rate of data. |
 |
 |
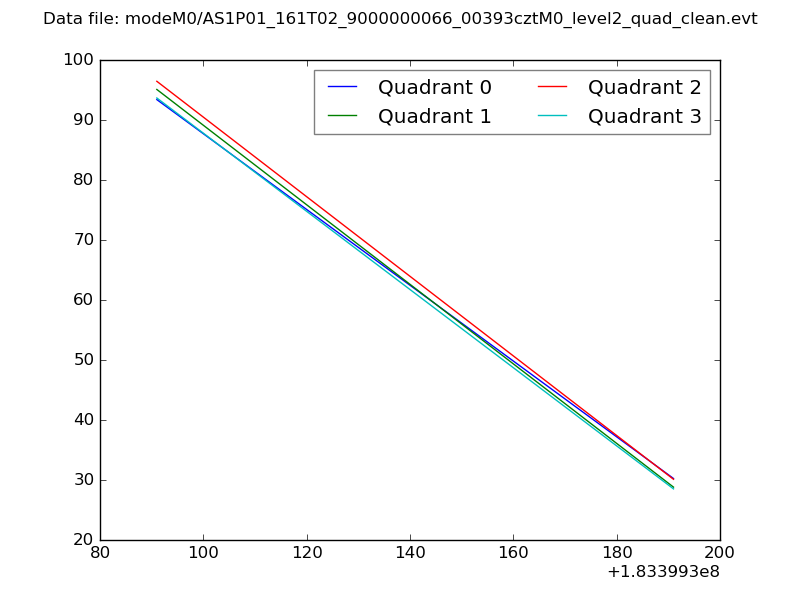
| Quadrant-wise count rates Data is divided into 100 sec bins |
 |
|
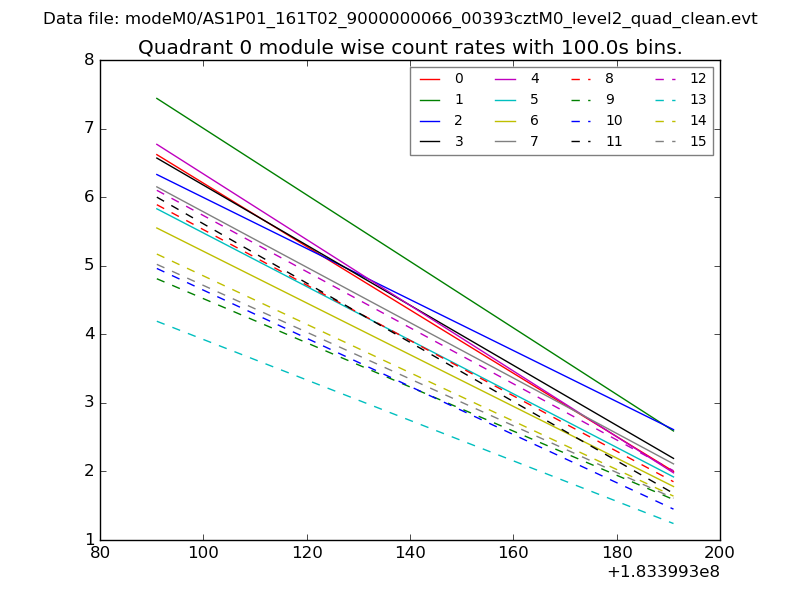
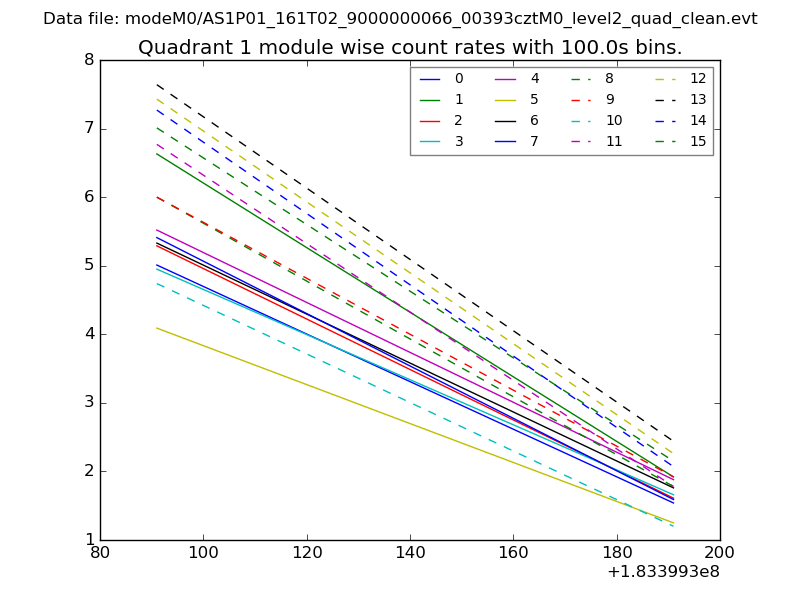
| Module-wise count rates for Quadrant A Data is divided into 100 sec bins |
 |
 |
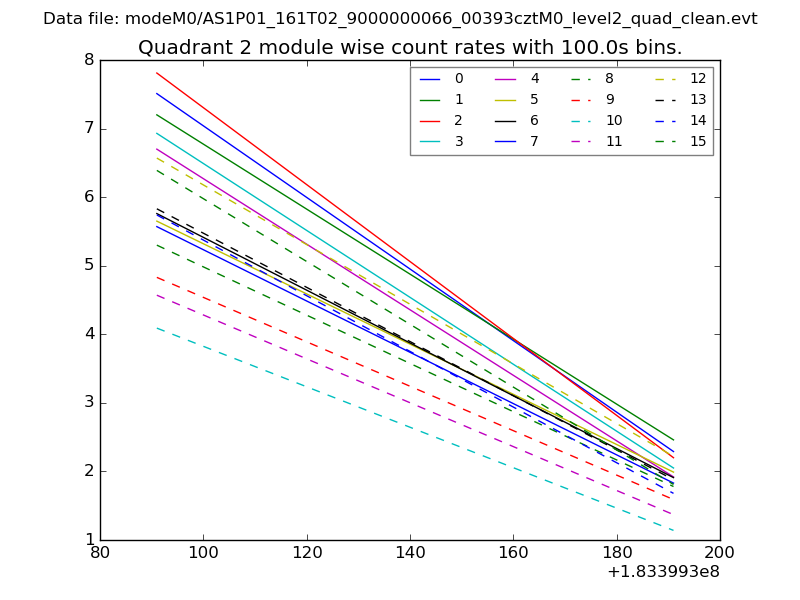
| Module-wise count rates for Quadrant B Data is divided into 100 sec bins |
 |
 |
| Module-wise count rates for Quadrant C Data is divided into 100 sec bins |
 |
 |
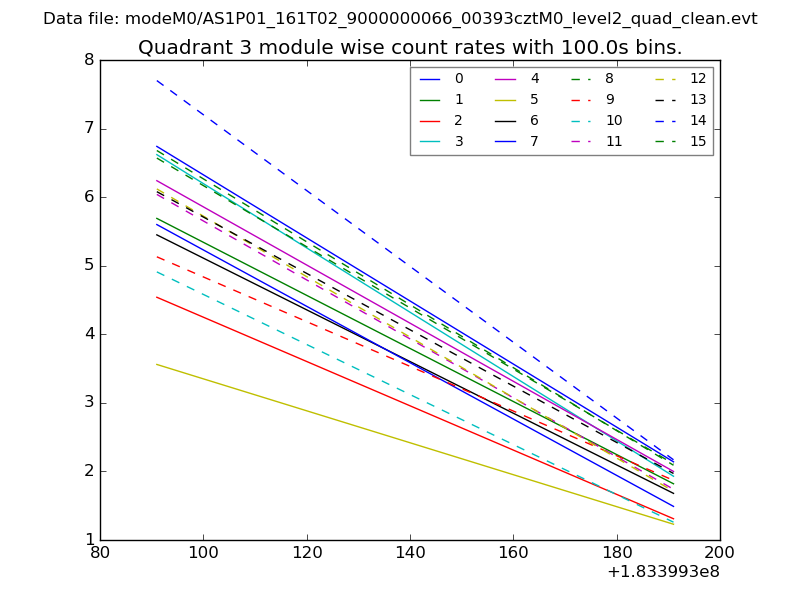
| Module-wise count rates for Quadrant D Data is divided into 100 sec bins |
 |
 |
| Parameter | Plot |
|---|---|
| CZT HV Monitor | 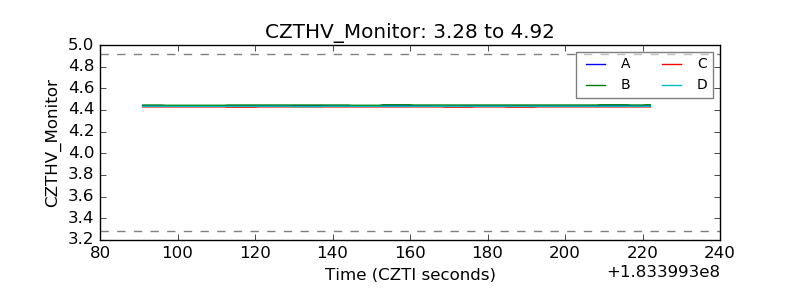 |
| D_VDD |  |
| Temperature 1 | 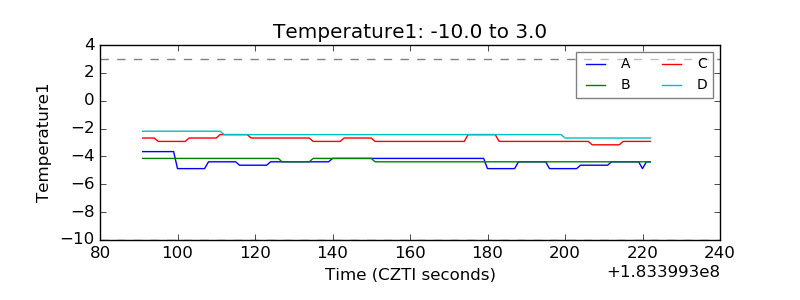 |
| Veto HV Monitor |  |
| Veto LLD | 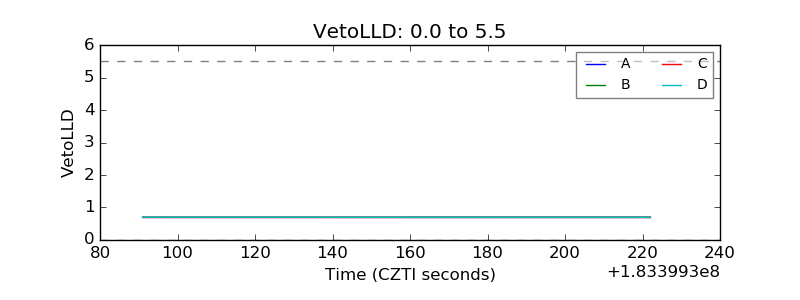 |
| Alpha Counter | 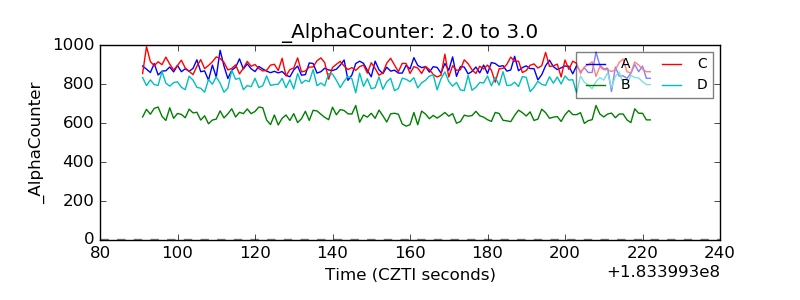 |
| _CPM_Rate | 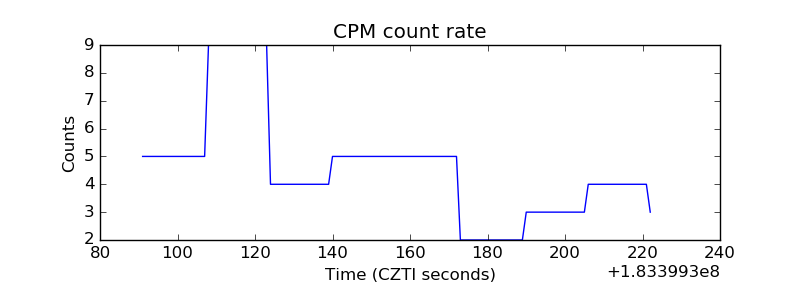 |
| CZT Counter | 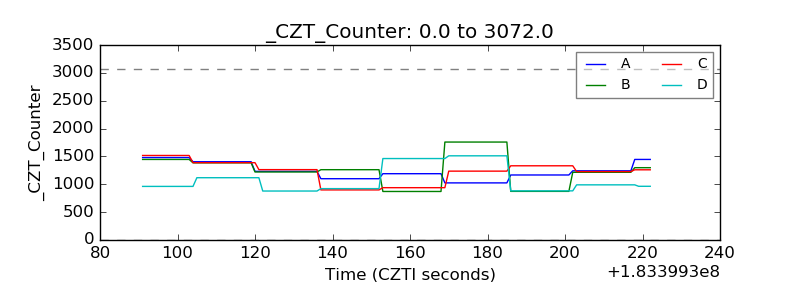 |
| +2.5 Volts monitor | 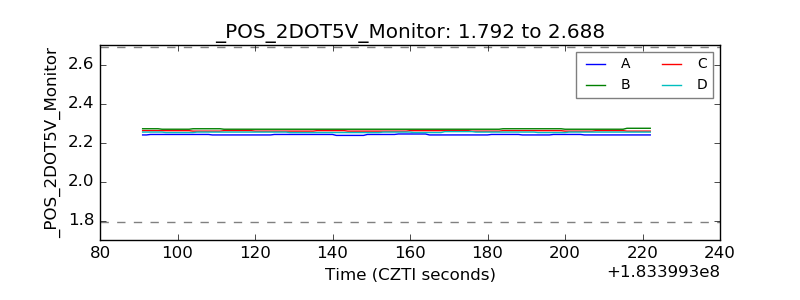 |
| +5 Volts monitor |  |
| _ROLL_ROT | 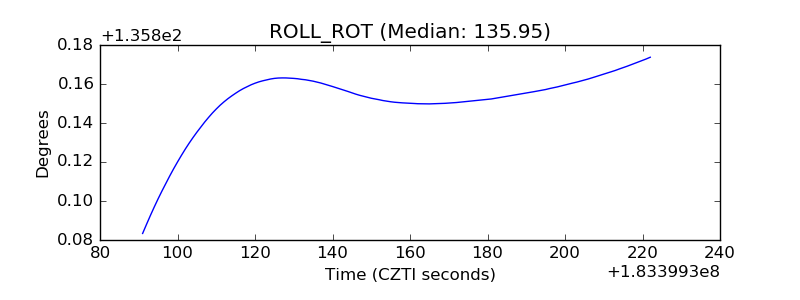 |
| _Roll_DEC | 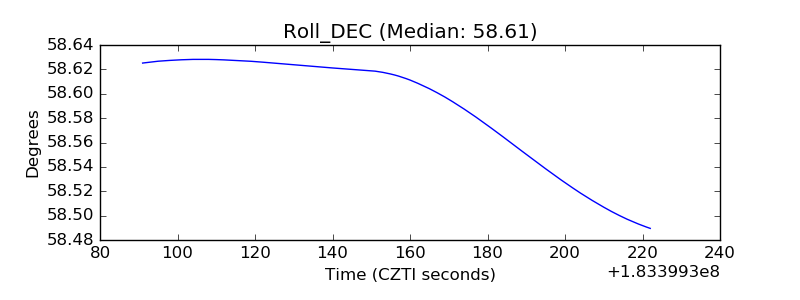 |
| _Roll_RA | 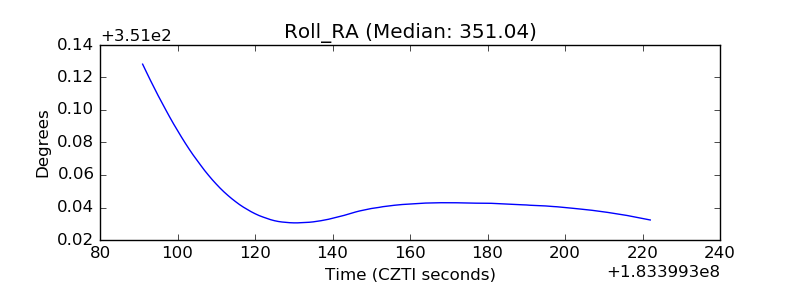 |
| Veto Counter | 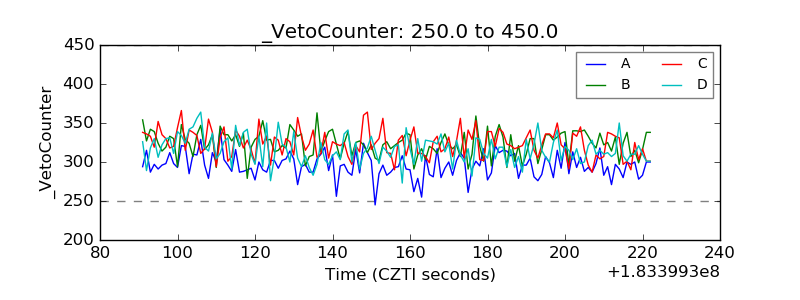 |