| Param | Original file | Final file |
|---|---|---|
| Filename | modeM0/AS1P01_161T02_9000000066_00395cztM0_level2.evt | modeM0/AS1P01_161T02_9000000066_00395cztM0_level2_quad_clean.evt |
| Size (bytes) | 774,351,360 | 54,239,040 |
| Size | 738.5 MB | 51.7 MB |
| Events in quadrant A | 6,124,124 | 327,032 |
| Events in quadrant B | 5,922,262 | 308,799 |
| Events in quadrant C | 5,643,759 | 328,019 |
| Events in quadrant D | 5,412,234 | 311,630 |
| Mode M9 | |||
|---|---|---|---|
| Quadrant | BADHDUFLAG | Total packets | Discarded packets |
| A | 0 | 27 | 0 |
| B | 0 | 27 | 0 |
| C | 0 | 27 | 0 |
| D | 0 | 28 | 0 |
| Mode SS | |||
|---|---|---|---|
| Quadrant | BADHDUFLAG | Total packets | Discarded packets |
| A | 0 | 106 | 0 |
| B | 0 | 106 | 0 |
| C | 0 | 106 | 0 |
| D | 0 | 106 | 0 |
| Mode M0 | |||
|---|---|---|---|
| Quadrant | BADHDUFLAG | Total packets | Discarded packets |
| A | 0 | 21912 | 3 |
| B | 0 | 21257 | 2 |
| C | 0 | 20516 | 2 |
| D | 0 | 19872 | 2 |
| Quadrant | Total seconds | Saturated seconds | Saturation percentage |
|---|---|---|---|
| A | 5234 | 11 | 0.210164% |
| B | 5234 | 6 | 0.114635% |
| C | 5234 | 2 | 0.038212% |
| D | 5234 | 12 | 0.229270% |
Noise dominated data is calculated using 1-second bins in cleaned event files. If a bin has >2000 counts, and if more than 50% of those come from <1% of pixels, then it is considered to be noise-dominated and hence unusable.
| Quadrant | # 1 sec bins | Bins with >0 counts | Bins with >2000 counts | High rate bins dominated by noise | Noise dominated (total time) | Noise dominated (detector-on time) | Marked lightcurve |
|---|---|---|---|---|---|---|---|
| A | 7299 | 5235 | 110 | 110 | 1.51% | 2.10% | 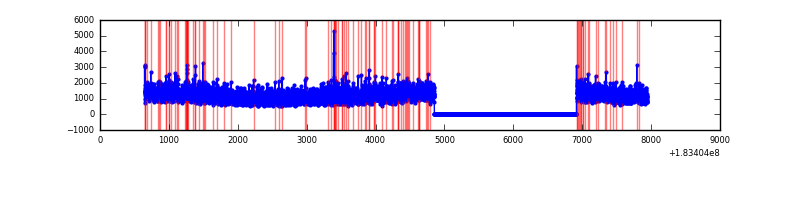 |
| B | 7299 | 5235 | 56 | 56 | 0.77% | 1.07% | 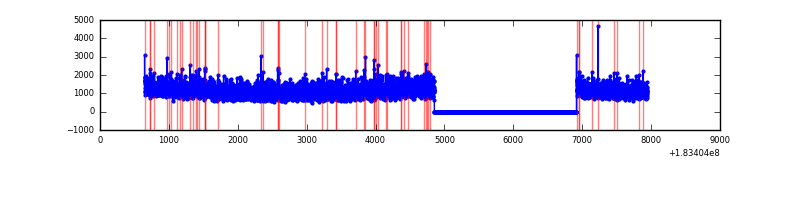 |
| C | 7299 | 5235 | 31 | 31 | 0.42% | 0.59% | 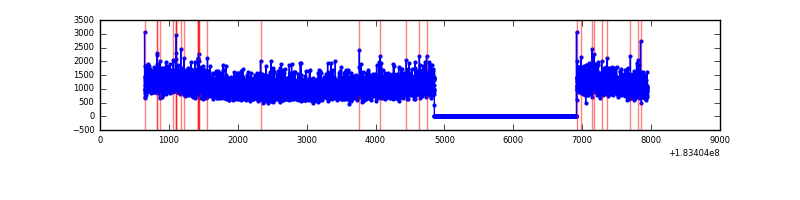 |
| D | 7299 | 5235 | 58 | 58 | 0.79% | 1.11% | 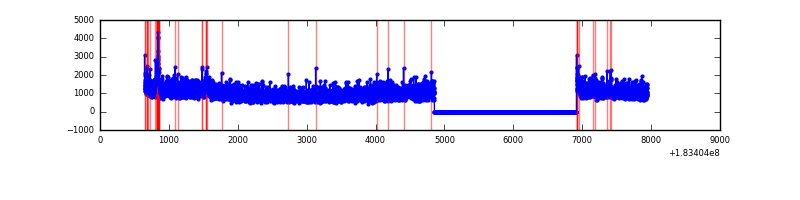 |
Top three noisy pixels from each quadrant. If the there are fewer than three noisy pixels in the level2.evt file, extra rows are filled as -1
| Pixel properties | Quadrant properties | ||||||
|---|---|---|---|---|---|---|---|
| Quadrant | DetID | PixID | Counts | Sigma | Mean | Median | Sigma |
| A | 0 | 238 | 117469 | 341.97 | 1509 | 1488 | 339.2 |
| A | 12 | 243 | 62624 | 180.26 | 1509 | 1488 | 339.2 |
| A | 13 | 17 | 42088 | 119.71 | 1509 | 1488 | 339.2 |
| B | 4 | 82 | 25492 | 67.86 | 1513 | 1516 | 353.3 |
| B | 5 | 46 | 20512 | 53.76 | 1513 | 1516 | 353.3 |
| B | 5 | 2 | 17615 | 45.57 | 1513 | 1516 | 353.3 |
| C | 5 | 234 | 67950 | 169.94 | 1405 | 1455 | 391.3 |
| C | 1 | 1 | 47630 | 118.01 | 1405 | 1455 | 391.3 |
| C | 14 | 239 | 6110 | 11.9 | 1405 | 1455 | 391.3 |
| D | 13 | 7 | 46179 | 106.1 | 1338 | 1382 | 422.2 |
| D | 1 | 5 | 43630 | 100.06 | 1338 | 1382 | 422.2 |
| D | 13 | 174 | 28844 | 65.04 | 1338 | 1382 | 422.2 |
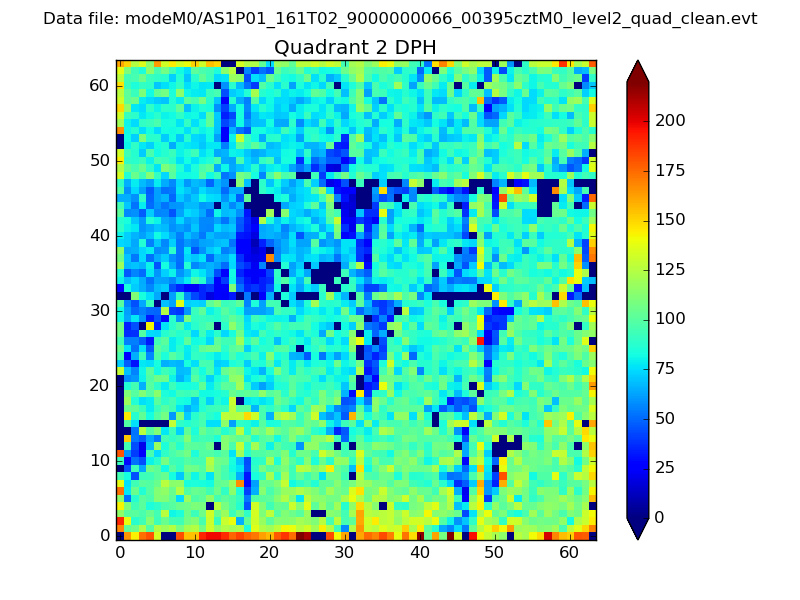
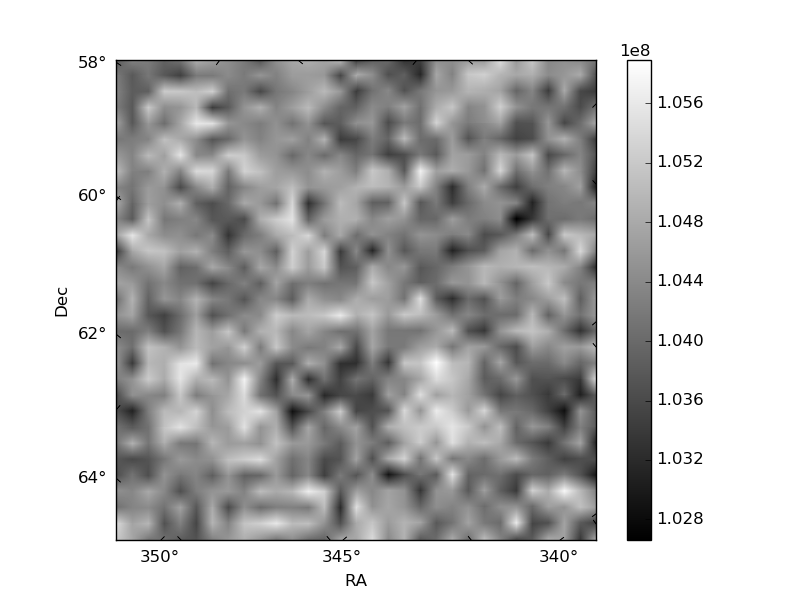
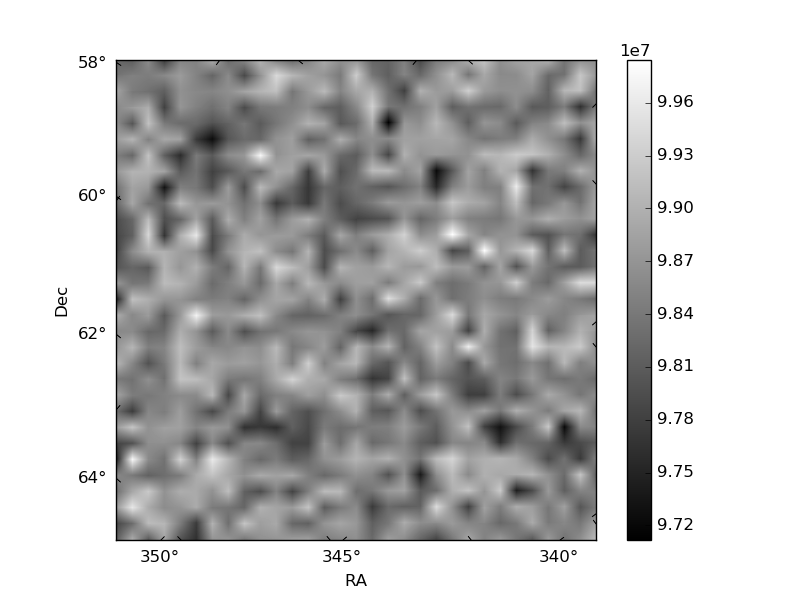
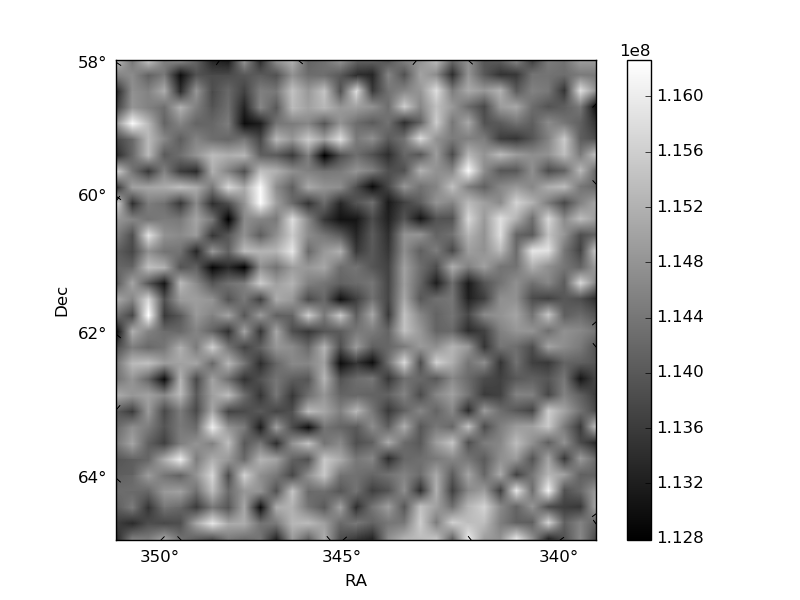
Histogram calculated using DETX and DETY for each event in the final _common_clean file
| Quadrant A | 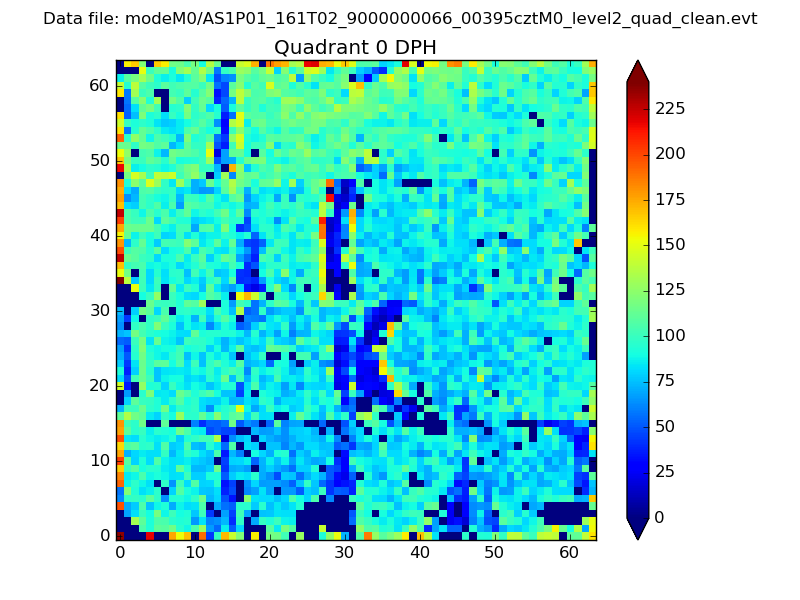 |
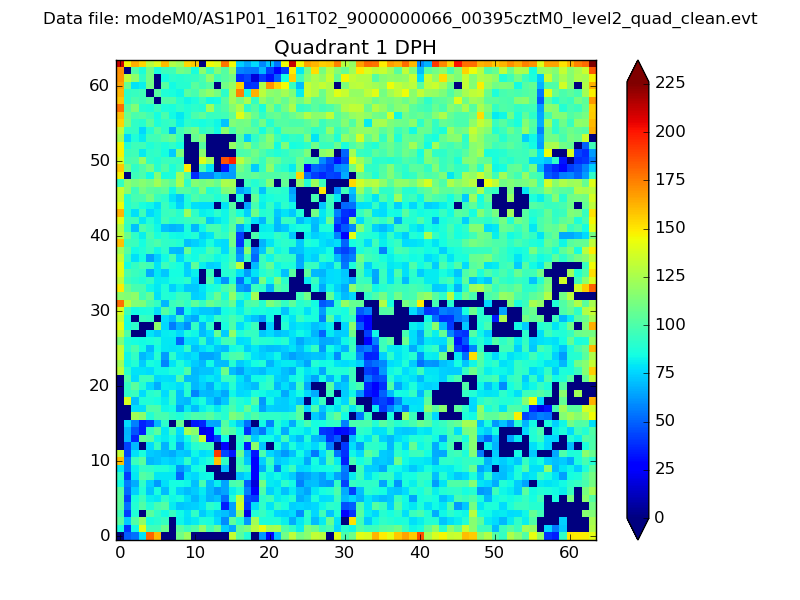 |
Quadrant B |
|---|---|---|---|
| Quadrant D | 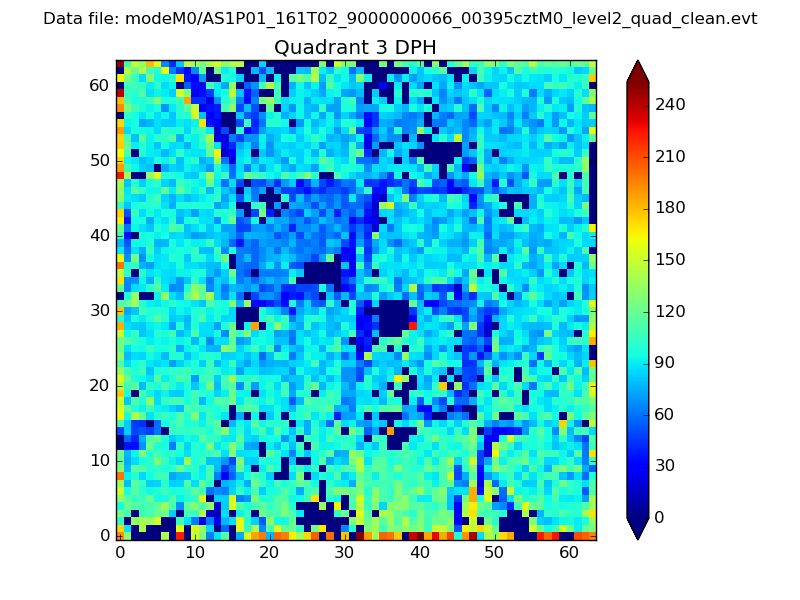 |
 |
Quadrant C |
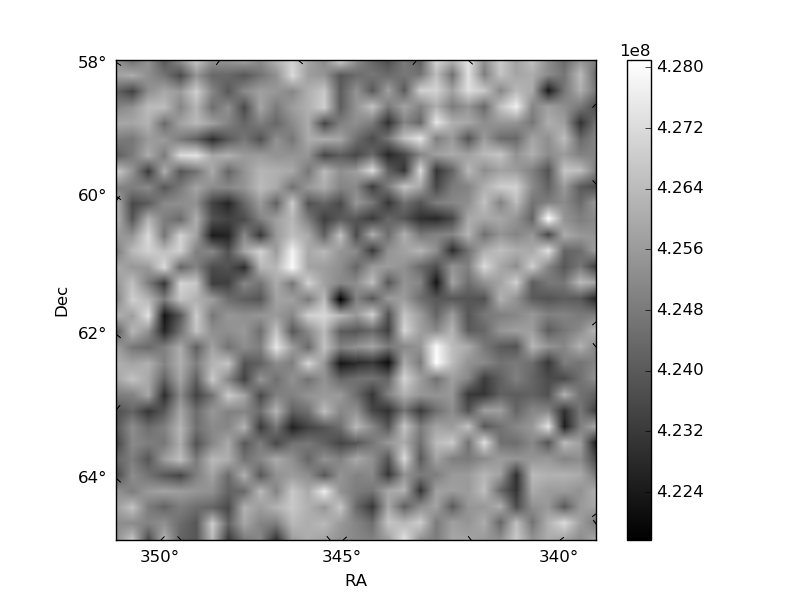
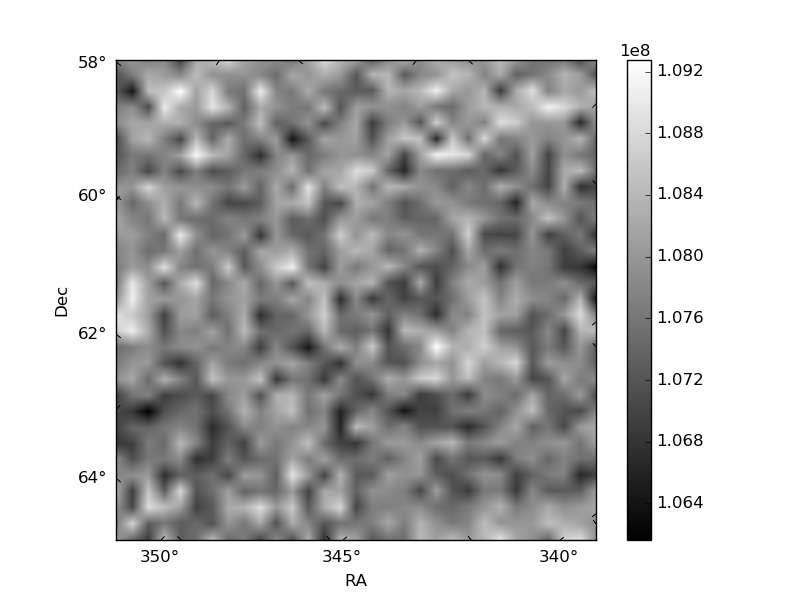
| Plot type | Count rate plots | Images |
|---|---|---|
| Comparison with Poisson distribution Blue bars denote a histogram of data divided into 1 sec bins. Red curve is a Poisson curve with rate = median count rate of data. |
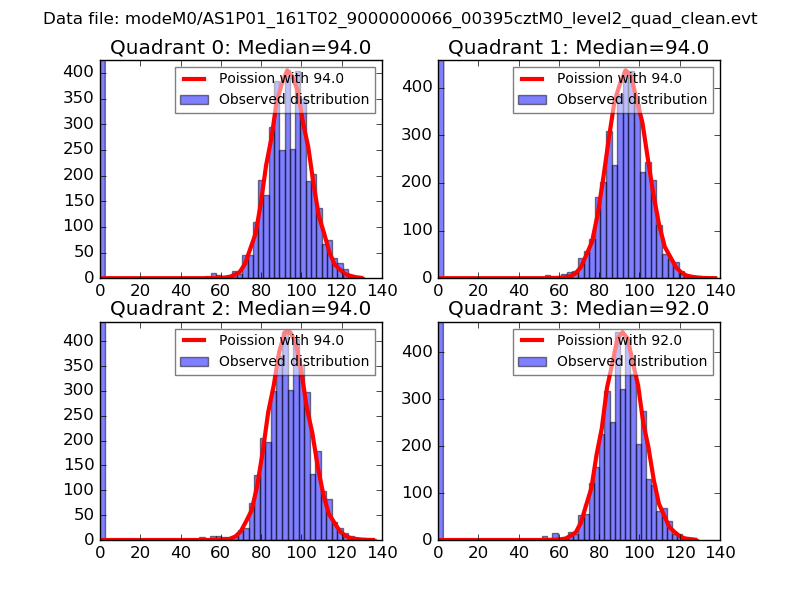 |
 |
| Quadrant-wise count rates Data is divided into 100 sec bins |
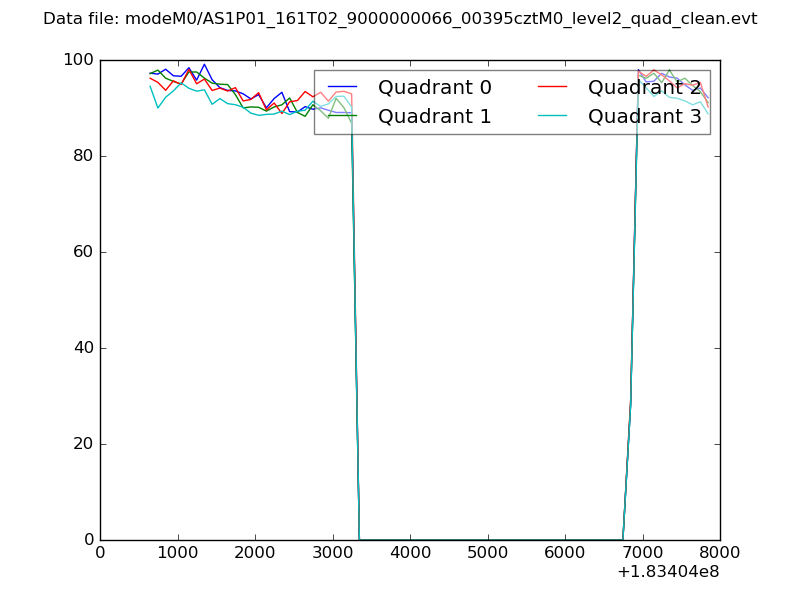 |
|
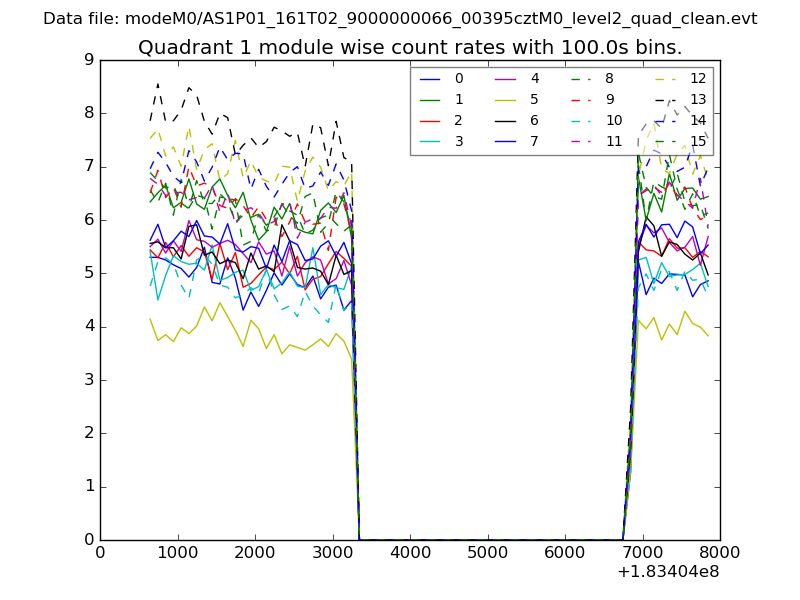
| Module-wise count rates for Quadrant A Data is divided into 100 sec bins |
 |
 |
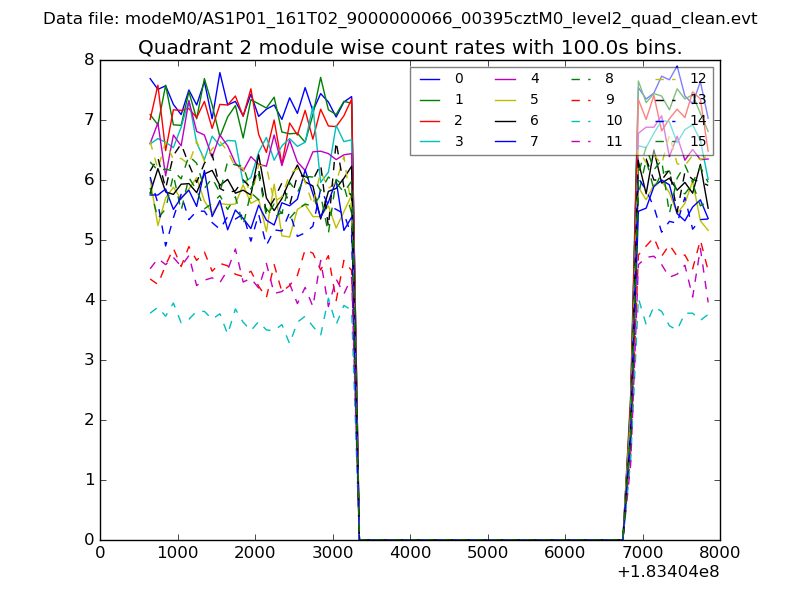
| Module-wise count rates for Quadrant B Data is divided into 100 sec bins |
 |
 |
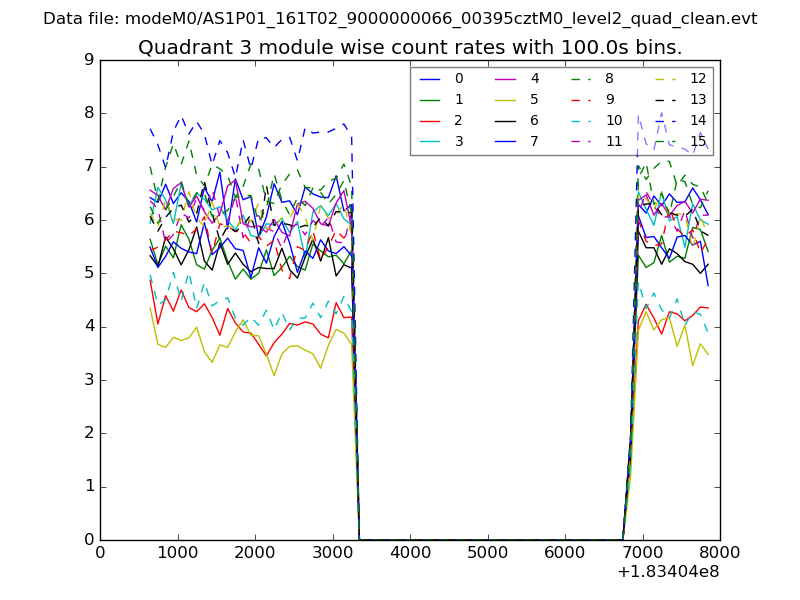
| Module-wise count rates for Quadrant C Data is divided into 100 sec bins |
 |
 |
| Module-wise count rates for Quadrant D Data is divided into 100 sec bins |
 |
 |
| Parameter | Plot |
|---|---|
| CZT HV Monitor | 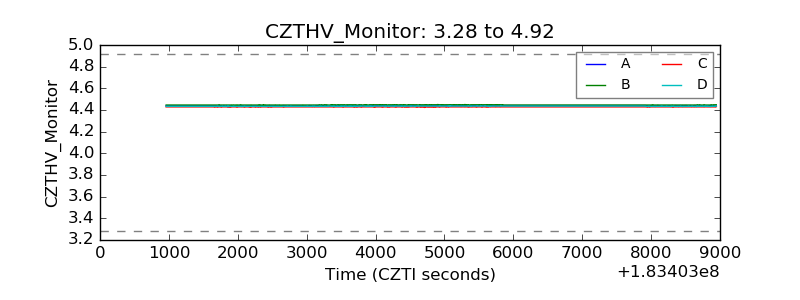 |
| D_VDD | 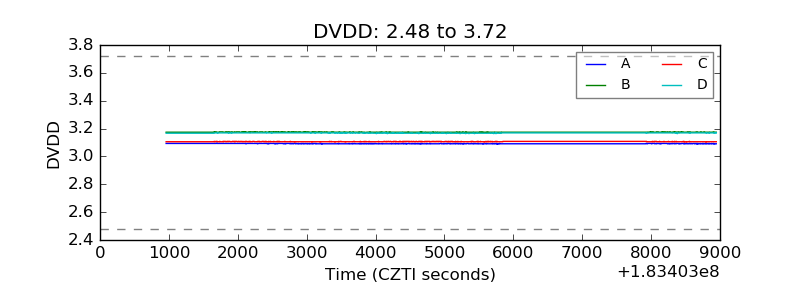 |
| Temperature 1 |  |
| Veto HV Monitor | 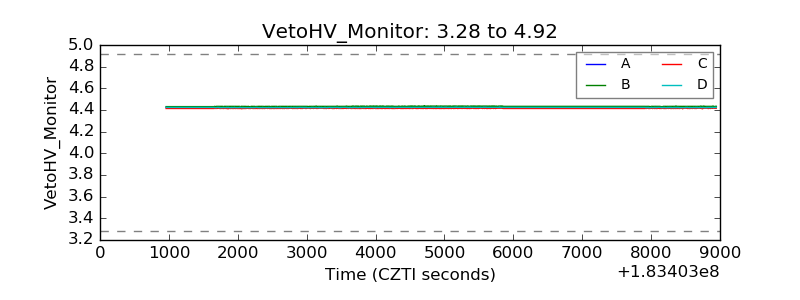 |
| Veto LLD | 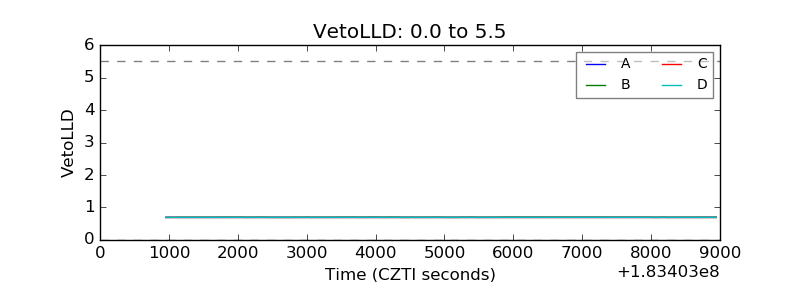 |
| Alpha Counter | 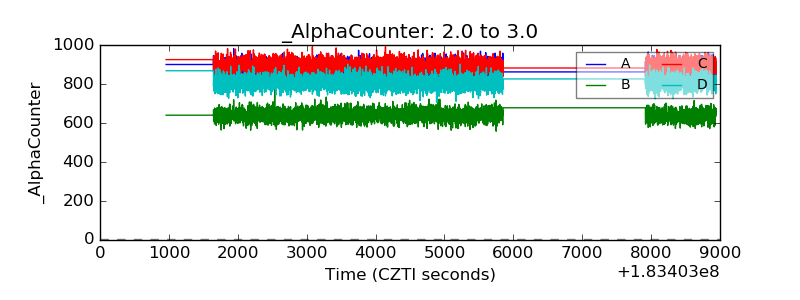 |
| _CPM_Rate | 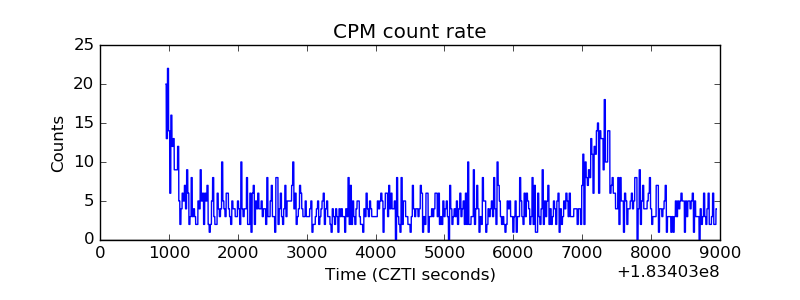 |
| CZT Counter | 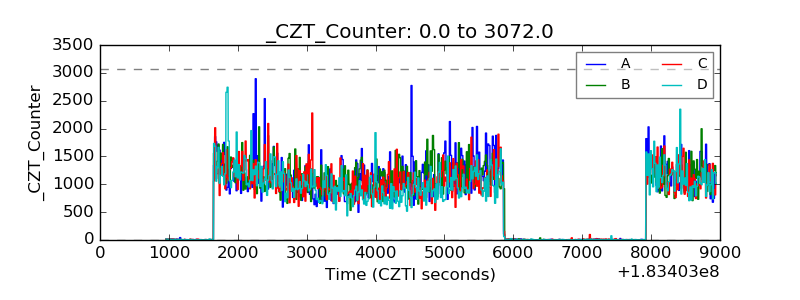 |
| +2.5 Volts monitor |  |
| +5 Volts monitor |  |
| _ROLL_ROT |  |
| _Roll_DEC |  |
| _Roll_RA | 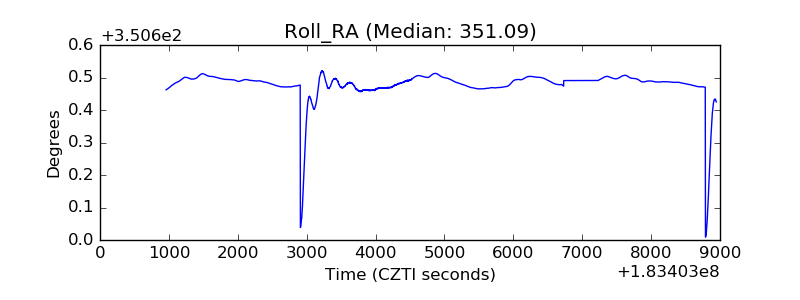 |
| Veto Counter | 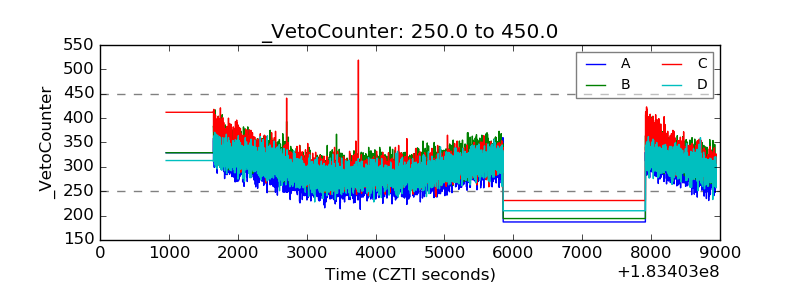 |