| Param | Original file | Final file |
|---|---|---|
| Filename | modeM0/AS1P01_161T02_9000000066_00396cztM0_level2.evt | modeM0/AS1P01_161T02_9000000066_00396cztM0_level2_quad_clean.evt |
| Size (bytes) | 780,687,360 | 51,693,120 |
| Size | 744.5 MB | 49.3 MB |
| Events in quadrant A | 6,184,429 | 306,113 |
| Events in quadrant B | 5,885,335 | 290,931 |
| Events in quadrant C | 5,822,291 | 306,492 |
| Events in quadrant D | 5,399,340 | 291,801 |
| Mode M9 | |||
|---|---|---|---|
| Quadrant | BADHDUFLAG | Total packets | Discarded packets |
| A | 0 | 27 | 0 |
| B | 0 | 27 | 0 |
| C | 0 | 27 | 0 |
| D | 0 | 28 | 0 |
| Mode SS | |||
|---|---|---|---|
| Quadrant | BADHDUFLAG | Total packets | Discarded packets |
| A | 0 | 108 | 0 |
| B | 0 | 108 | 0 |
| C | 0 | 108 | 0 |
| D | 0 | 108 | 0 |
| Mode M0 | |||
|---|---|---|---|
| Quadrant | BADHDUFLAG | Total packets | Discarded packets |
| A | 0 | 22155 | 3 |
| B | 0 | 21222 | 2 |
| C | 0 | 21069 | 2 |
| D | 0 | 19879 | 2 |
| Quadrant | Total seconds | Saturated seconds | Saturation percentage |
|---|---|---|---|
| A | 5275 | 10 | 0.189573% |
| B | 5275 | 5 | 0.094787% |
| C | 5275 | 12 | 0.227488% |
| D | 5275 | 9 | 0.170616% |
Noise dominated data is calculated using 1-second bins in cleaned event files. If a bin has >2000 counts, and if more than 50% of those come from <1% of pixels, then it is considered to be noise-dominated and hence unusable.
| Quadrant | # 1 sec bins | Bins with >0 counts | Bins with >2000 counts | High rate bins dominated by noise | Noise dominated (total time) | Noise dominated (detector-on time) | Marked lightcurve |
|---|---|---|---|---|---|---|---|
| A | 7340 | 5276 | 154 | 154 | 2.10% | 2.92% | 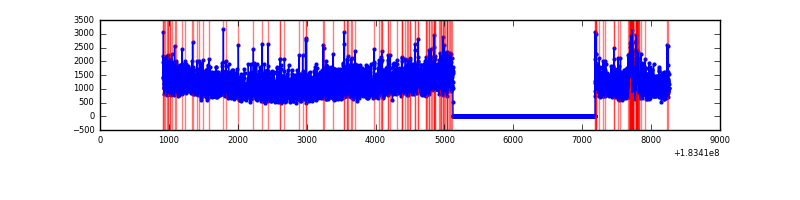 |
| B | 7340 | 5276 | 59 | 59 | 0.80% | 1.12% | 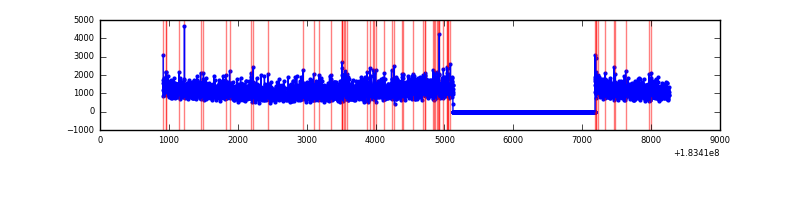 |
| C | 7340 | 5276 | 81 | 81 | 1.10% | 1.54% | 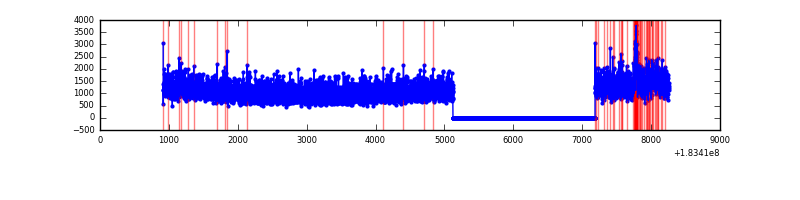 |
| D | 7340 | 5276 | 67 | 67 | 0.91% | 1.27% | 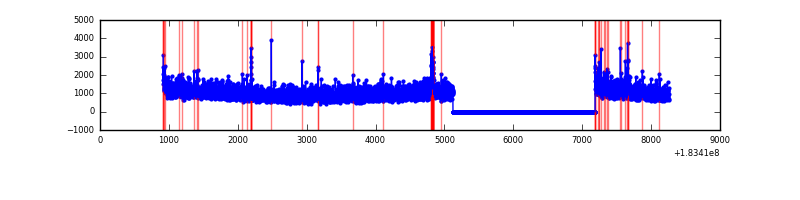 |
Top three noisy pixels from each quadrant. If the there are fewer than three noisy pixels in the level2.evt file, extra rows are filled as -1
| Pixel properties | Quadrant properties | ||||||
|---|---|---|---|---|---|---|---|
| Quadrant | DetID | PixID | Counts | Sigma | Mean | Median | Sigma |
| A | 0 | 238 | 105566 | 310.88 | 1496 | 1478 | 334.8 |
| A | 9 | 111 | 88603 | 260.22 | 1496 | 1478 | 334.8 |
| A | 13 | 17 | 58640 | 170.73 | 1496 | 1478 | 334.8 |
| B | 0 | 220 | 21987 | 57.95 | 1515 | 1521 | 353.2 |
| B | 0 | 182 | 15720 | 40.21 | 1515 | 1521 | 353.2 |
| B | 5 | 46 | 15609 | 39.89 | 1515 | 1521 | 353.2 |
| C | 1 | 1 | 269652 | 691.89 | 1390 | 1440 | 387.6 |
| C | 2 | 53 | 61384 | 154.63 | 1390 | 1440 | 387.6 |
| C | 5 | 234 | 29374 | 72.06 | 1390 | 1440 | 387.6 |
| D | 13 | 51 | 62675 | 147.8 | 1315 | 1366 | 414.8 |
| D | 13 | 155 | 62228 | 146.73 | 1315 | 1366 | 414.8 |
| D | 1 | 5 | 48717 | 114.15 | 1315 | 1366 | 414.8 |
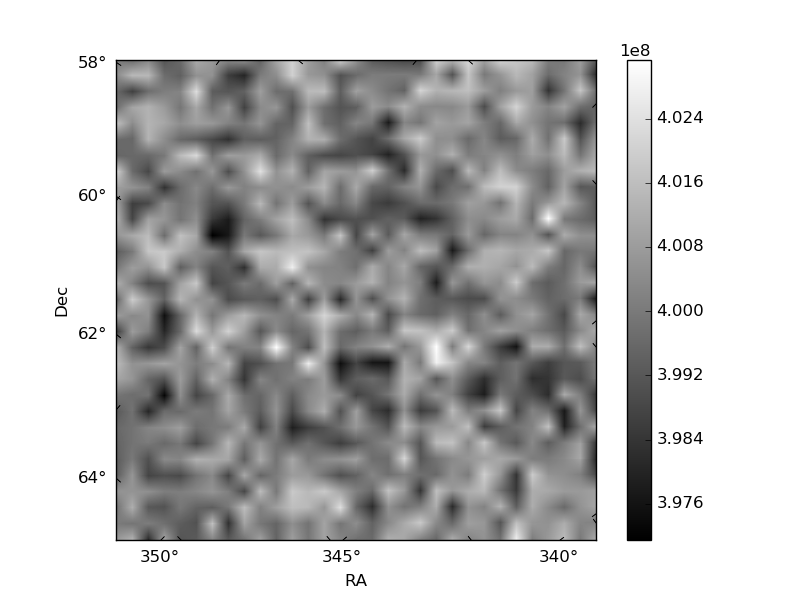
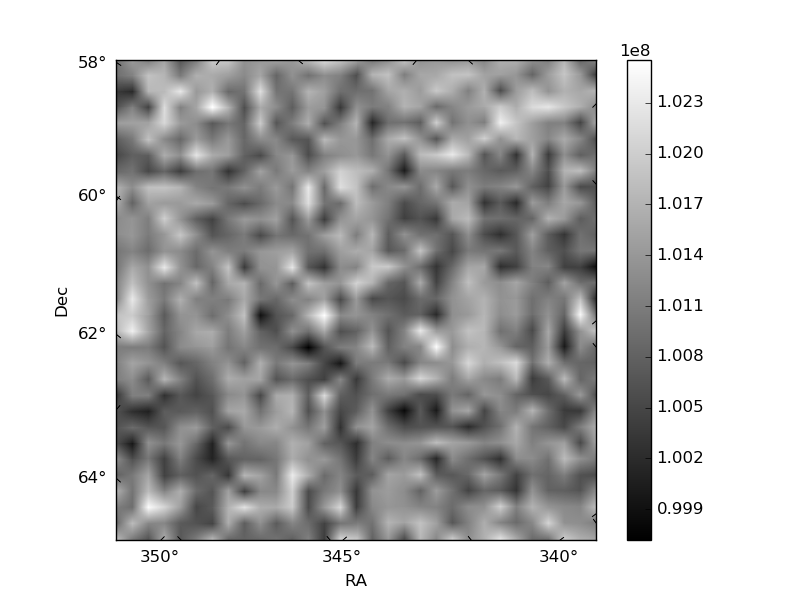
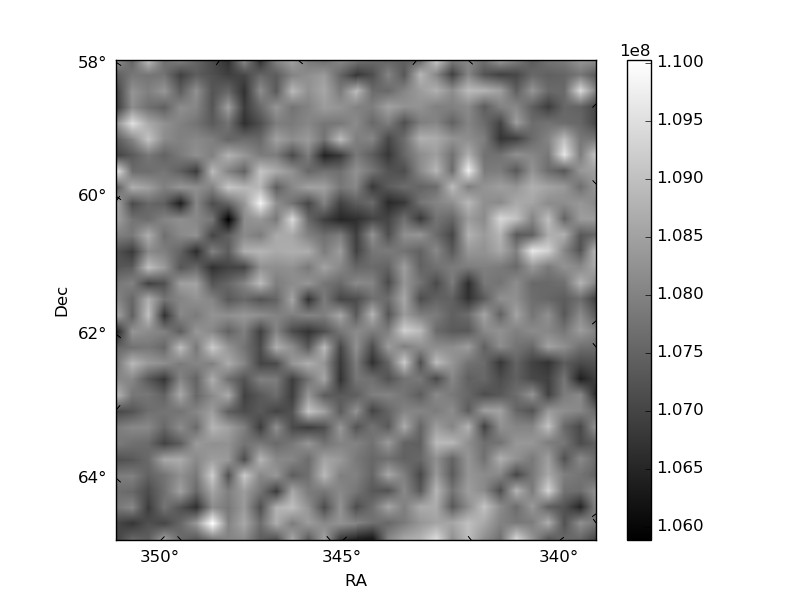
Histogram calculated using DETX and DETY for each event in the final _common_clean file
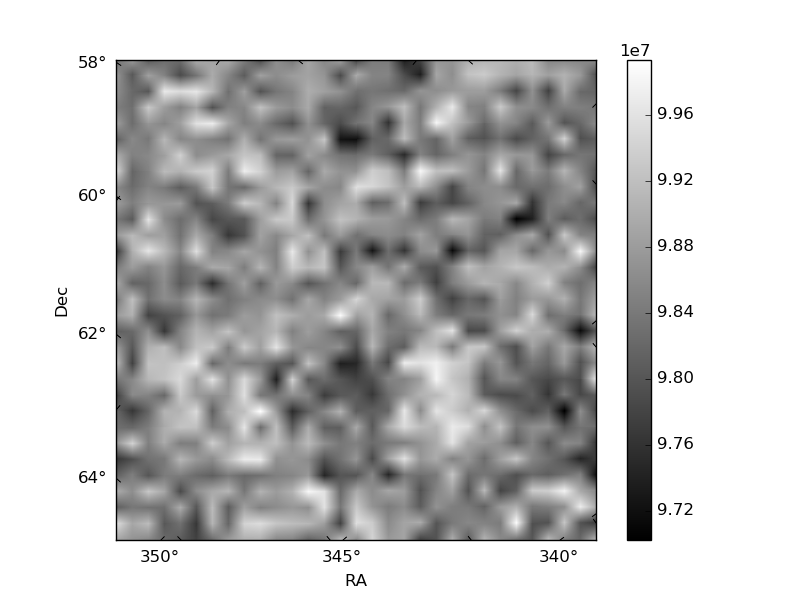
| Quadrant A | 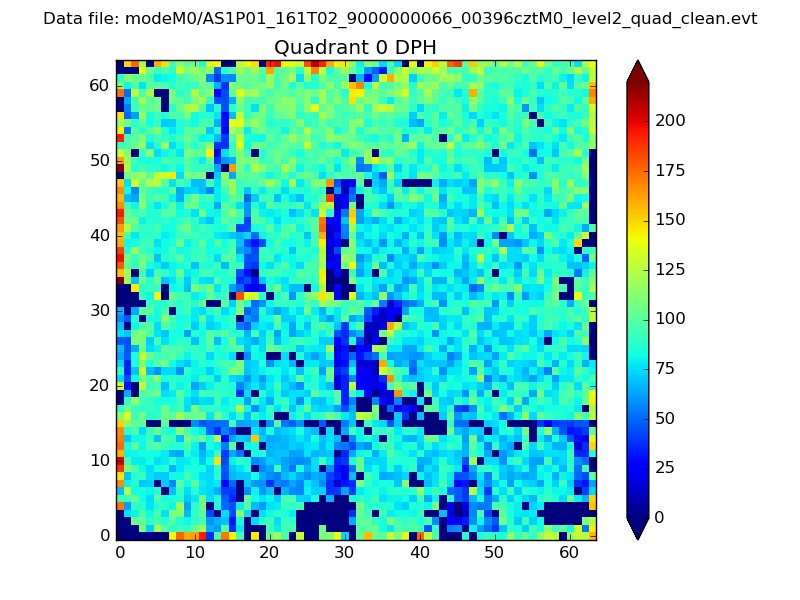 |
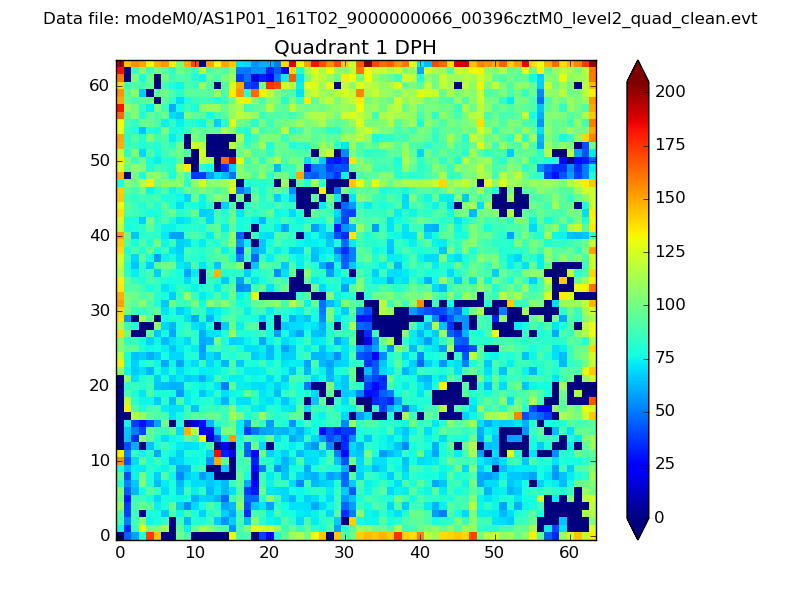 |
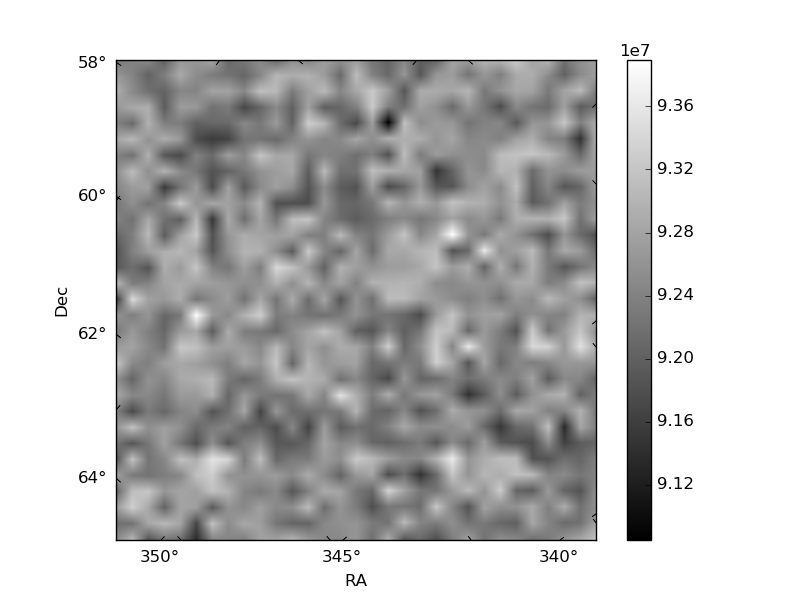
Quadrant B |
|---|---|---|---|
| Quadrant D |  |
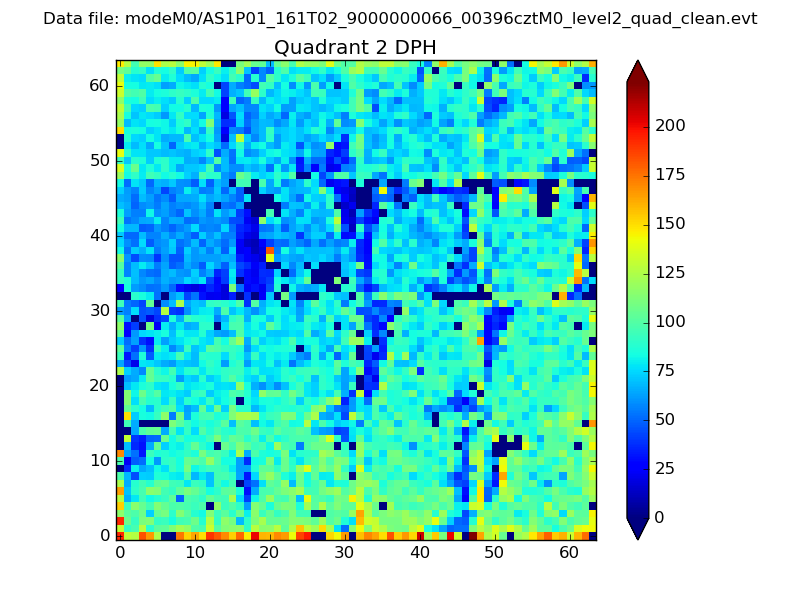 |
Quadrant C |
| Plot type | Count rate plots | Images |
|---|---|---|
| Comparison with Poisson distribution Blue bars denote a histogram of data divided into 1 sec bins. Red curve is a Poisson curve with rate = median count rate of data. |
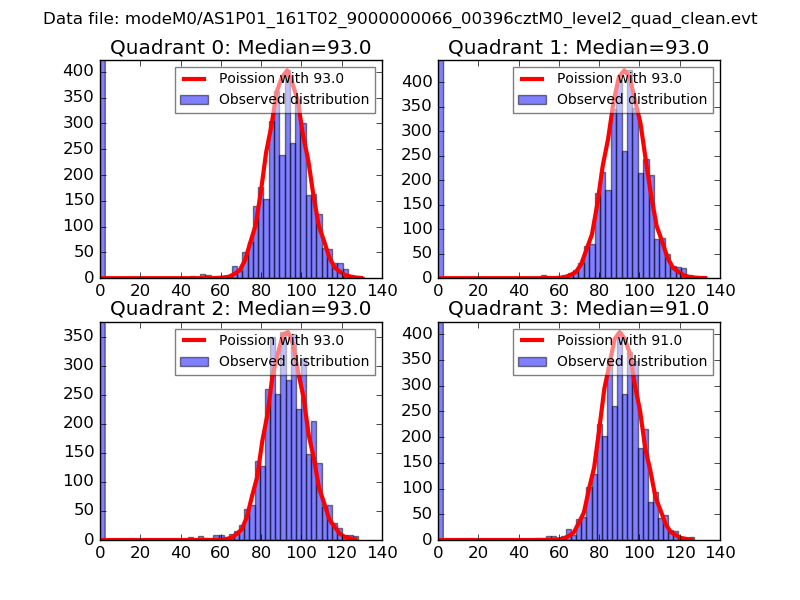 |
 |
| Quadrant-wise count rates Data is divided into 100 sec bins |
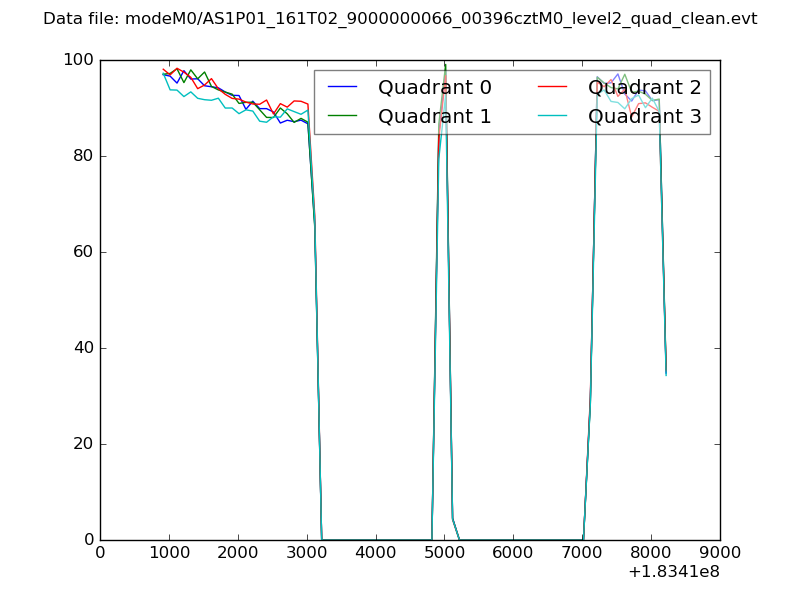 |
|
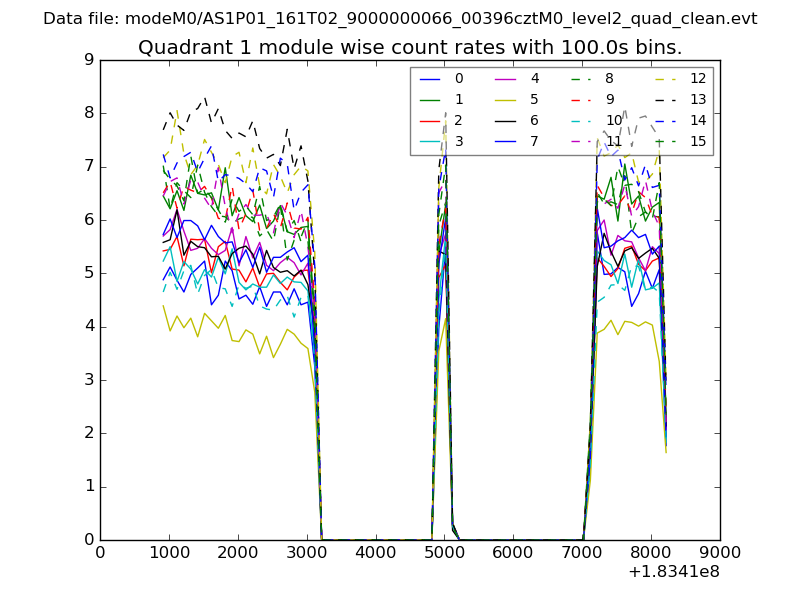
| Module-wise count rates for Quadrant A Data is divided into 100 sec bins |
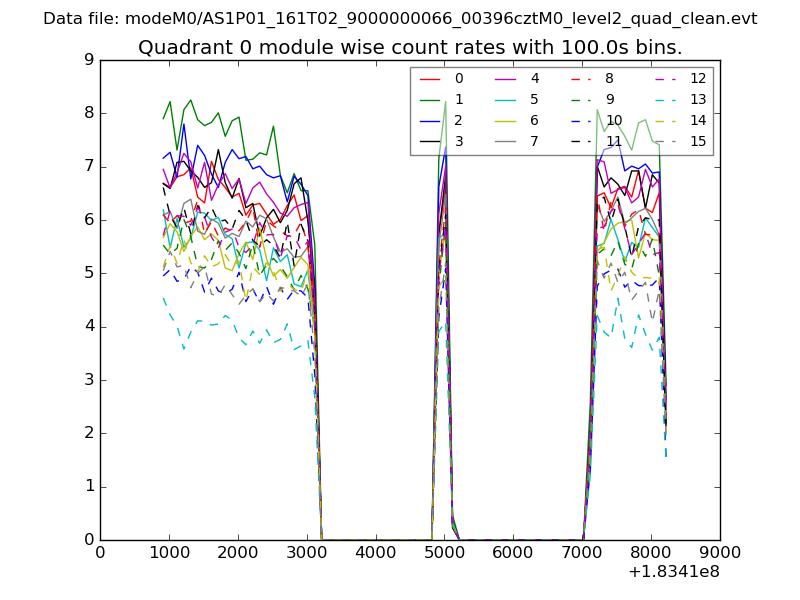 |
 |
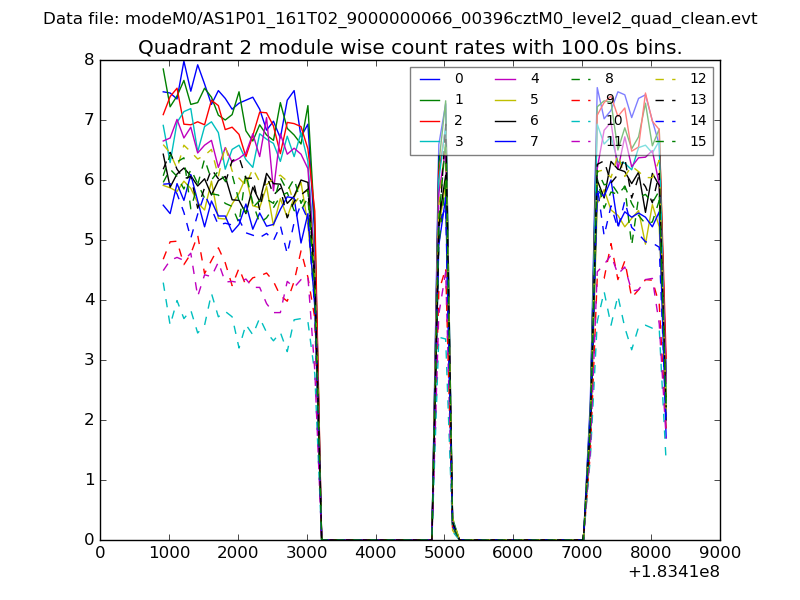
| Module-wise count rates for Quadrant B Data is divided into 100 sec bins |
 |
 |
| Module-wise count rates for Quadrant C Data is divided into 100 sec bins |
 |
 |
| Module-wise count rates for Quadrant D Data is divided into 100 sec bins |
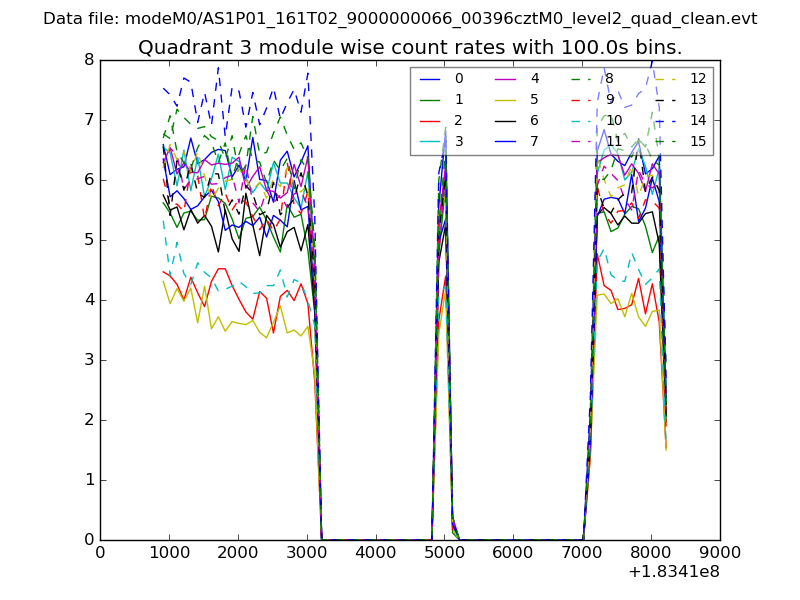 |
 |
| Parameter | Plot |
|---|---|
| CZT HV Monitor | 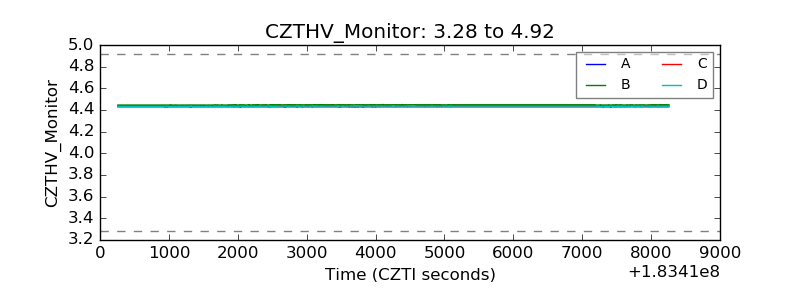 |
| D_VDD | 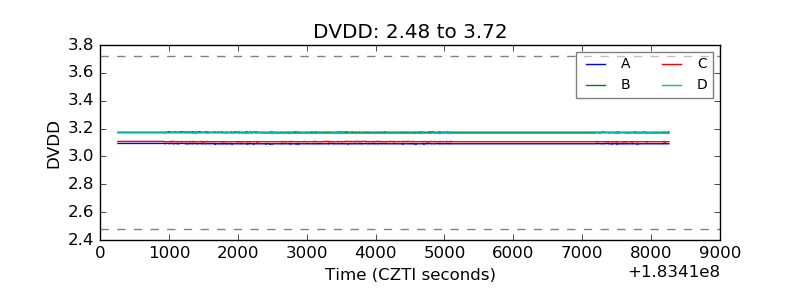 |
| Temperature 1 | 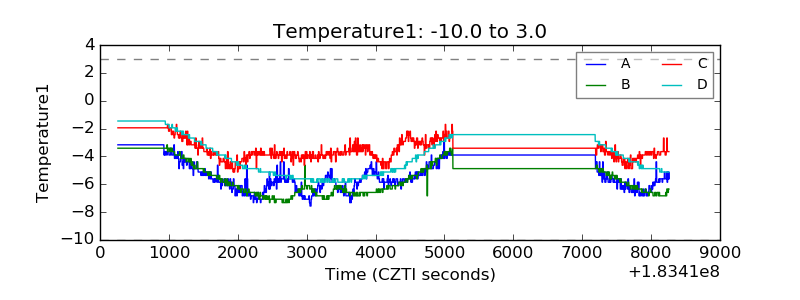 |
| Veto HV Monitor | 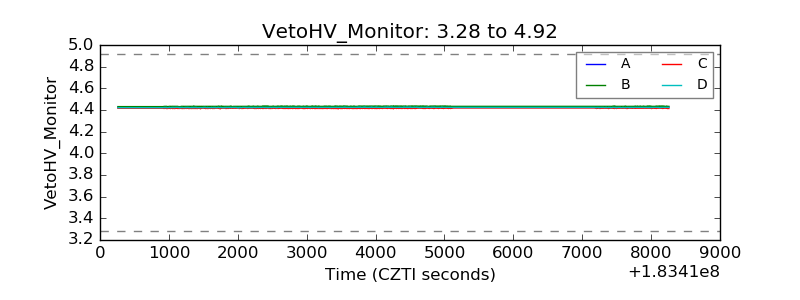 |
| Veto LLD | 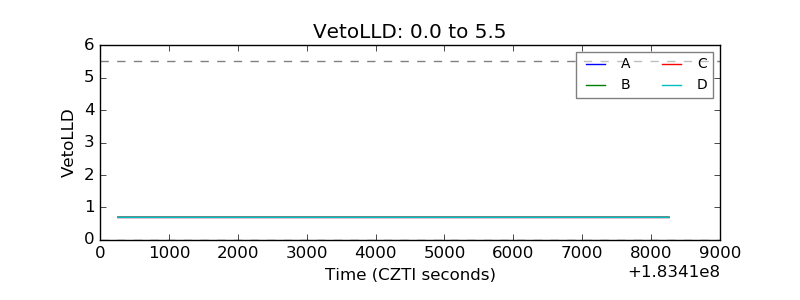 |
| Alpha Counter | 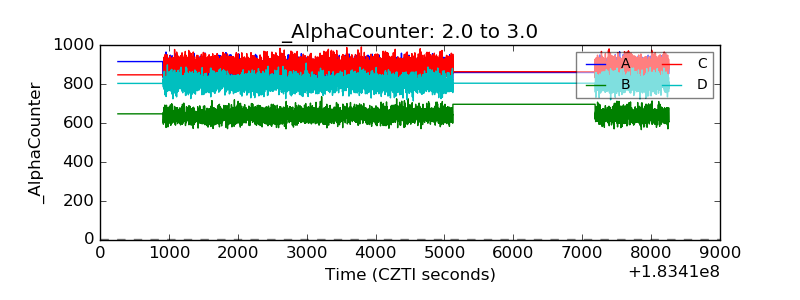 |
| _CPM_Rate | 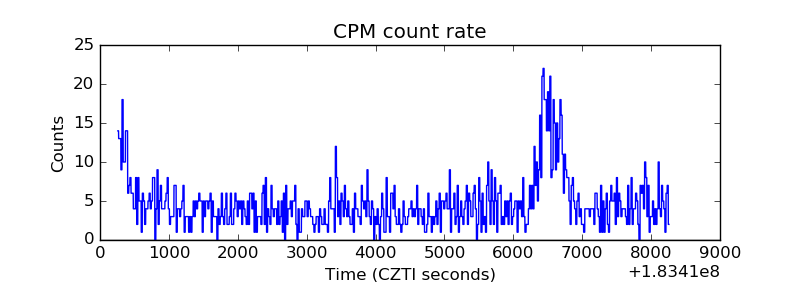 |
| CZT Counter | 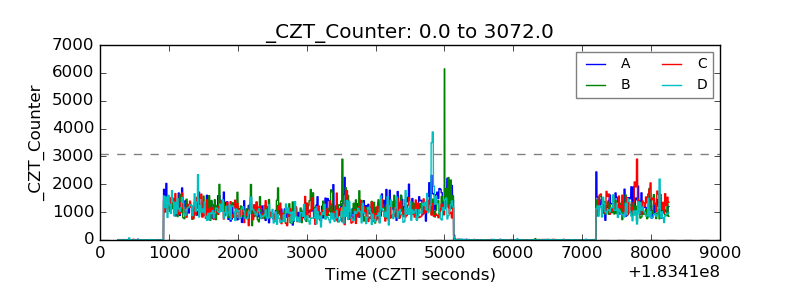 |
| +2.5 Volts monitor | 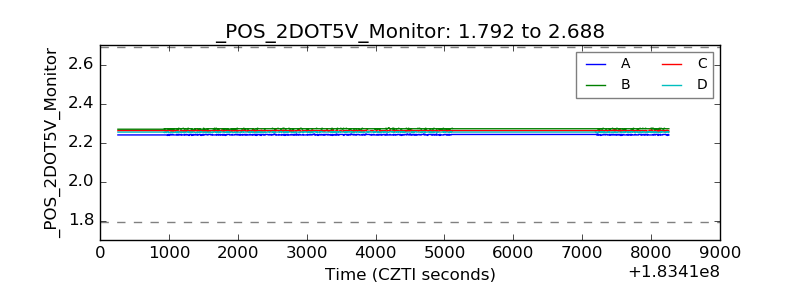 |
| +5 Volts monitor | 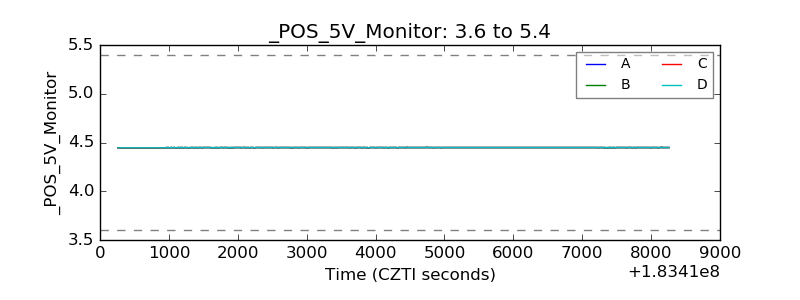 |
| _ROLL_ROT | 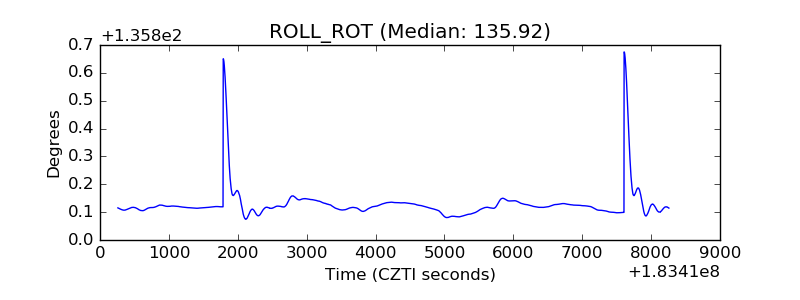 |
| _Roll_DEC | 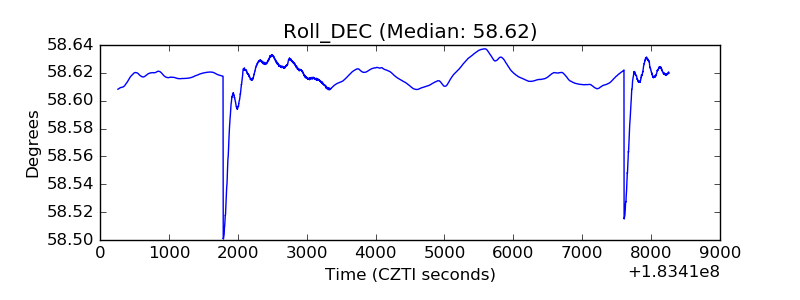 |
| _Roll_RA | 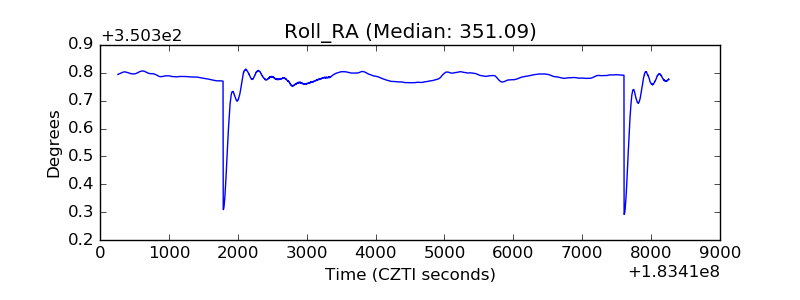 |
| Veto Counter | 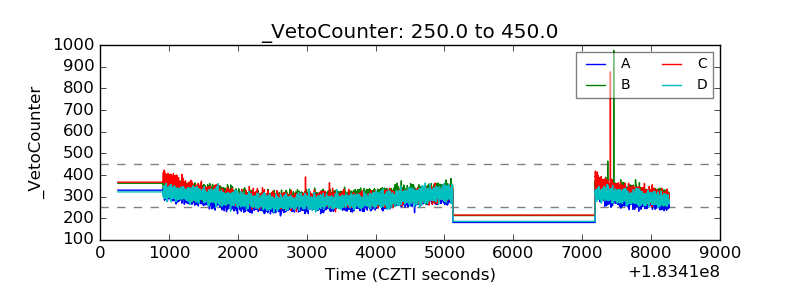 |