| Param | Original file | Final file |
|---|---|---|
| Filename | modeM0/AS1P01_161T02_9000000066_00398cztM0_level2.evt | modeM0/AS1P01_161T02_9000000066_00398cztM0_level2_quad_clean.evt |
| Size (bytes) | 818,864,640 | 51,410,880 |
| Size | 780.9 MB | 49.0 MB |
| Events in quadrant A | 6,607,755 | 299,864 |
| Events in quadrant B | 6,228,315 | 289,626 |
| Events in quadrant C | 6,147,908 | 303,814 |
| Events in quadrant D | 5,458,465 | 287,511 |
| Mode M9 | |||
|---|---|---|---|
| Quadrant | BADHDUFLAG | Total packets | Discarded packets |
| A | 0 | 26 | 0 |
| B | 0 | 26 | 0 |
| C | 0 | 26 | 0 |
| D | 0 | 27 | 0 |
| Mode SS | |||
|---|---|---|---|
| Quadrant | BADHDUFLAG | Total packets | Discarded packets |
| A | 0 | 110 | 0 |
| B | 0 | 110 | 0 |
| C | 0 | 110 | 0 |
| D | 0 | 110 | 0 |
| Mode M0 | |||
|---|---|---|---|
| Quadrant | BADHDUFLAG | Total packets | Discarded packets |
| A | 0 | 23431 | 3 |
| B | 0 | 22341 | 2 |
| C | 0 | 22042 | 2 |
| D | 0 | 20024 | 2 |
| Quadrant | Total seconds | Saturated seconds | Saturation percentage |
|---|---|---|---|
| A | 5359 | 8 | 0.149282% |
| B | 5359 | 5 | 0.093301% |
| C | 5359 | 4 | 0.074641% |
| D | 5359 | 14 | 0.261243% |
Noise dominated data is calculated using 1-second bins in cleaned event files. If a bin has >2000 counts, and if more than 50% of those come from <1% of pixels, then it is considered to be noise-dominated and hence unusable.
| Quadrant | # 1 sec bins | Bins with >0 counts | Bins with >2000 counts | High rate bins dominated by noise | Noise dominated (total time) | Noise dominated (detector-on time) | Marked lightcurve |
|---|---|---|---|---|---|---|---|
| A | 7425 | 5360 | 267 | 267 | 3.60% | 4.98% | 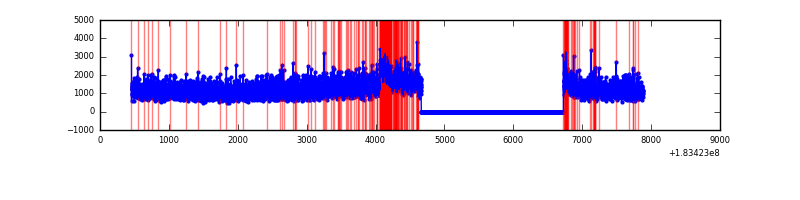 |
| B | 7425 | 5360 | 75 | 75 | 1.01% | 1.40% | 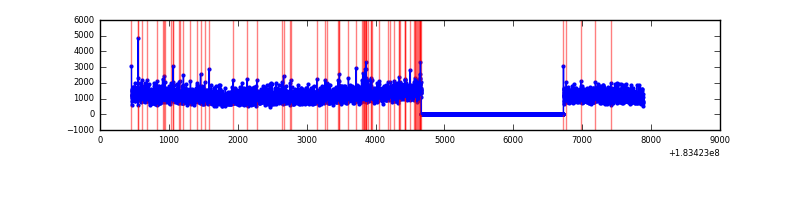 |
| C | 7425 | 5360 | 87 | 87 | 1.17% | 1.62% | 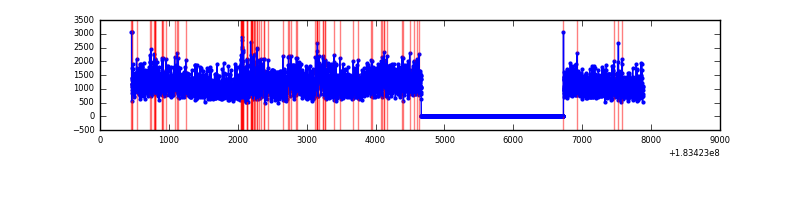 |
| D | 7425 | 5360 | 45 | 45 | 0.61% | 0.84% | 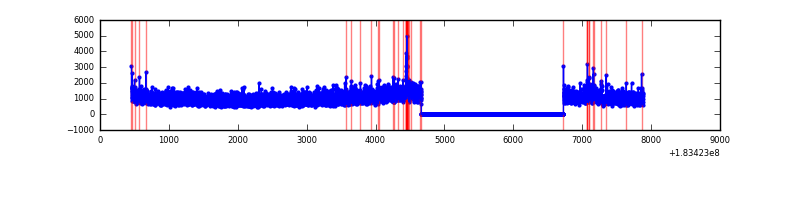 |
Top three noisy pixels from each quadrant. If the there are fewer than three noisy pixels in the level2.evt file, extra rows are filled as -1
| Pixel properties | Quadrant properties | ||||||
|---|---|---|---|---|---|---|---|
| Quadrant | DetID | PixID | Counts | Sigma | Mean | Median | Sigma |
| A | 0 | 69 | 250285 | 696.38 | 1569 | 1548 | 357.2 |
| A | 0 | 238 | 147688 | 409.14 | 1569 | 1548 | 357.2 |
| A | 13 | 17 | 65857 | 180.04 | 1569 | 1548 | 357.2 |
| B | 15 | 82 | 33373 | 84.68 | 1587 | 1599 | 375.2 |
| B | 0 | 220 | 31702 | 80.22 | 1587 | 1599 | 375.2 |
| B | 0 | 182 | 19251 | 47.04 | 1587 | 1599 | 375.2 |
| C | 1 | 1 | 278826 | 697.12 | 1420 | 1470 | 397.9 |
| C | 3 | 9 | 257547 | 643.63 | 1420 | 1470 | 397.9 |
| C | 2 | 53 | 23682 | 55.83 | 1420 | 1470 | 397.9 |
| D | 2 | 154 | 72795 | 170.01 | 1340 | 1390 | 420.0 |
| D | 13 | 155 | 41893 | 96.43 | 1340 | 1390 | 420.0 |
| D | 1 | 4 | 39470 | 90.66 | 1340 | 1390 | 420.0 |
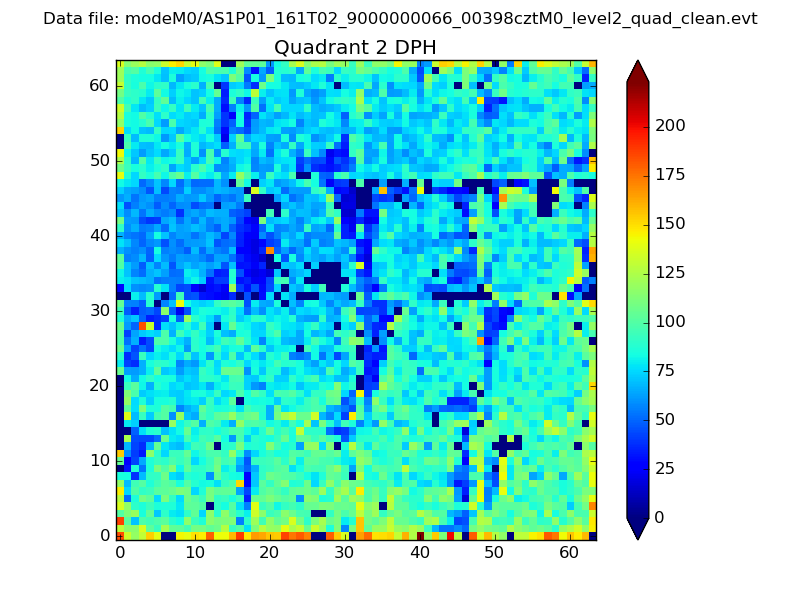
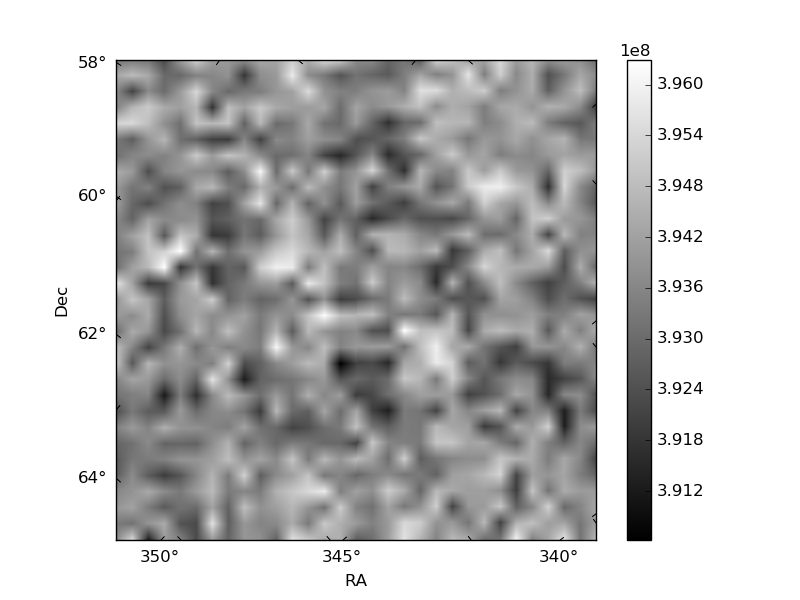
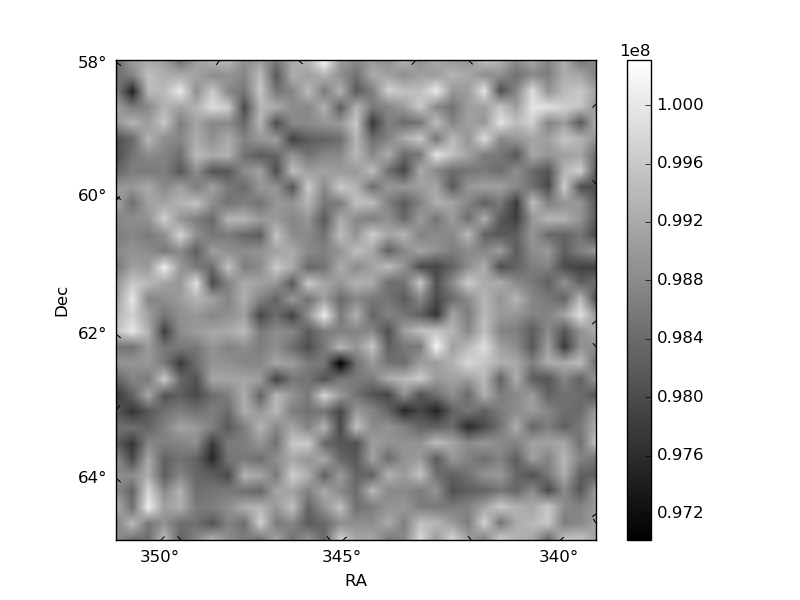
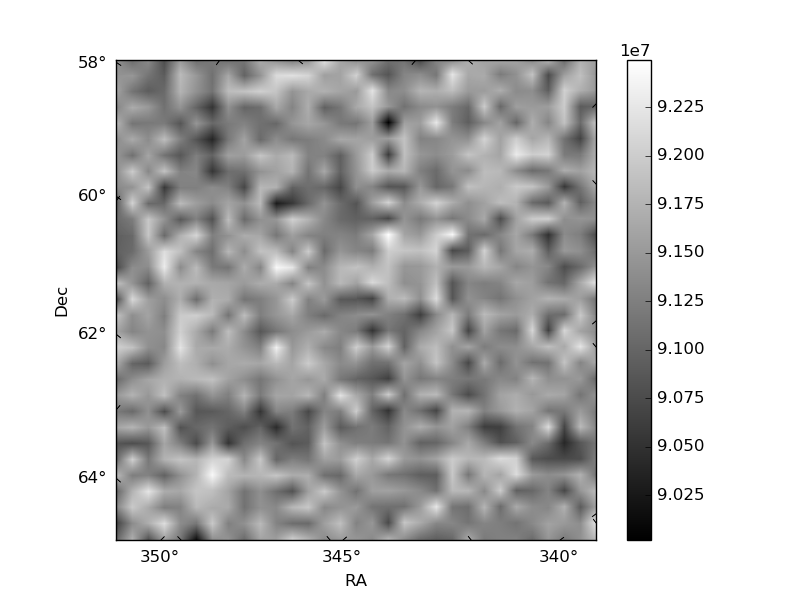
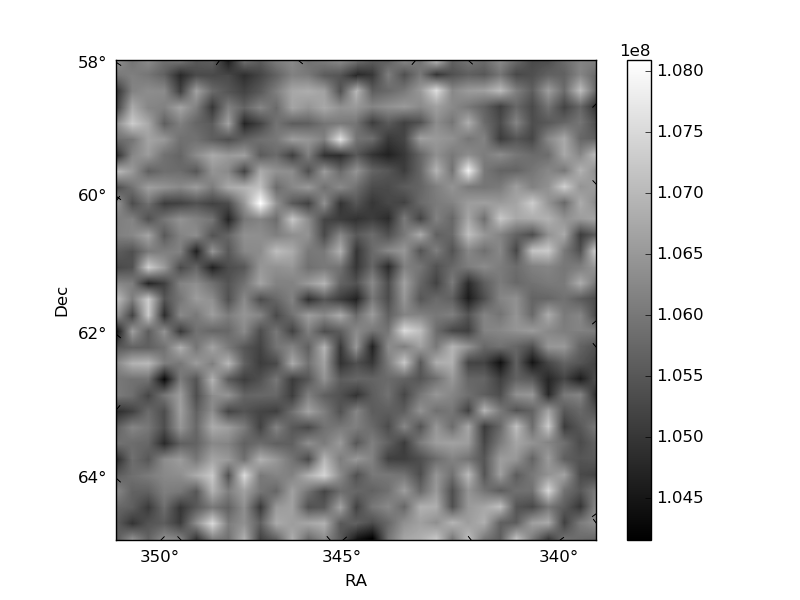
Histogram calculated using DETX and DETY for each event in the final _common_clean file
| Quadrant A | 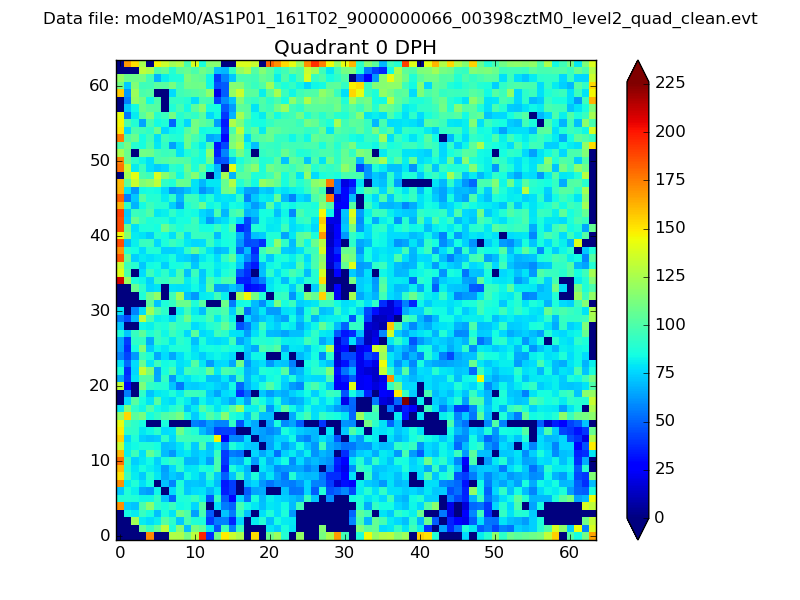 |
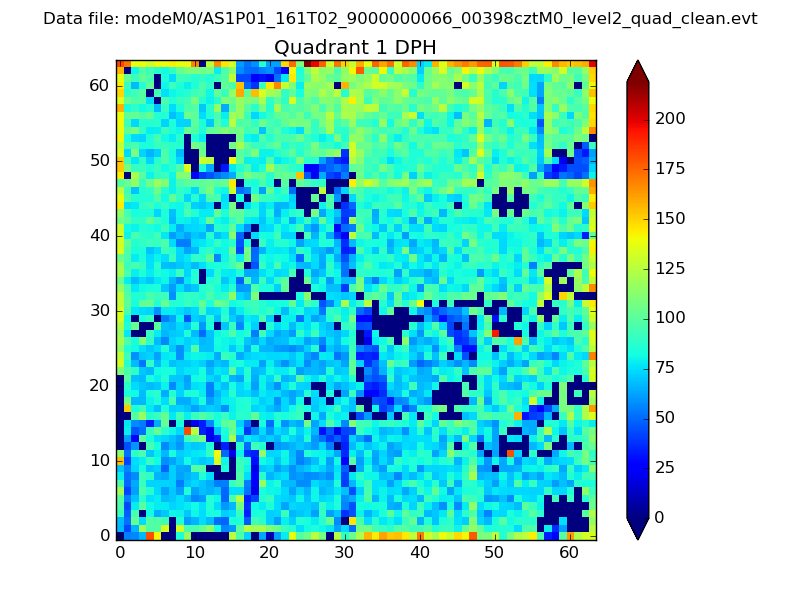 |
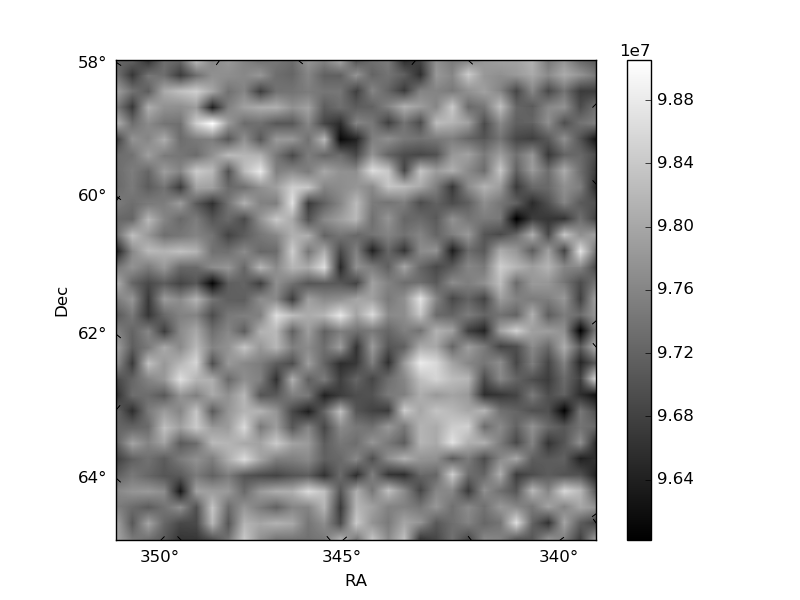
Quadrant B |
|---|---|---|---|
| Quadrant D | 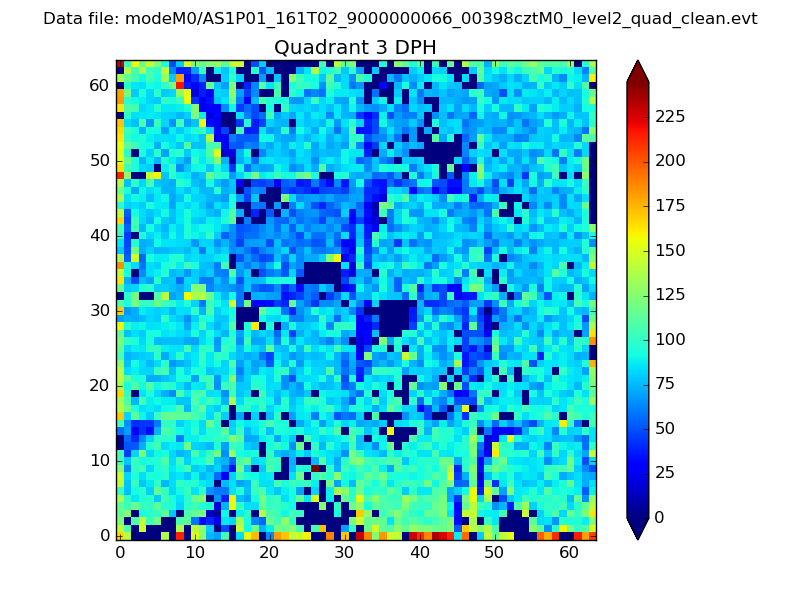 |
 |
Quadrant C |
| Plot type | Count rate plots | Images |
|---|---|---|
| Comparison with Poisson distribution Blue bars denote a histogram of data divided into 1 sec bins. Red curve is a Poisson curve with rate = median count rate of data. |
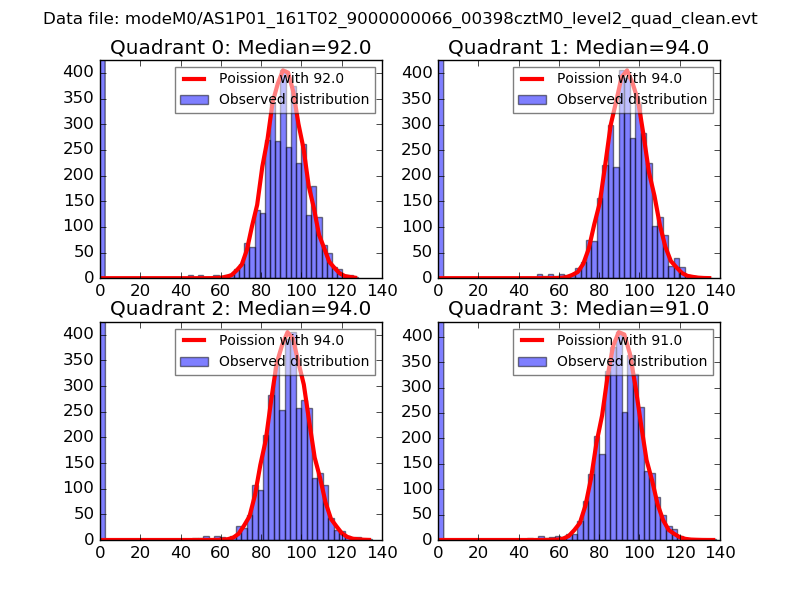 |
 |
| Quadrant-wise count rates Data is divided into 100 sec bins |
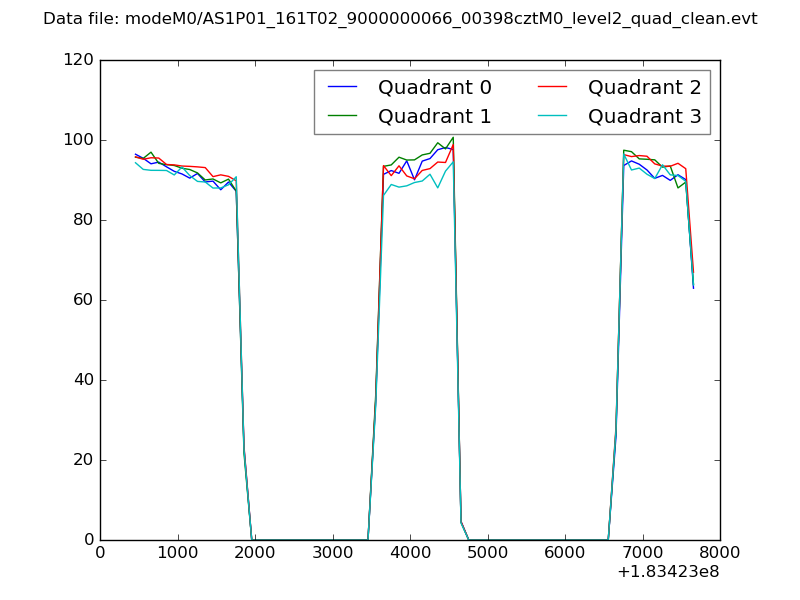 |
|
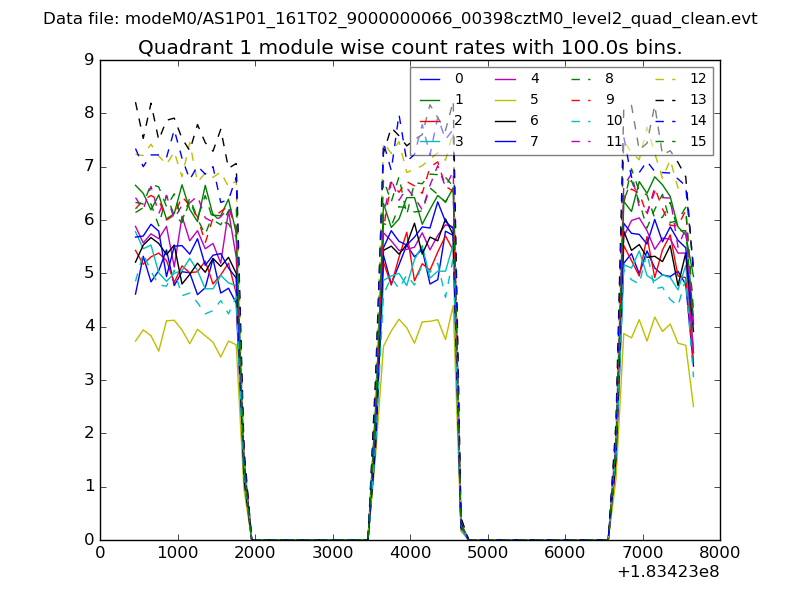
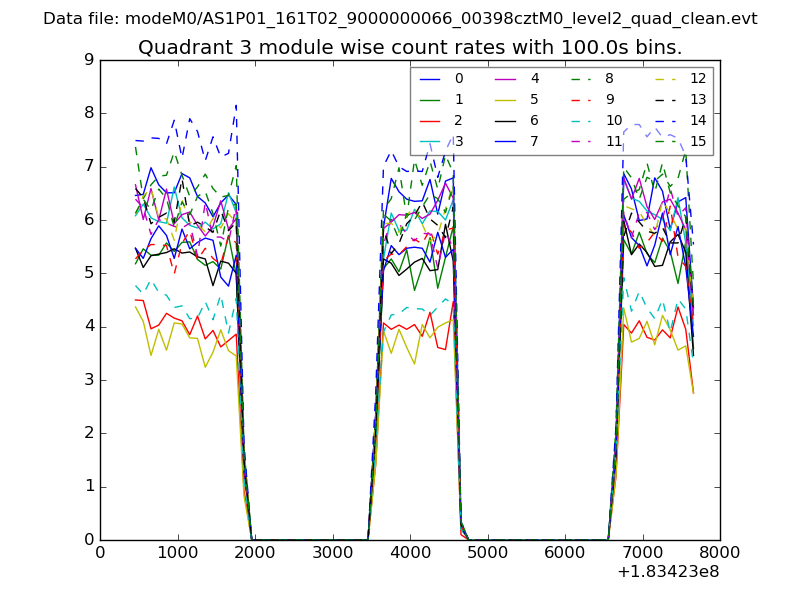
| Module-wise count rates for Quadrant A Data is divided into 100 sec bins |
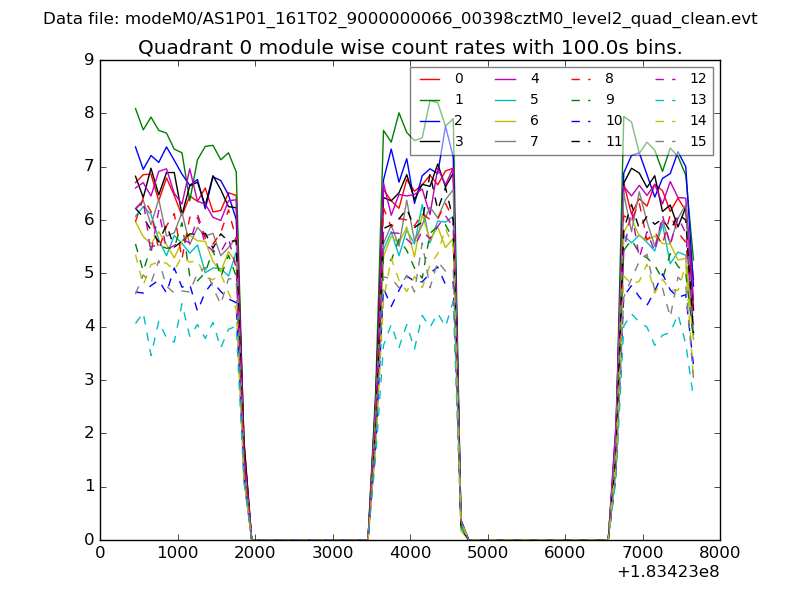 |
 |
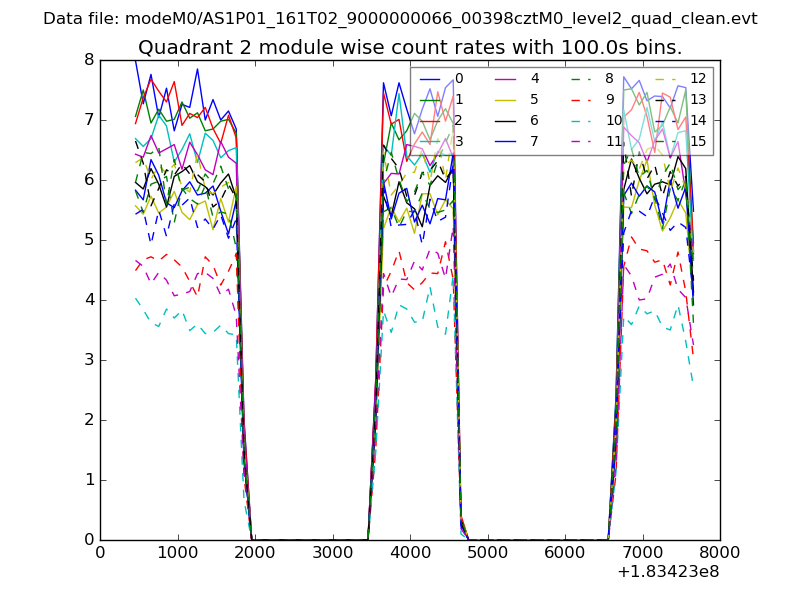
| Module-wise count rates for Quadrant B Data is divided into 100 sec bins |
 |
 |
| Module-wise count rates for Quadrant C Data is divided into 100 sec bins |
 |
 |
| Module-wise count rates for Quadrant D Data is divided into 100 sec bins |
 |
 |
| Parameter | Plot |
|---|---|
| CZT HV Monitor | 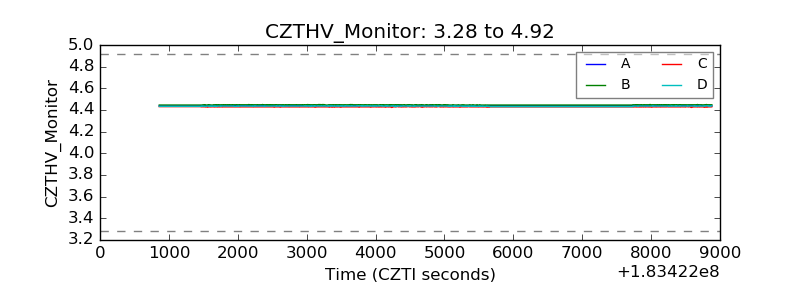 |
| D_VDD | 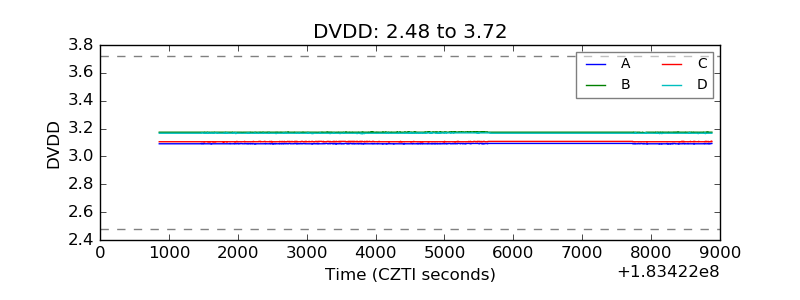 |
| Temperature 1 | 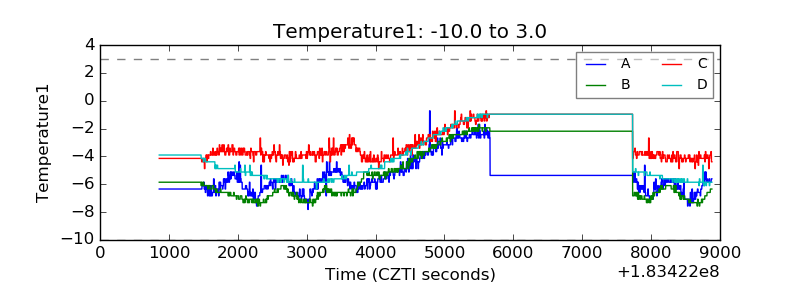 |
| Veto HV Monitor | 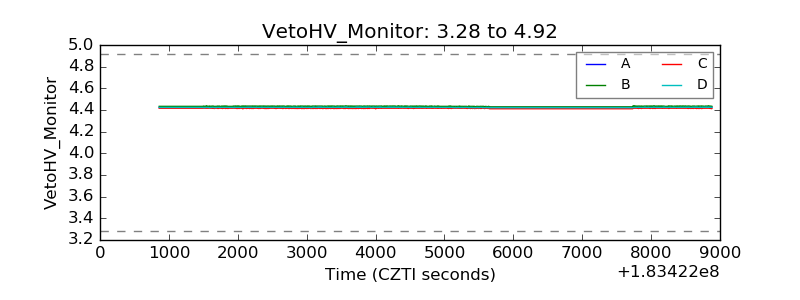 |
| Veto LLD | 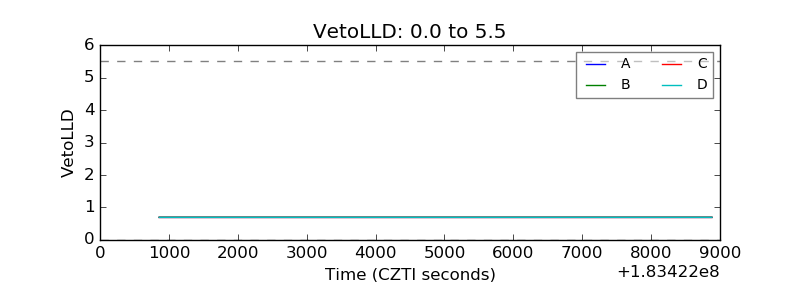 |
| Alpha Counter | 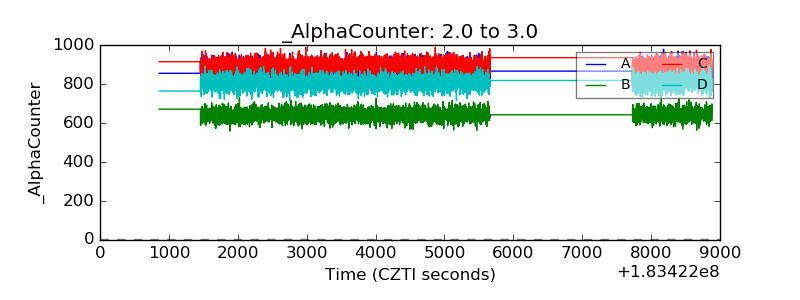 |
| _CPM_Rate | 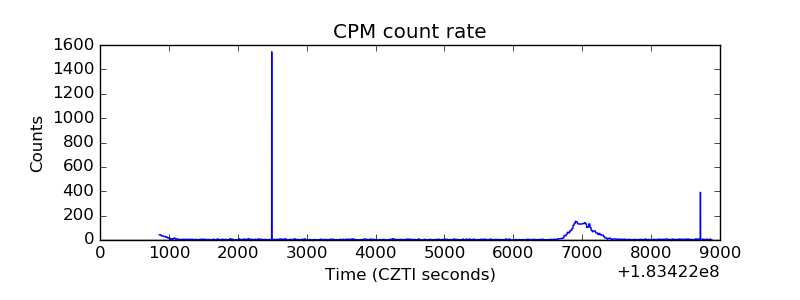 |
| CZT Counter | 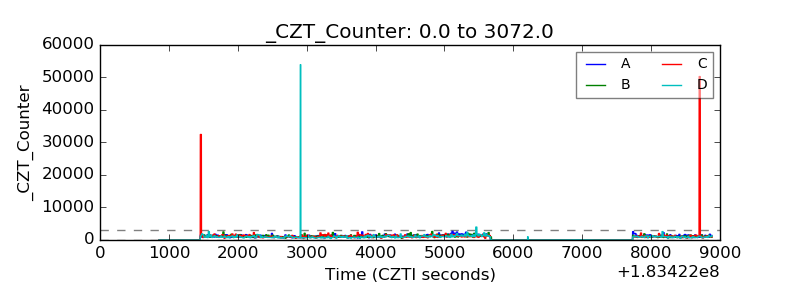 |
| +2.5 Volts monitor | 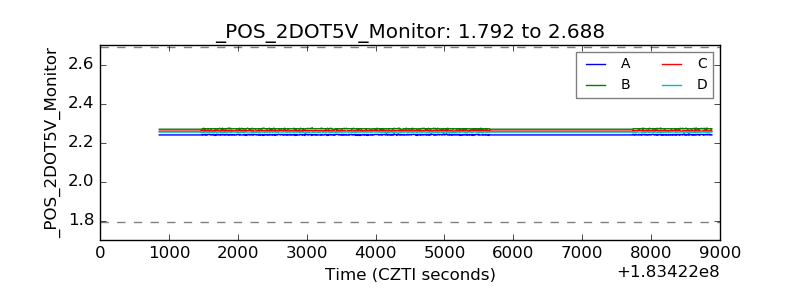 |
| +5 Volts monitor | 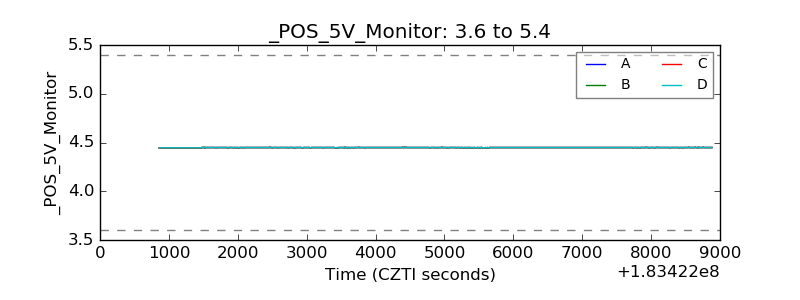 |
| _ROLL_ROT | 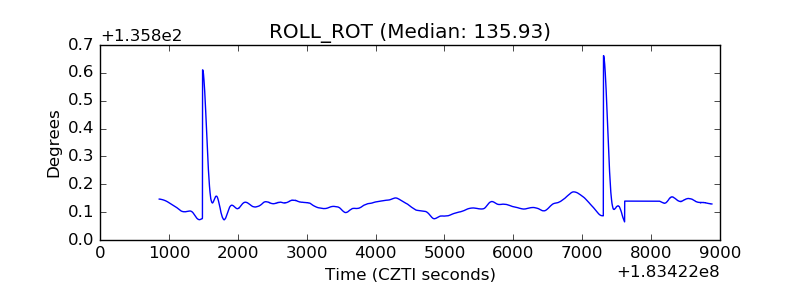 |
| _Roll_DEC | 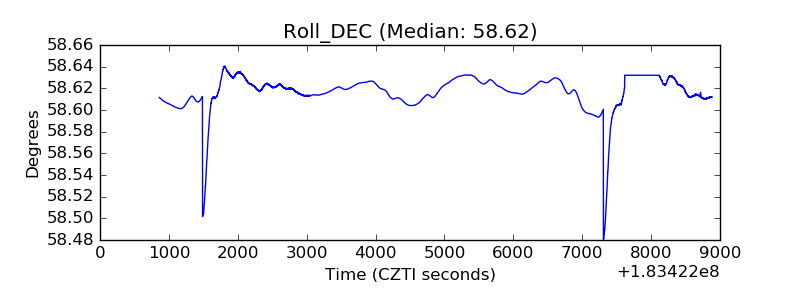 |
| _Roll_RA | 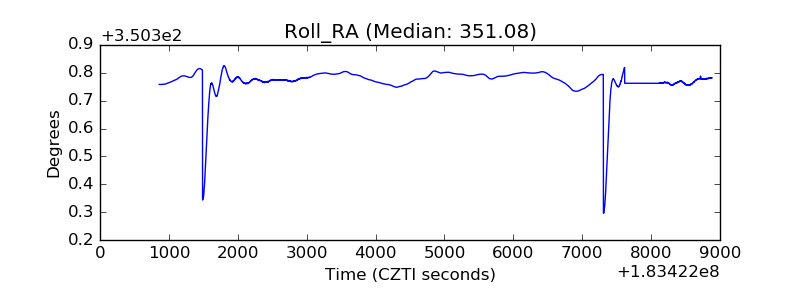 |
| Veto Counter | 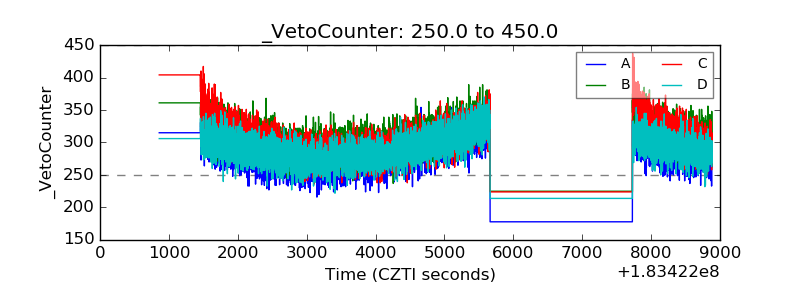 |