| Param | Original file | Final file |
|---|---|---|
| Filename | modeM0/AS1P01_161T02_9000000066_00399cztM0_level2.evt | modeM0/AS1P01_161T02_9000000066_00399cztM0_level2_quad_clean.evt |
| Size (bytes) | 814,547,520 | 41,857,920 |
| Size | 776.8 MB | 39.9 MB |
| Events in quadrant A | 6,398,989 | 230,664 |
| Events in quadrant B | 5,950,936 | 223,619 |
| Events in quadrant C | 6,436,893 | 230,415 |
| Events in quadrant D | 5,538,258 | 220,183 |
| Mode M9 | |||
|---|---|---|---|
| Quadrant | BADHDUFLAG | Total packets | Discarded packets |
| A | 0 | 21 | 0 |
| B | 0 | 21 | 0 |
| C | 0 | 21 | 0 |
| D | 0 | 21 | 0 |
| Mode SS | |||
|---|---|---|---|
| Quadrant | BADHDUFLAG | Total packets | Discarded packets |
| A | 0 | 104 | 0 |
| B | 0 | 104 | 0 |
| C | 0 | 104 | 0 |
| D | 0 | 104 | 0 |
| Mode M0 | |||
|---|---|---|---|
| Quadrant | BADHDUFLAG | Total packets | Discarded packets |
| A | 0 | 22692 | 2 |
| B | 0 | 21329 | 1 |
| C | 0 | 22803 | 1 |
| D | 0 | 20158 | 1 |
| Quadrant | Total seconds | Saturated seconds | Saturation percentage |
|---|---|---|---|
| A | 5169 | 28 | 0.541691% |
| B | 5169 | 2 | 0.038692% |
| C | 5169 | 108 | 2.089379% |
| D | 5169 | 11 | 0.212807% |
Noise dominated data is calculated using 1-second bins in cleaned event files. If a bin has >2000 counts, and if more than 50% of those come from <1% of pixels, then it is considered to be noise-dominated and hence unusable.
| Quadrant | # 1 sec bins | Bins with >0 counts | Bins with >2000 counts | High rate bins dominated by noise | Noise dominated (total time) | Noise dominated (detector-on time) | Marked lightcurve |
|---|---|---|---|---|---|---|---|
| A | 7233 | 5170 | 178 | 178 | 2.46% | 3.44% |  |
| B | 7233 | 5170 | 41 | 41 | 0.57% | 0.79% | 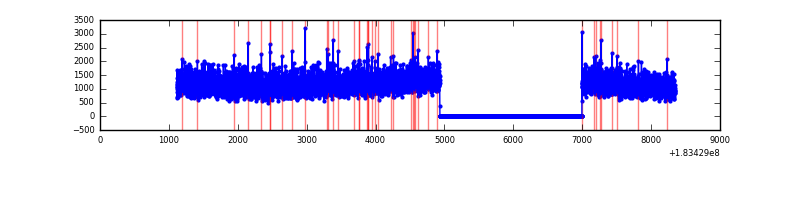 |
| C | 7233 | 5170 | 346 | 346 | 4.78% | 6.69% | 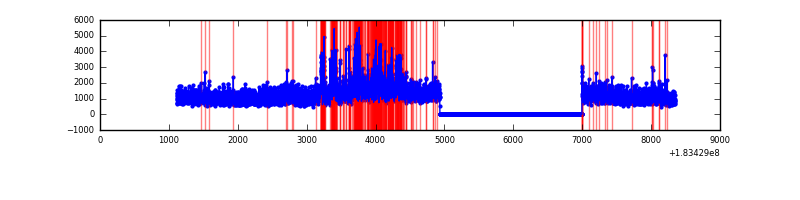 |
| D | 7233 | 5170 | 90 | 90 | 1.24% | 1.74% | 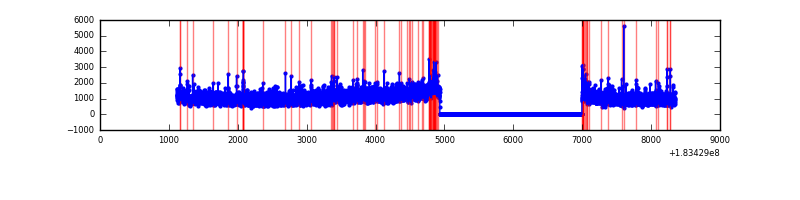 |
Top three noisy pixels from each quadrant. If the there are fewer than three noisy pixels in the level2.evt file, extra rows are filled as -1
| Pixel properties | Quadrant properties | ||||||
|---|---|---|---|---|---|---|---|
| Quadrant | DetID | PixID | Counts | Sigma | Mean | Median | Sigma |
| A | 0 | 238 | 154883 | 437.82 | 1551 | 1534 | 350.3 |
| A | 12 | 150 | 85868 | 240.78 | 1551 | 1534 | 350.3 |
| A | 12 | 133 | 57202 | 158.93 | 1551 | 1534 | 350.3 |
| B | 0 | 220 | 22358 | 56.4 | 1539 | 1546 | 369.0 |
| B | 5 | 46 | 19210 | 47.87 | 1539 | 1546 | 369.0 |
| B | 12 | 52 | 8131 | 17.85 | 1539 | 1546 | 369.0 |
| C | 3 | 159 | 648677 | 1710.93 | 1354 | 1404 | 378.3 |
| C | 1 | 1 | 434046 | 1143.6 | 1354 | 1404 | 378.3 |
| C | 2 | 53 | 19942 | 49.0 | 1354 | 1404 | 378.3 |
| D | 2 | 154 | 81506 | 193.08 | 1314 | 1365 | 415.1 |
| D | 1 | 36 | 56801 | 133.56 | 1314 | 1365 | 415.1 |
| D | 13 | 51 | 47960 | 112.26 | 1314 | 1365 | 415.1 |
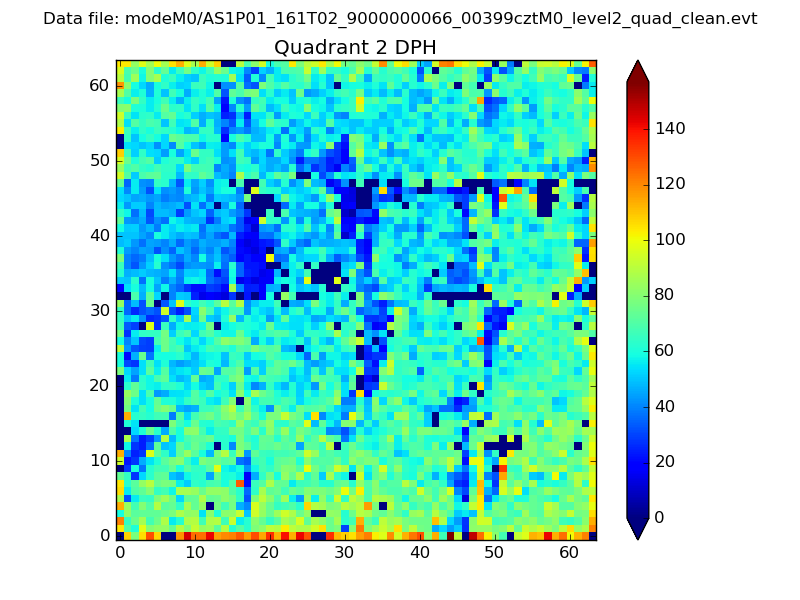
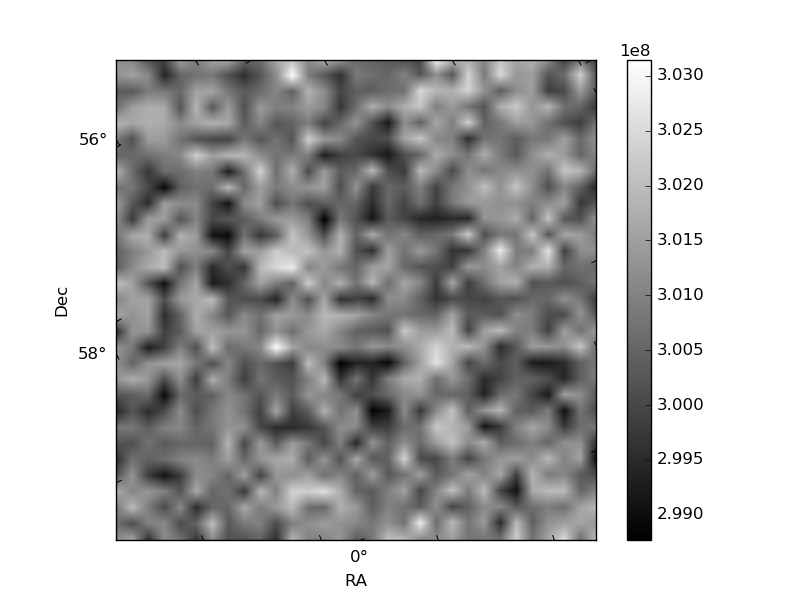
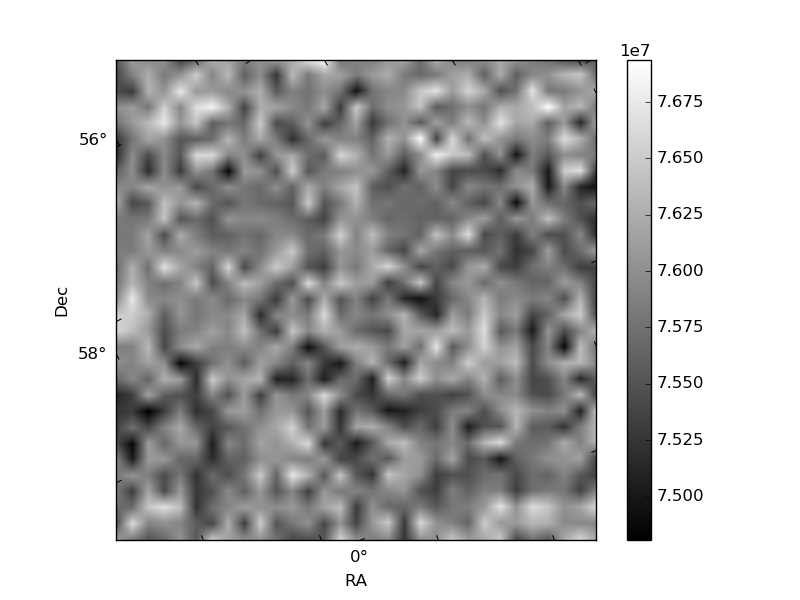
Histogram calculated using DETX and DETY for each event in the final _common_clean file
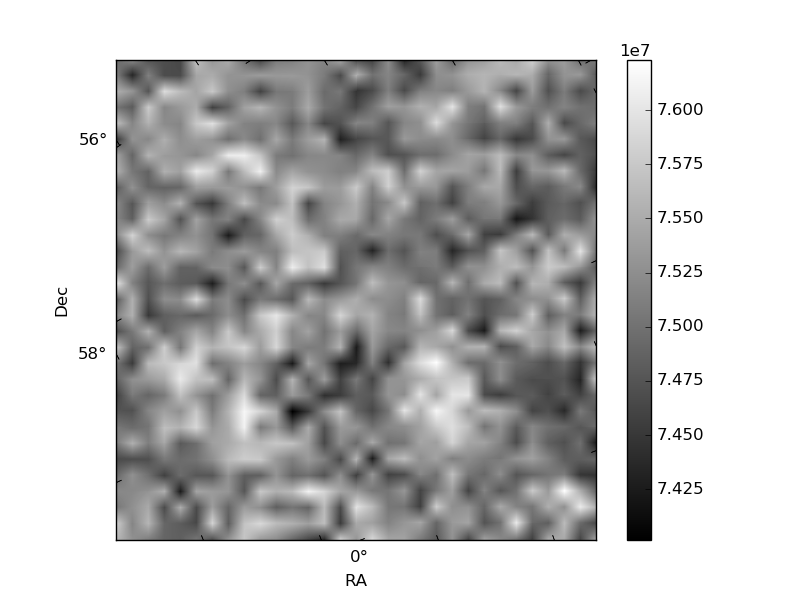
| Quadrant A | 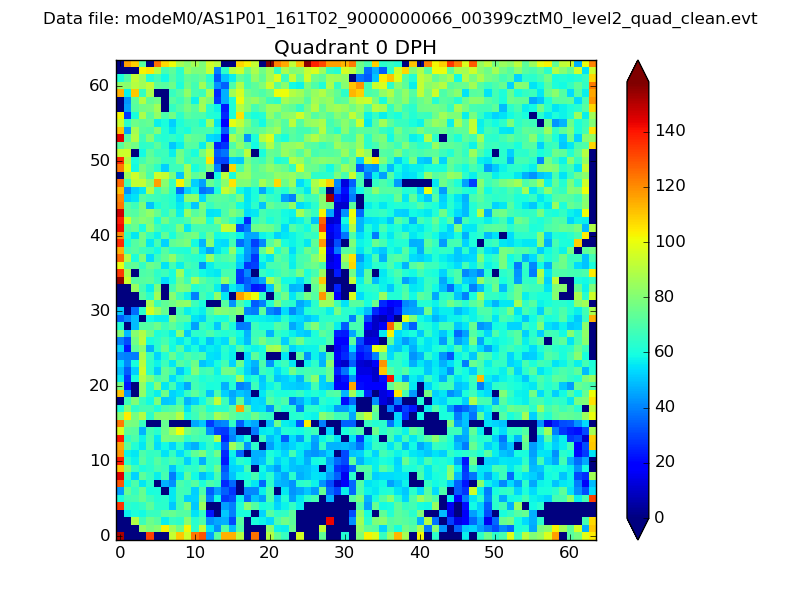 |
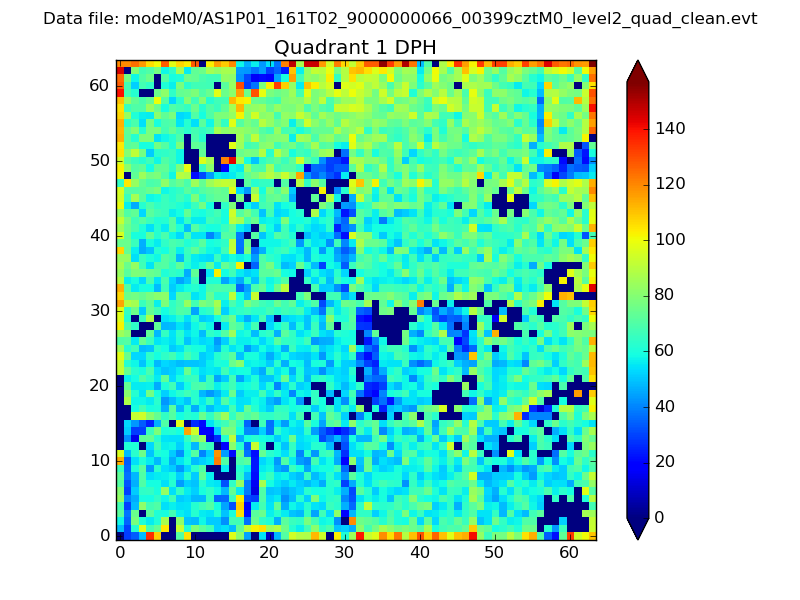 |
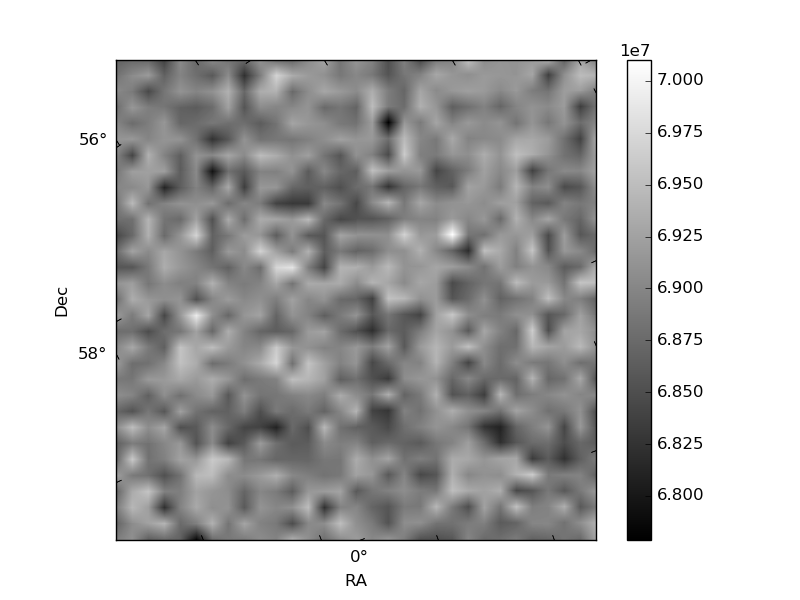
Quadrant B |
|---|---|---|---|
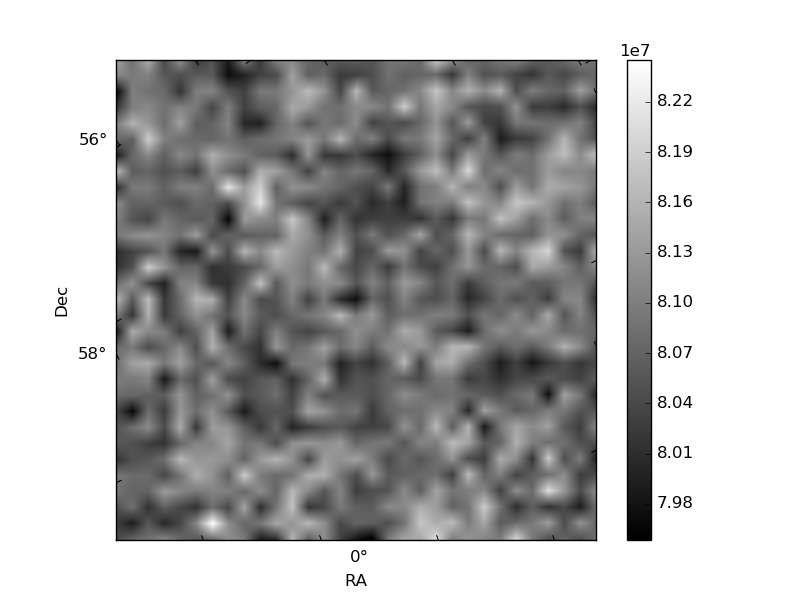
| Quadrant D | 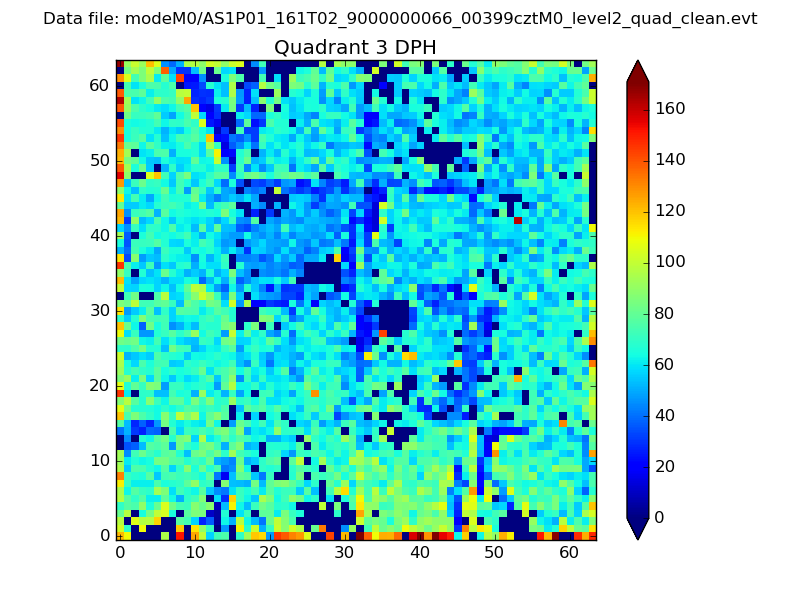 |
 |
Quadrant C |
| Plot type | Count rate plots | Images |
|---|---|---|
| Comparison with Poisson distribution Blue bars denote a histogram of data divided into 1 sec bins. Red curve is a Poisson curve with rate = median count rate of data. |
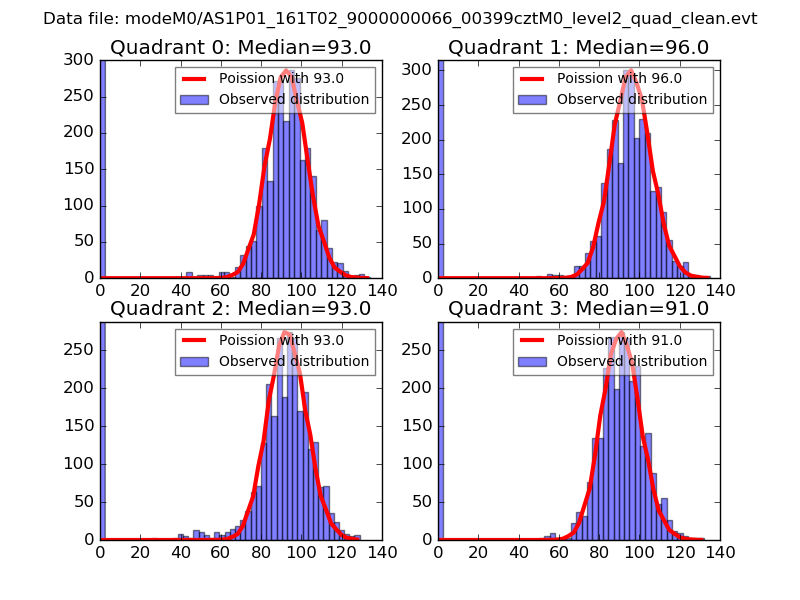 |
 |
| Quadrant-wise count rates Data is divided into 100 sec bins |
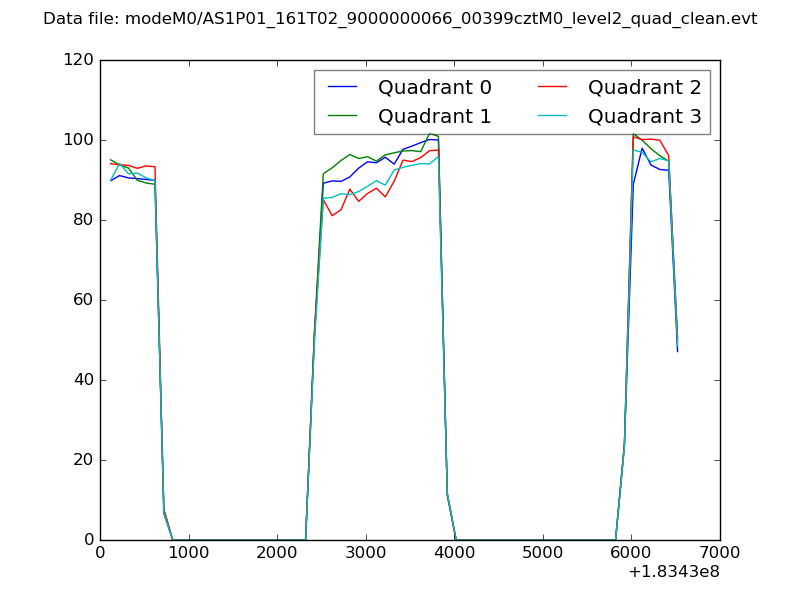 |
|
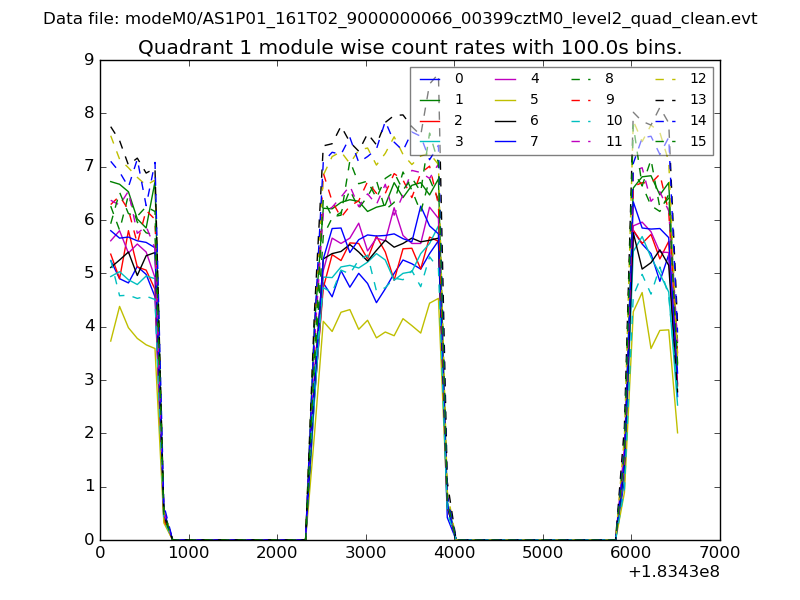
| Module-wise count rates for Quadrant A Data is divided into 100 sec bins |
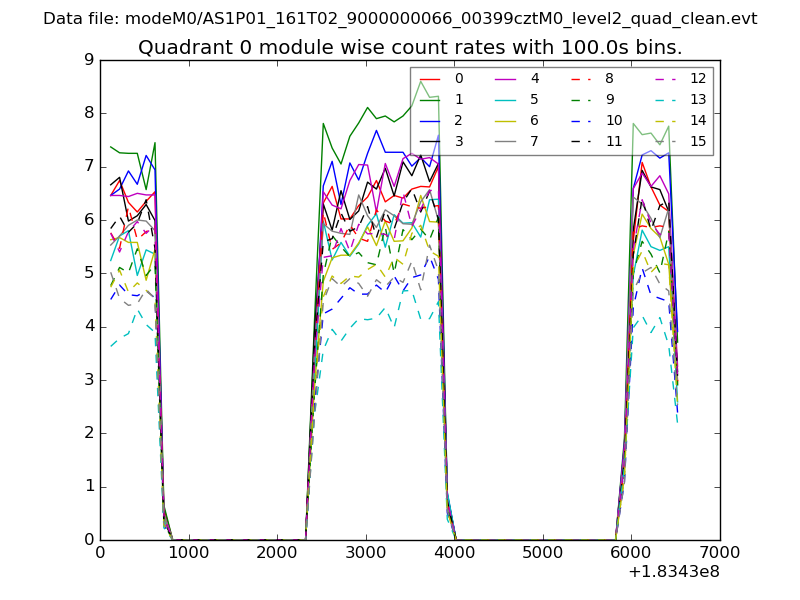 |
 |
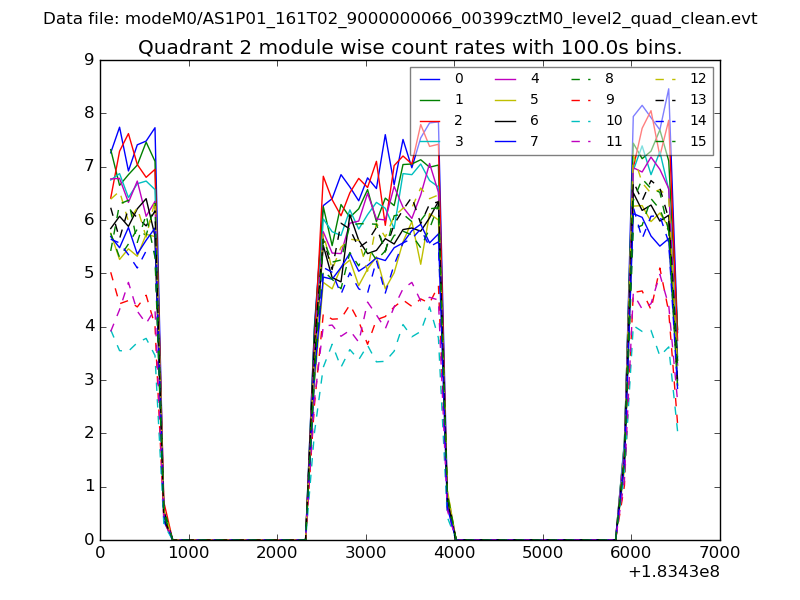
| Module-wise count rates for Quadrant B Data is divided into 100 sec bins |
 |
 |
| Module-wise count rates for Quadrant C Data is divided into 100 sec bins |
 |
 |
| Module-wise count rates for Quadrant D Data is divided into 100 sec bins |
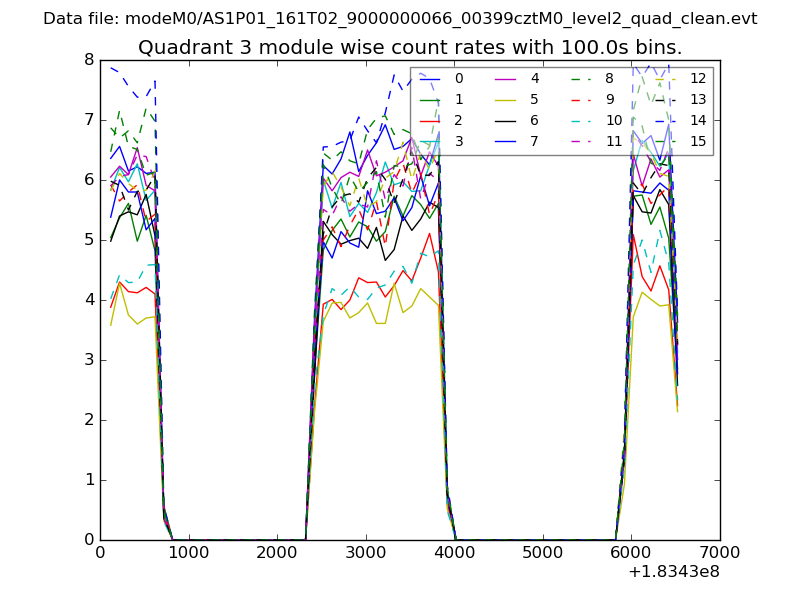 |
 |
| Parameter | Plot |
|---|---|
| CZT HV Monitor | 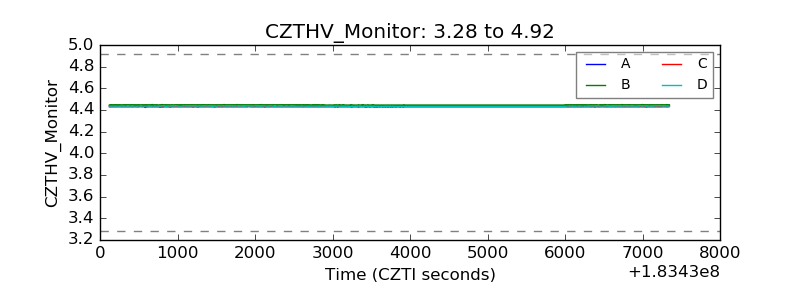 |
| D_VDD |  |
| Temperature 1 | 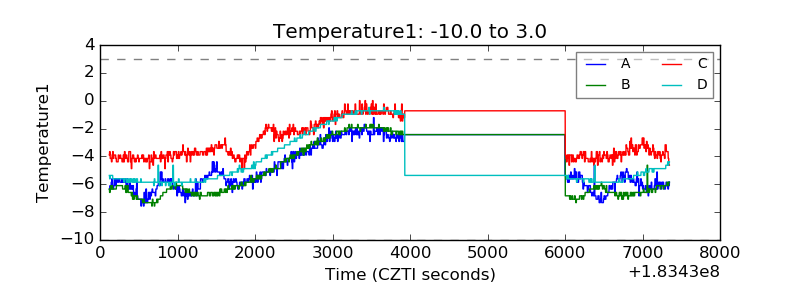 |
| Veto HV Monitor | 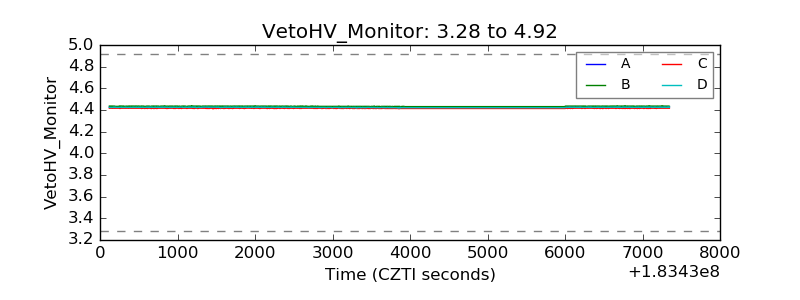 |
| Veto LLD | 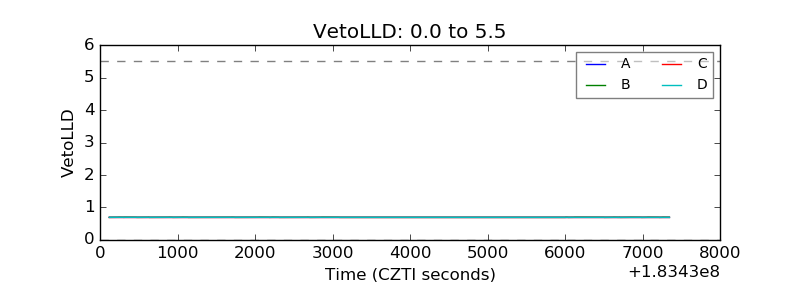 |
| Alpha Counter | 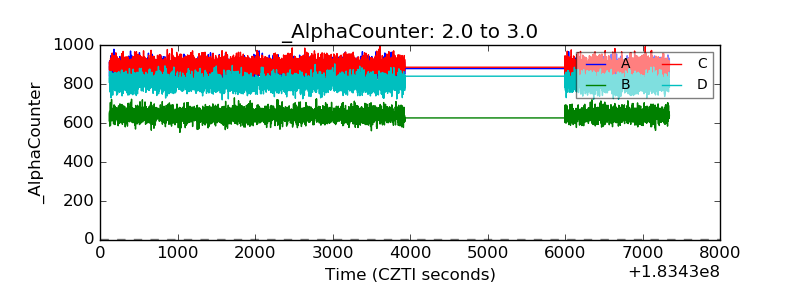 |
| _CPM_Rate | 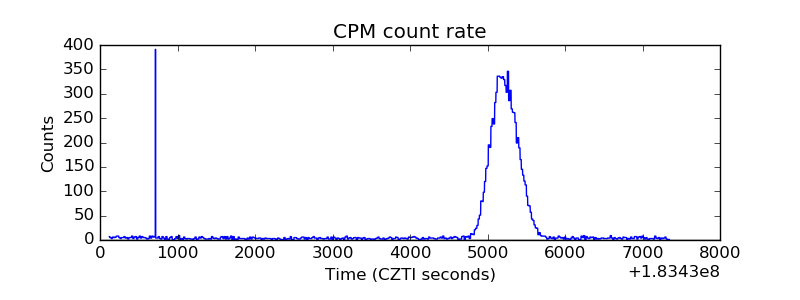 |
| CZT Counter | 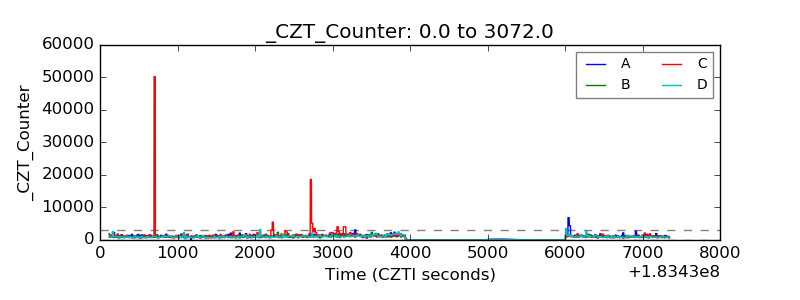 |
| +2.5 Volts monitor |  |
| +5 Volts monitor |  |
| _ROLL_ROT | 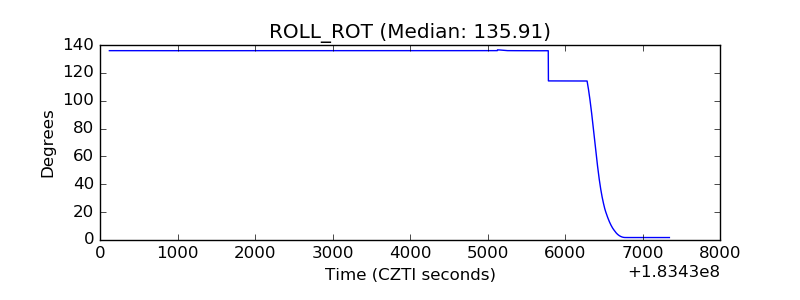 |
| _Roll_DEC | 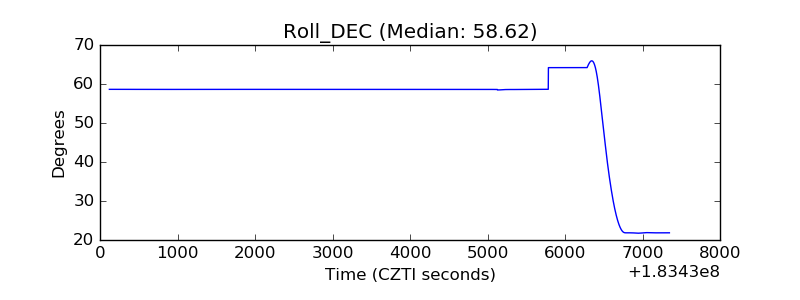 |
| _Roll_RA | 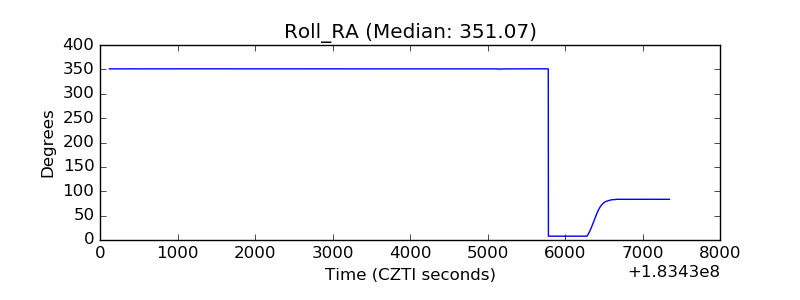 |
| Veto Counter | 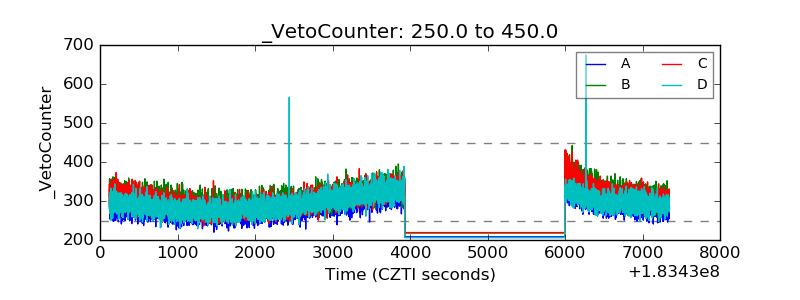 |