| Param | Original file | Final file |
|---|---|---|
| Filename | modeM0/AS1P01_161T04_9000000060_00386cztM0_level2.evt | modeM0/AS1P01_161T04_9000000060_00386cztM0_level2_quad_clean.evt |
| Size (bytes) | 234,138,240 | 20,537,280 |
| Size | 223.3 MB | 19.6 MB |
| Events in quadrant A | 1,693,925 | 132,382 |
| Events in quadrant B | 1,645,549 | 126,861 |
| Events in quadrant C | 1,510,272 | 131,085 |
| Events in quadrant D | 2,142,337 | 123,650 |
| Mode SS | |||
|---|---|---|---|
| Quadrant | BADHDUFLAG | Total packets | Discarded packets |
| A | 0 | 28 | 0 |
| B | 0 | 28 | 0 |
| C | 0 | 28 | 0 |
| D | 0 | 28 | 0 |
| Mode M0 | |||
|---|---|---|---|
| Quadrant | BADHDUFLAG | Total packets | Discarded packets |
| A | 0 | 6059 | 0 |
| B | 0 | 5914 | 0 |
| C | 0 | 5536 | 0 |
| D | 0 | 7406 | 0 |
| Quadrant | Total seconds | Saturated seconds | Saturation percentage |
|---|---|---|---|
| A | 1448 | 2 | 0.138122% |
| B | 1448 | 2 | 0.138122% |
| C | 1448 | 2 | 0.138122% |
| D | 1448 | 59 | 4.074586% |
Noise dominated data is calculated using 1-second bins in cleaned event files. If a bin has >2000 counts, and if more than 50% of those come from <1% of pixels, then it is considered to be noise-dominated and hence unusable.
| Quadrant | # 1 sec bins | Bins with >0 counts | Bins with >2000 counts | High rate bins dominated by noise | Noise dominated (total time) | Noise dominated (detector-on time) | Marked lightcurve |
|---|---|---|---|---|---|---|---|
| A | 1448 | 1448 | 27 | 27 | 1.86% | 1.86% | 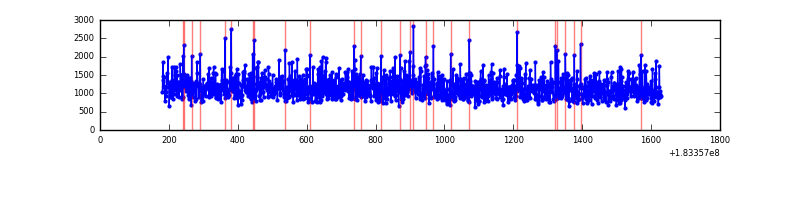 |
| B | 1448 | 1448 | 17 | 17 | 1.17% | 1.17% | 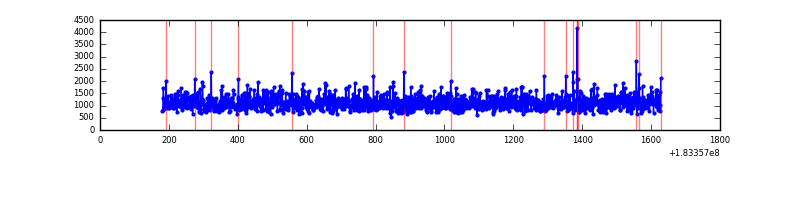 |
| C | 1448 | 1448 | 7 | 7 | 0.48% | 0.48% | 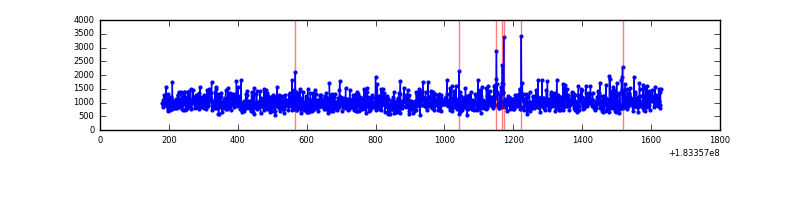 |
| D | 1448 | 1448 | 194 | 194 | 13.40% | 13.40% | 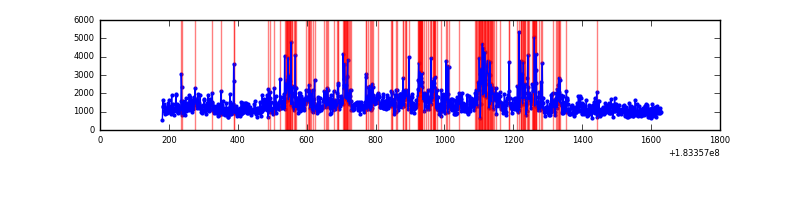 |
Top three noisy pixels from each quadrant. If the there are fewer than three noisy pixels in the level2.evt file, extra rows are filled as -1
| Pixel properties | Quadrant properties | ||||||
|---|---|---|---|---|---|---|---|
| Quadrant | DetID | PixID | Counts | Sigma | Mean | Median | Sigma |
| A | 0 | 238 | 28811 | 305.01 | 421 | 419 | 93.1 |
| A | 15 | 200 | 11404 | 118.01 | 421 | 419 | 93.1 |
| A | 12 | 243 | 6778 | 68.31 | 421 | 419 | 93.1 |
| B | 4 | 82 | 26135 | 257.47 | 417 | 419 | 99.9 |
| B | 15 | 82 | 5369 | 49.56 | 417 | 419 | 99.9 |
| B | 0 | 23 | 4349 | 39.35 | 417 | 419 | 99.9 |
| C | 3 | 159 | 32732 | 304.26 | 373 | 386 | 106.3 |
| C | 3 | 9 | 6267 | 55.32 | 373 | 386 | 106.3 |
| C | 5 | 234 | 3999 | 33.99 | 373 | 386 | 106.3 |
| D | 13 | 7 | 450902 | 3944.86 | 367 | 380 | 114.2 |
| D | 1 | 4 | 87439 | 762.31 | 367 | 380 | 114.2 |
| D | 1 | 5 | 63384 | 551.68 | 367 | 380 | 114.2 |
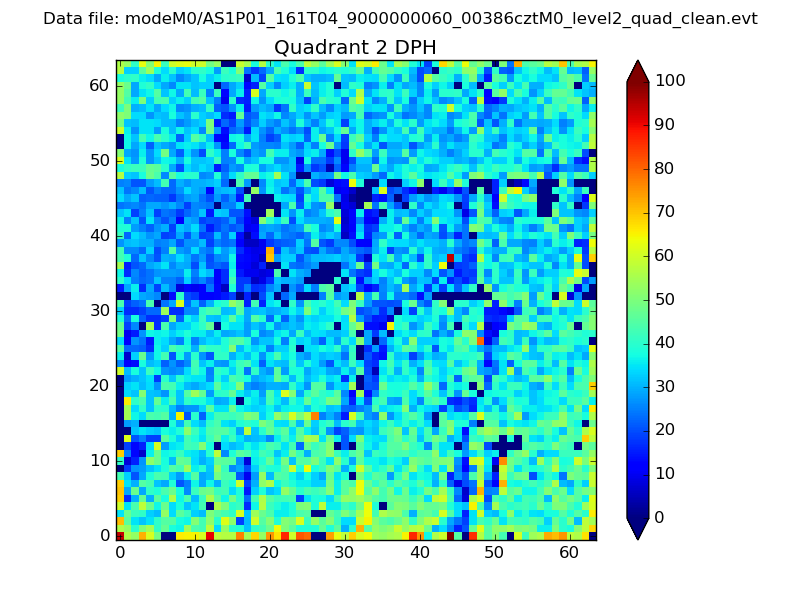
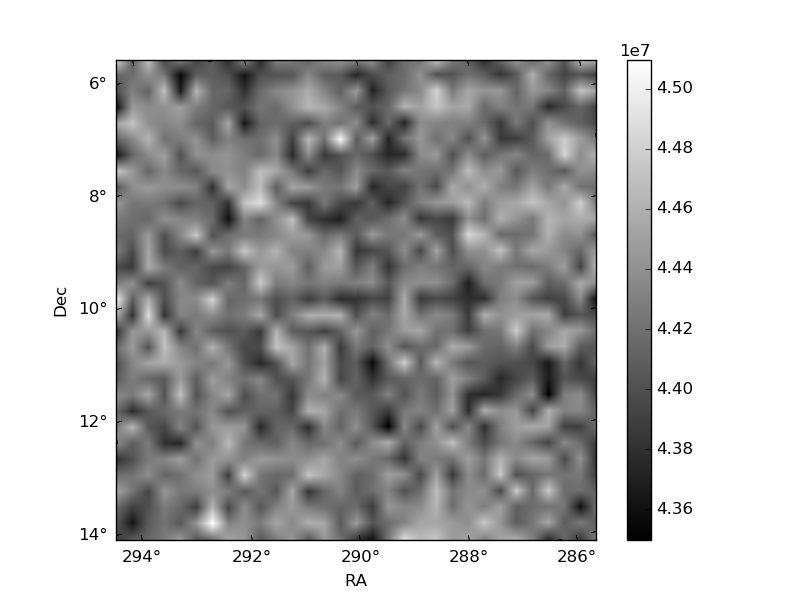
Histogram calculated using DETX and DETY for each event in the final _common_clean file
| Quadrant A | 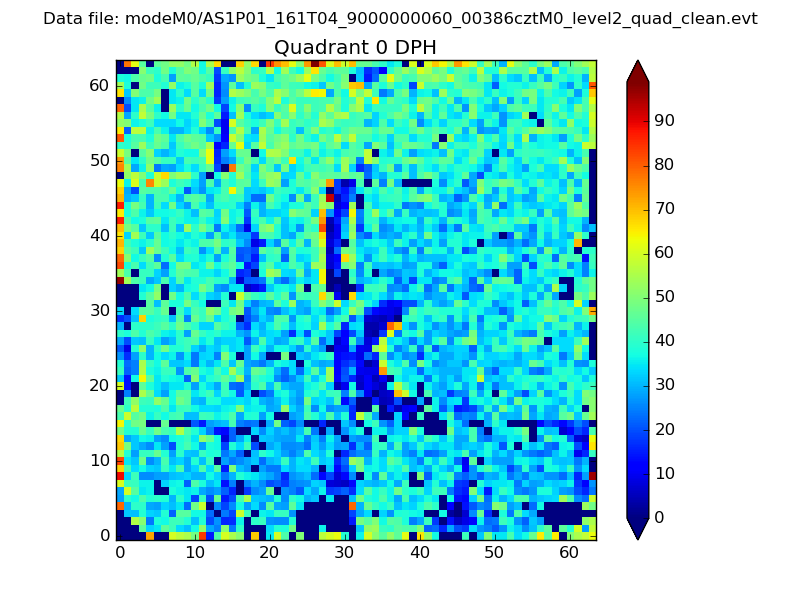 |
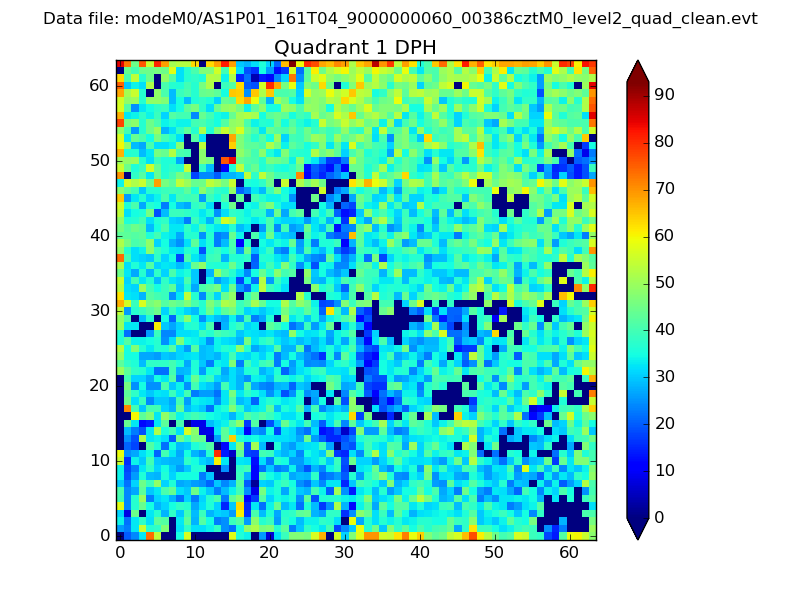 |
Quadrant B |
|---|---|---|---|
| Quadrant D | 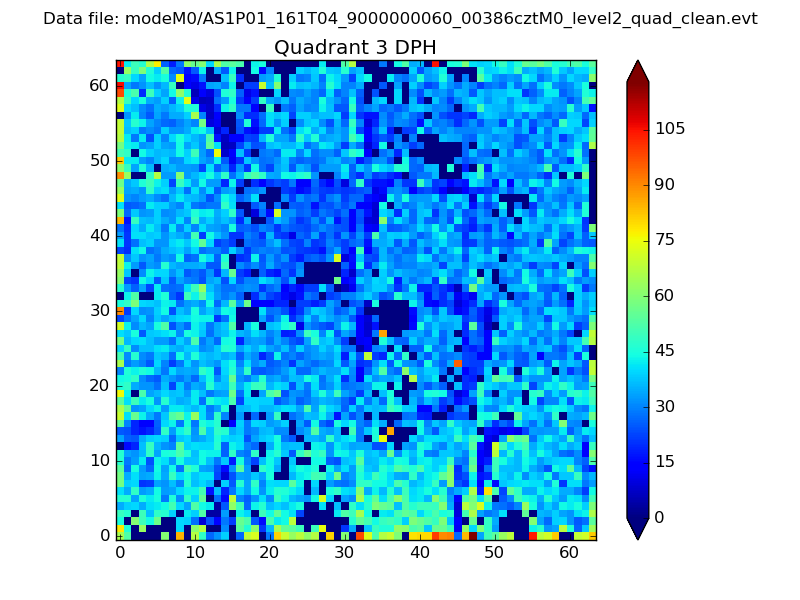 |
 |
Quadrant C |
| Plot type | Count rate plots | Images |
|---|---|---|
| Comparison with Poisson distribution Blue bars denote a histogram of data divided into 1 sec bins. Red curve is a Poisson curve with rate = median count rate of data. |
 |
 |
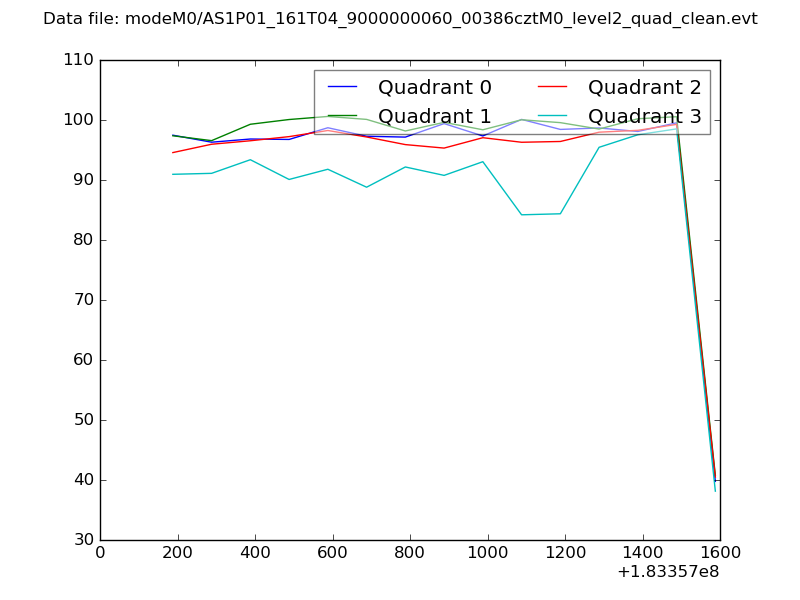
| Quadrant-wise count rates Data is divided into 100 sec bins |
 |
|
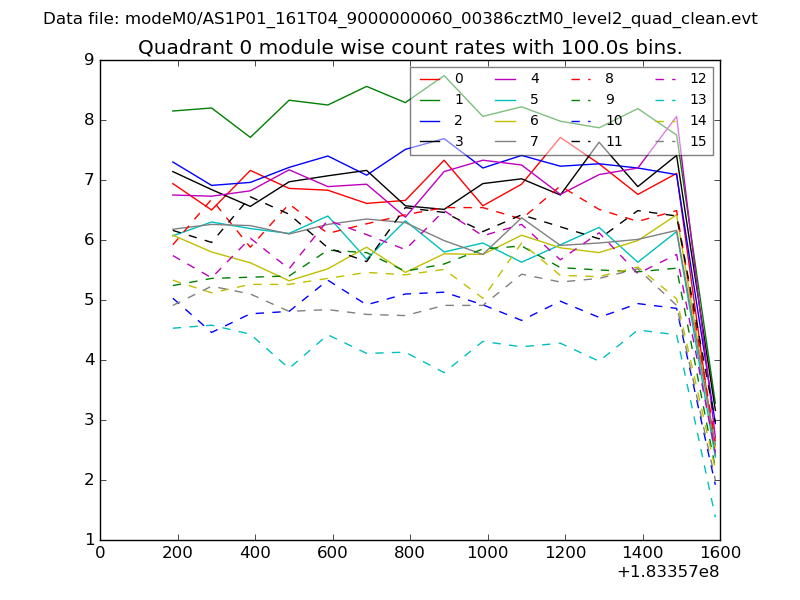
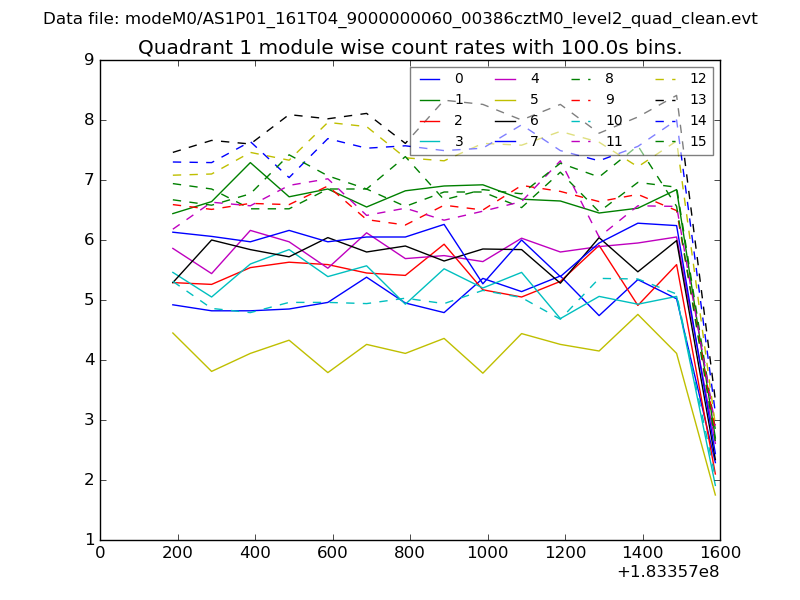
| Module-wise count rates for Quadrant A Data is divided into 100 sec bins |
 |
 |
| Module-wise count rates for Quadrant B Data is divided into 100 sec bins |
 |
 |
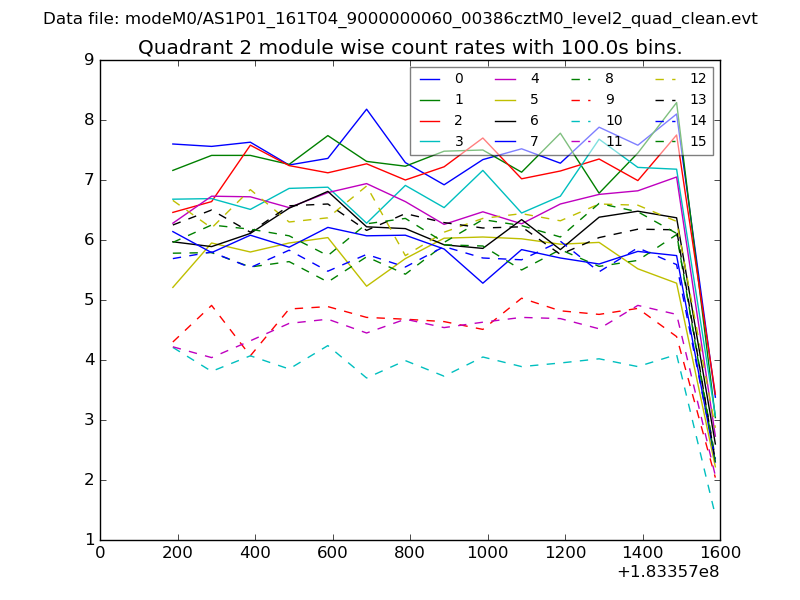
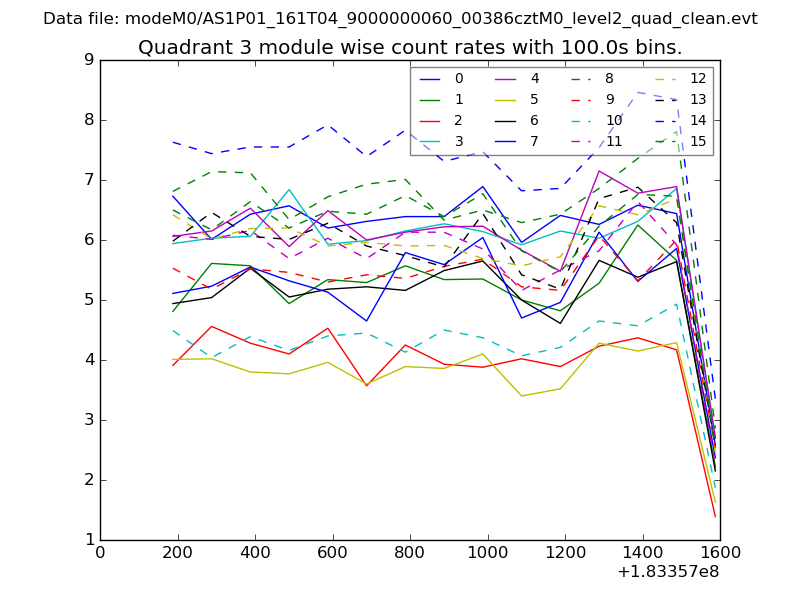
| Module-wise count rates for Quadrant C Data is divided into 100 sec bins |
 |
 |
| Module-wise count rates for Quadrant D Data is divided into 100 sec bins |
 |
 |
| Parameter | Plot |
|---|---|
| CZT HV Monitor | 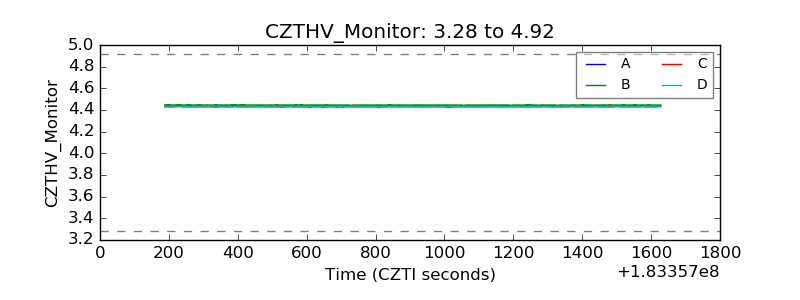 |
| D_VDD | 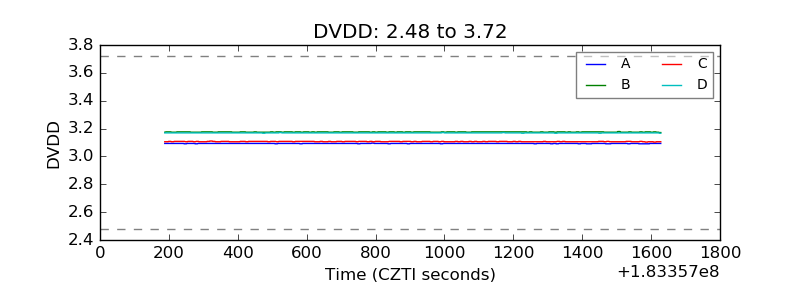 |
| Temperature 1 | 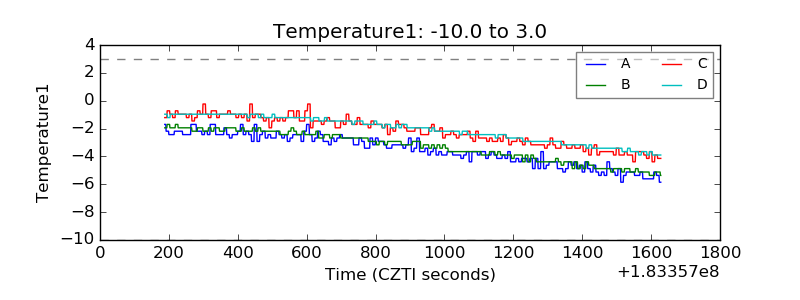 |
| Veto HV Monitor | 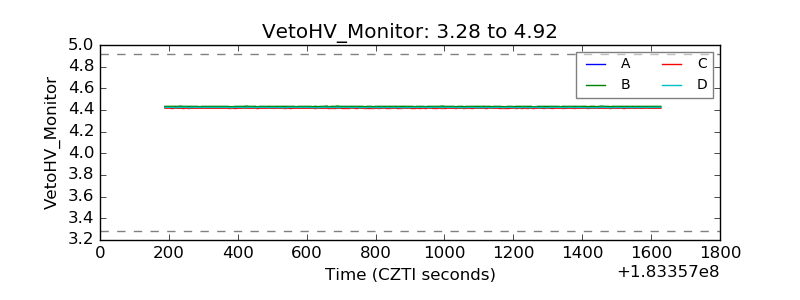 |
| Veto LLD | 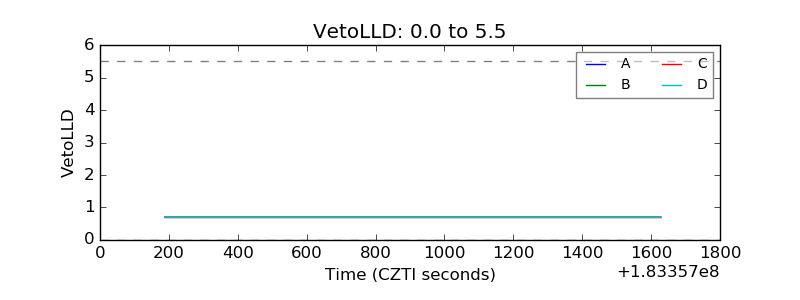 |
| Alpha Counter | 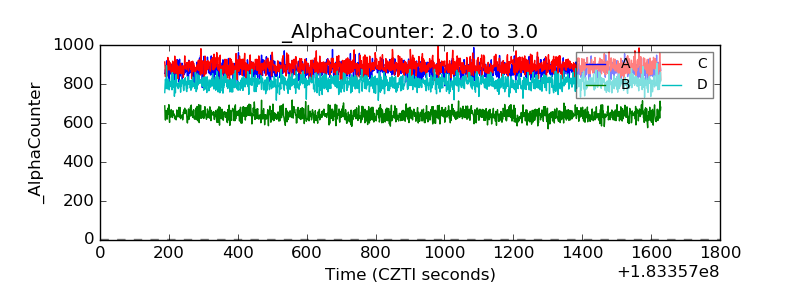 |
| _CPM_Rate | 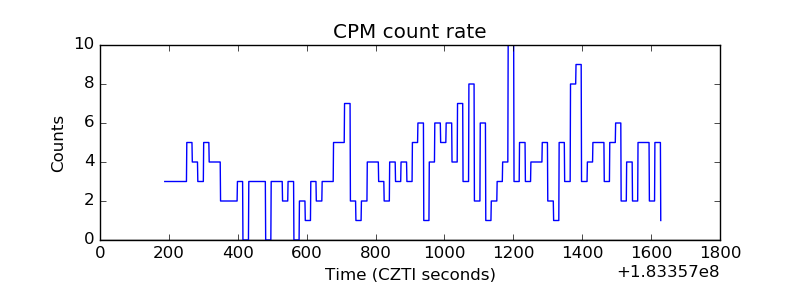 |
| CZT Counter | 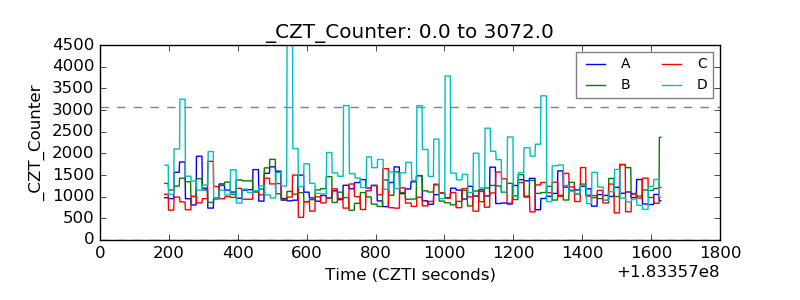 |
| +2.5 Volts monitor |  |
| +5 Volts monitor | 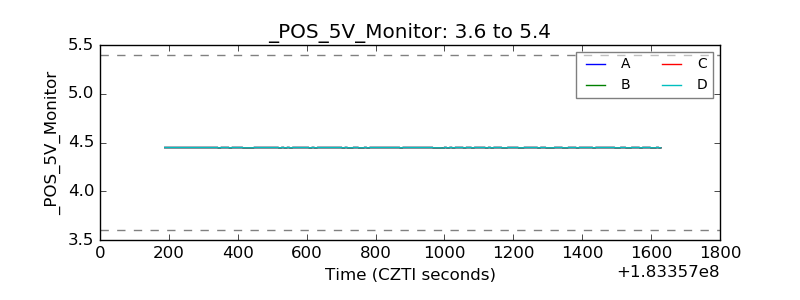 |
| _ROLL_ROT | 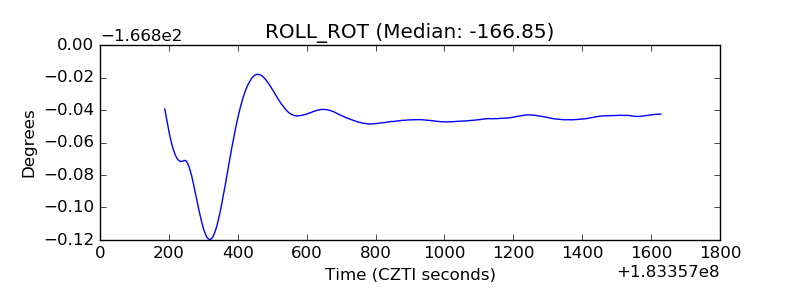 |
| _Roll_DEC | 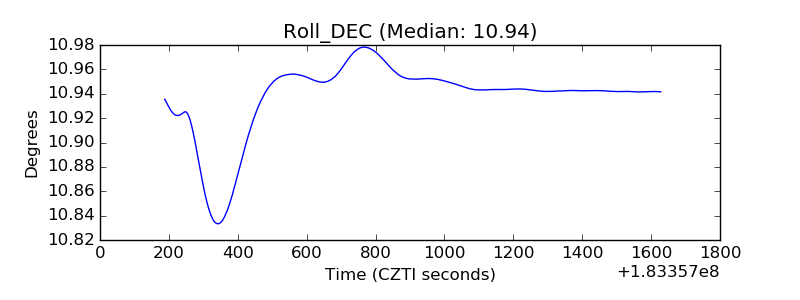 |
| _Roll_RA | 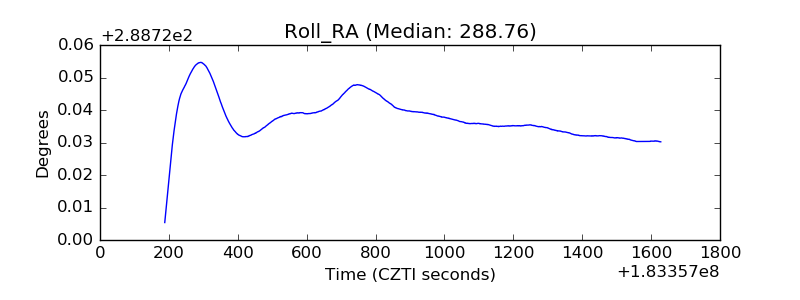 |
| Veto Counter | 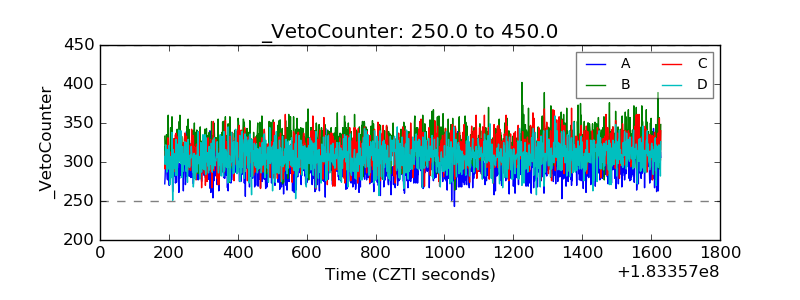 |