| Param | Original file | Final file |
|---|---|---|
| Filename | modeM0/AS1P01_888T88_9000000064cztM0_level2.fits | modeM0/AS1P01_888T88_9000000064cztM0_level2_quad_clean.evt |
| Size (bytes) | 136,071,360 | 38,600,640 |
| Size | 129.8 MB | 36.8 MB |
| Events in quadrant A | 787,120 | 8,644 |
| Events in quadrant B | 780,454 | 8,825 |
| Events in quadrant C | 784,604 | 7,972 |
| Events in quadrant D | 634,338 | 7,137 |
| Mode M9 | |||
|---|---|---|---|
| Quadrant | BADHDUFLAG | Total packets | Discarded packets |
| A | 0 | 83 | 0 |
| B | 0 | 83 | 0 |
| C | 0 | 83 | 0 |
| D | 0 | 83 | 0 |
| Mode SS | |||
|---|---|---|---|
| Quadrant | BADHDUFLAG | Total packets | Discarded packets |
| A | 0 | 336 | 0 |
| B | 0 | 336 | 0 |
| C | 0 | 336 | 0 |
| D | 0 | 336 | 0 |
| Mode M0 | |||
|---|---|---|---|
| Quadrant | BADHDUFLAG | Total packets | Discarded packets |
| A | 0 | 71387 | 0 |
| B | 0 | 70192 | 0 |
| C | 0 | 66255 | 0 |
| D | 0 | 84320 | 0 |
| Quadrant | Total seconds | Saturated seconds | Saturation percentage |
|---|---|---|---|
| A | 16443 | 36 | 0.218938% |
| B | 16443 | 34 | 0.206775% |
| C | 16443 | 38 | 0.231101% |
| D | 16443 | 1280 | 7.784468% |
Noise dominated data is calculated using 1-second bins in cleaned event files. If a bin has >2000 counts, and if more than 50% of those come from <1% of pixels, then it is considered to be noise-dominated and hence unusable.
| Quadrant | # 1 sec bins | Bins with >0 counts | Bins with >2000 counts | High rate bins dominated by noise | Noise dominated (total time) | Noise dominated (detector-on time) | Marked lightcurve |
|---|---|---|---|---|---|---|---|
| A | 24704 | 16443 | 0 | 0 | 0.00% | 0.00% |  |
| B | 24704 | 16443 | 0 | 0 | 0.00% | 0.00% |  |
| C | 24704 | 16444 | 0 | 0 | 0.00% | 0.00% |  |
| D | 24704 | 16422 | 0 | 0 | 0.00% | 0.00% | 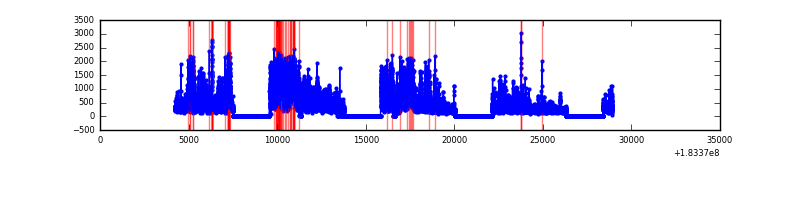 |
Top three noisy pixels from each quadrant. If the there are fewer than three noisy pixels in the level2.evt file, extra rows are filled as -1
| Pixel properties | Quadrant properties | ||||||
|---|---|---|---|---|---|---|---|
| Quadrant | DetID | PixID | Counts | Sigma | Mean | Median | Sigma |
| A | 7 | 110 | 744 | 11.2 | 204 | 193 | 49.2 |
| A | 0 | 29 | 708 | 10.47 | 204 | 193 | 49.2 |
| A | 12 | 45 | 557 | 7.4 | 204 | 193 | 49.2 |
| B | 2 | 9 | 645 | 11.86 | 206 | 198 | 37.7 |
| B | 14 | 254 | 527 | 8.73 | 206 | 198 | 37.7 |
| B | 2 | 18 | 510 | 8.28 | 206 | 198 | 37.7 |
| C | 2 | 127 | 555 | 6.92 | 207 | 192 | 52.5 |
| C | 12 | 241 | 545 | 6.73 | 207 | 192 | 52.5 |
| C | 2 | 191 | 540 | 6.63 | 207 | 192 | 52.5 |
| D | 11 | 82 | 498 | 7.32 | 181 | 167 | 45.2 |
| D | 6 | 231 | 474 | 6.79 | 181 | 167 | 45.2 |
| D | 6 | 44 | 462 | 6.53 | 181 | 167 | 45.2 |
Histogram calculated using DETX and DETY for each event in the final _common_clean file
| Quadrant A | 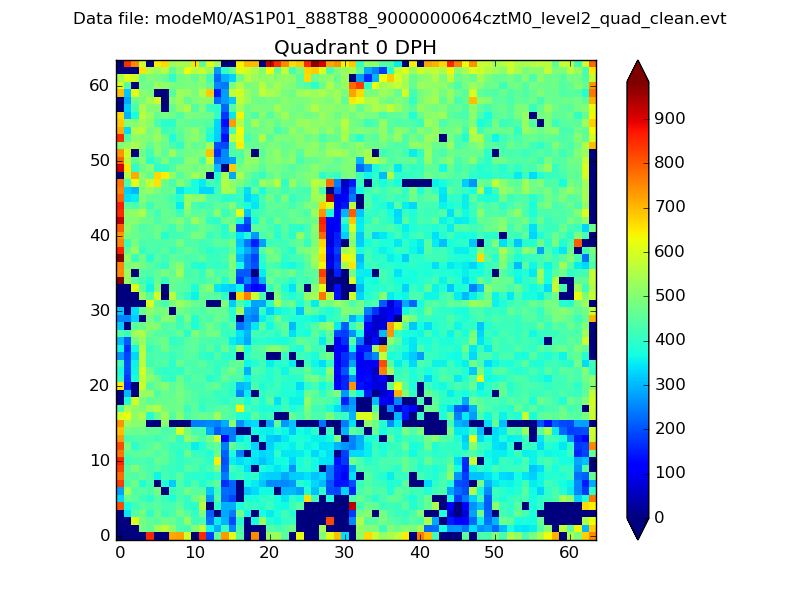 |
 |
Quadrant B |
|---|---|---|---|
| Quadrant D |  |
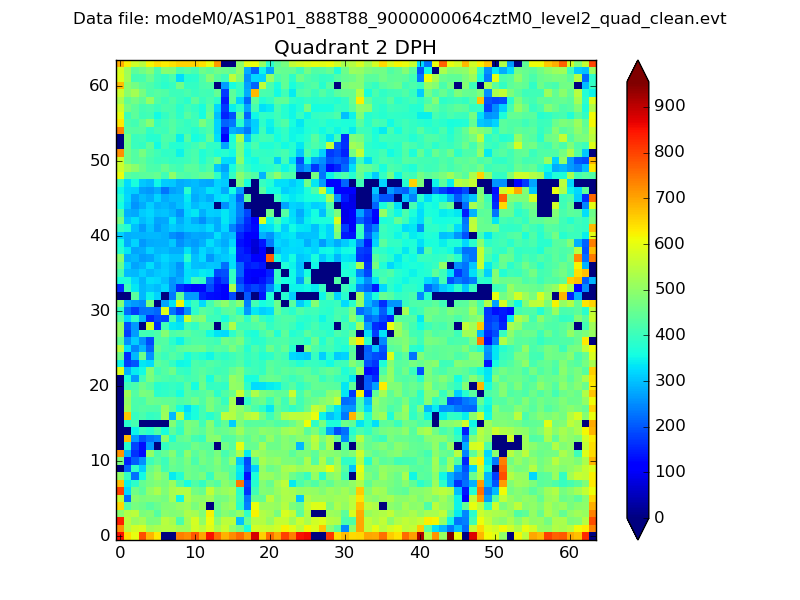 |
Quadrant C |
| Plot type | Count rate plots | Images |
|---|---|---|
| Comparison with Poisson distribution Blue bars denote a histogram of data divided into 1 sec bins. Red curve is a Poisson curve with rate = median count rate of data. |
 |
 |
| Quadrant-wise count rates Data is divided into 100 sec bins |
 |
|
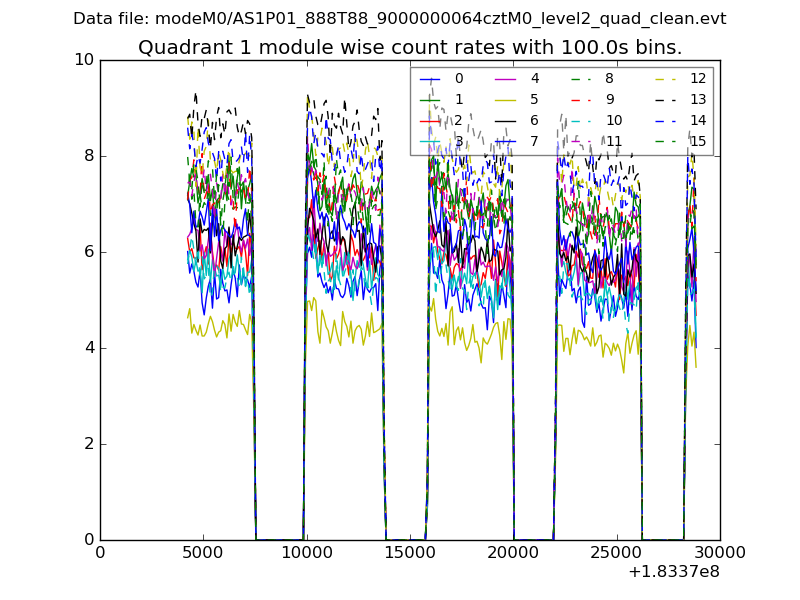
| Module-wise count rates for Quadrant A Data is divided into 100 sec bins |
 |
 |
| Module-wise count rates for Quadrant B Data is divided into 100 sec bins |
 |
 |
| Module-wise count rates for Quadrant C Data is divided into 100 sec bins |
 |
 |
| Module-wise count rates for Quadrant D Data is divided into 100 sec bins |
 |
 |
| Parameter | Plot |
|---|---|
| CZT HV Monitor |  |
| D_VDD |  |
| Temperature 1 |  |
| Veto HV Monitor |  |
| Veto LLD |  |
| Alpha Counter |  |
| _CPM_Rate |  |
| CZT Counter |  |
| +2.5 Volts monitor |  |
| +5 Volts monitor |  |
| _ROLL_ROT |  |
| _Roll_DEC |  |
| _Roll_RA |  |
| Veto Counter |  |