| Param | Original file | Final file |
|---|---|---|
| Filename | modeM0/AS1P01_161T03_9000000070_00407cztM0_level2.evt | modeM0/AS1P01_161T03_9000000070_00407cztM0_level2_quad_clean.evt |
| Size (bytes) | 141,168,960 | 12,582,720 |
| Size | 134.6 MB | 12.0 MB |
| Events in quadrant A | 1,055,014 | 80,796 |
| Events in quadrant B | 1,015,647 | 76,452 |
| Events in quadrant C | 970,005 | 79,383 |
| Events in quadrant D | 1,175,131 | 77,209 |
| Mode SS | |||
|---|---|---|---|
| Quadrant | BADHDUFLAG | Total packets | Discarded packets |
| A | 0 | 16 | 0 |
| B | 0 | 16 | 0 |
| C | 0 | 16 | 0 |
| D | 0 | 16 | 0 |
| Mode M0 | |||
|---|---|---|---|
| Quadrant | BADHDUFLAG | Total packets | Discarded packets |
| A | 0 | 3737 | 1 |
| B | 0 | 3617 | 0 |
| C | 0 | 3487 | 0 |
| D | 0 | 4081 | 0 |
| Quadrant | Total seconds | Saturated seconds | Saturation percentage |
|---|---|---|---|
| A | 851 | 3 | 0.352526% |
| B | 851 | 2 | 0.235018% |
| C | 851 | 0 | 0.000000% |
| D | 851 | 3 | 0.352526% |
Noise dominated data is calculated using 1-second bins in cleaned event files. If a bin has >2000 counts, and if more than 50% of those come from <1% of pixels, then it is considered to be noise-dominated and hence unusable.
| Quadrant | # 1 sec bins | Bins with >0 counts | Bins with >2000 counts | High rate bins dominated by noise | Noise dominated (total time) | Noise dominated (detector-on time) | Marked lightcurve |
|---|---|---|---|---|---|---|---|
| A | 851 | 851 | 27 | 27 | 3.17% | 3.17% | 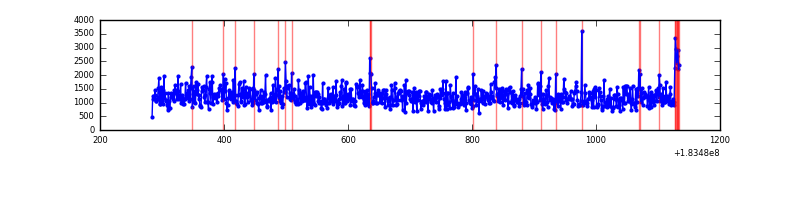 |
| B | 851 | 851 | 14 | 14 | 1.65% | 1.65% | 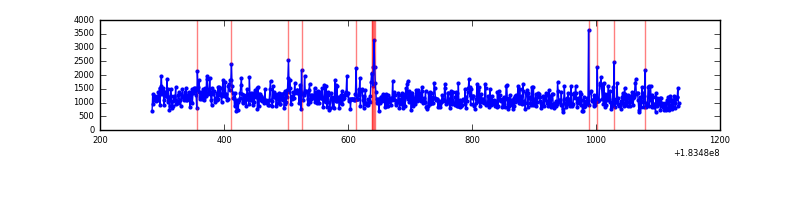 |
| C | 851 | 851 | 5 | 5 | 0.59% | 0.59% | 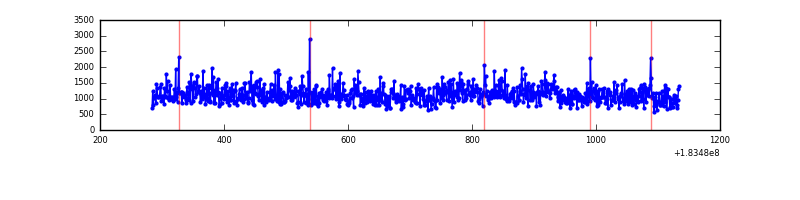 |
| D | 851 | 851 | 47 | 47 | 5.52% | 5.52% | 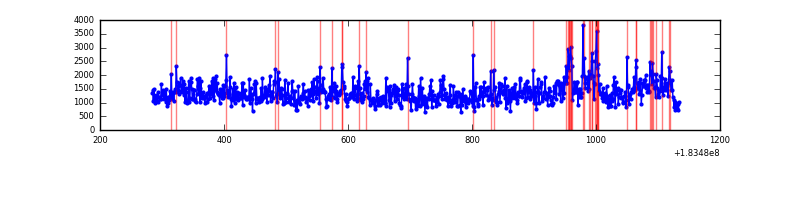 |
Top three noisy pixels from each quadrant. If the there are fewer than three noisy pixels in the level2.evt file, extra rows are filled as -1
| Pixel properties | Quadrant properties | ||||||
|---|---|---|---|---|---|---|---|
| Quadrant | DetID | PixID | Counts | Sigma | Mean | Median | Sigma |
| A | 15 | 200 | 17048 | 293.91 | 257 | 256 | 57.1 |
| A | 0 | 238 | 16828 | 290.06 | 257 | 256 | 57.1 |
| A | 12 | 243 | 13081 | 224.47 | 257 | 256 | 57.1 |
| B | 4 | 82 | 22452 | 368.5 | 246 | 247 | 60.3 |
| B | 0 | 182 | 15851 | 258.95 | 246 | 247 | 60.3 |
| B | 2 | 253 | 4357 | 68.21 | 246 | 247 | 60.3 |
| C | 1 | 1 | 70139 | 1085.37 | 227 | 236 | 64.4 |
| C | 9 | 206 | 2255 | 31.35 | 227 | 236 | 64.4 |
| C | 10 | 38 | 2167 | 29.98 | 227 | 236 | 64.4 |
| D | 12 | 237 | 99152 | 1339.05 | 231 | 238 | 73.9 |
| D | 1 | 4 | 51886 | 699.18 | 231 | 238 | 73.9 |
| D | 1 | 5 | 41220 | 554.79 | 231 | 238 | 73.9 |
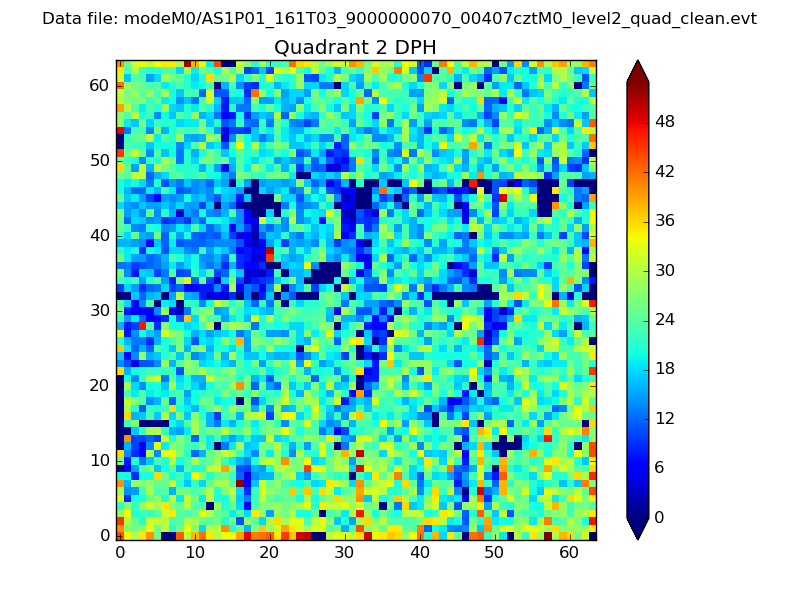
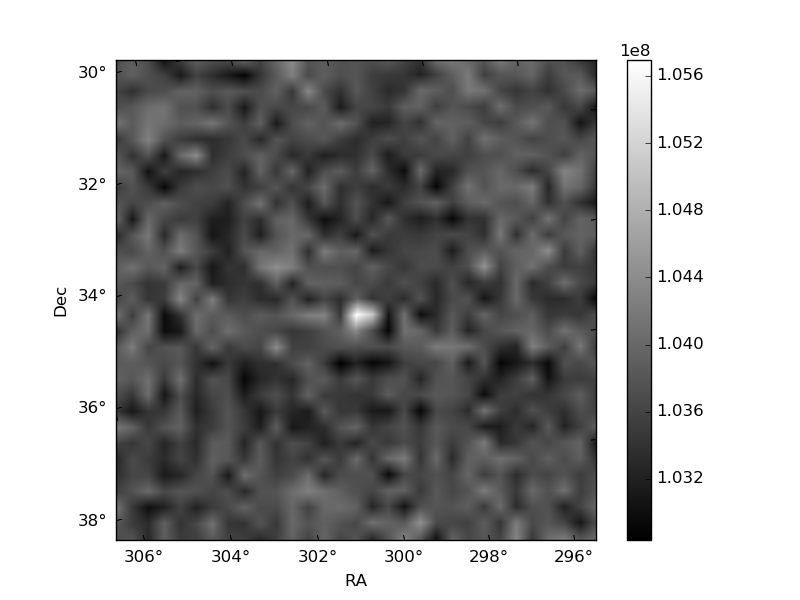
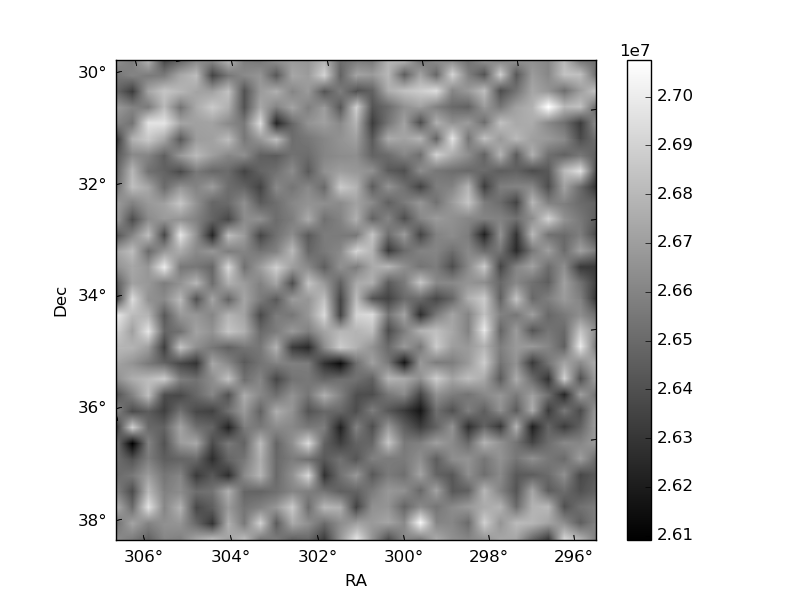
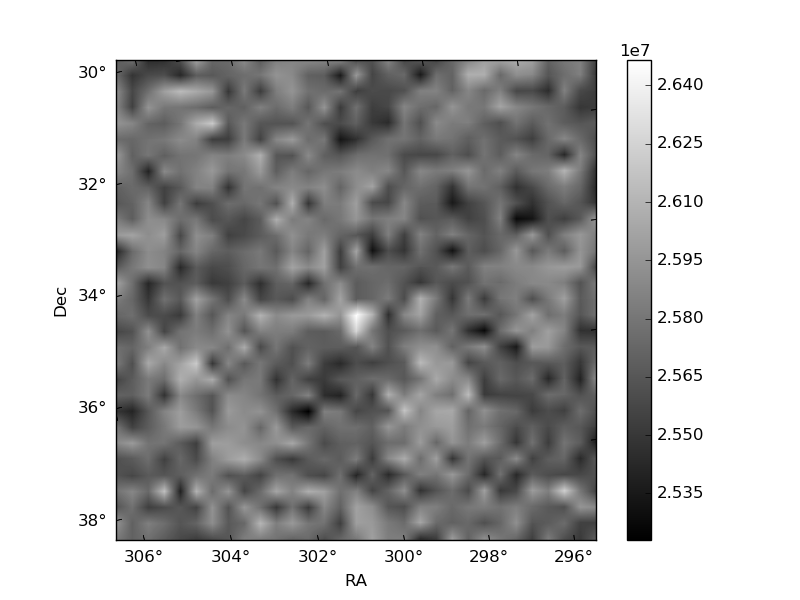
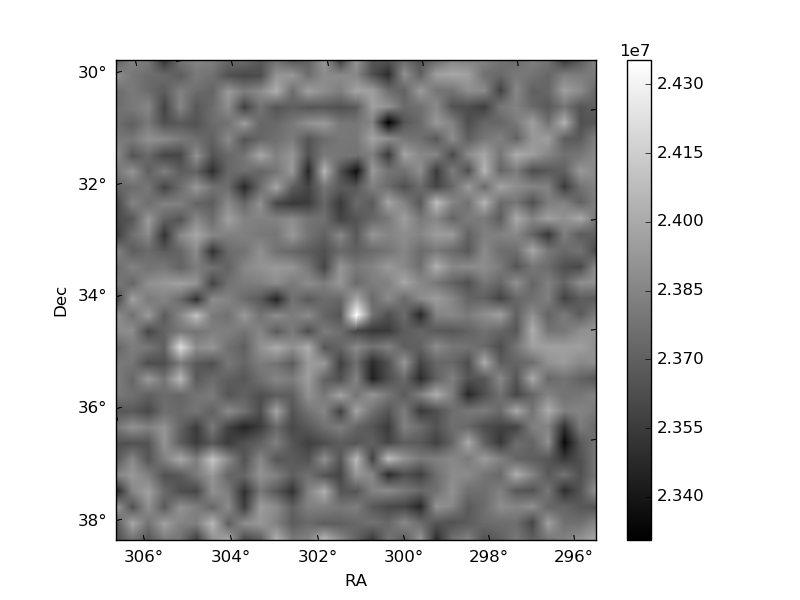
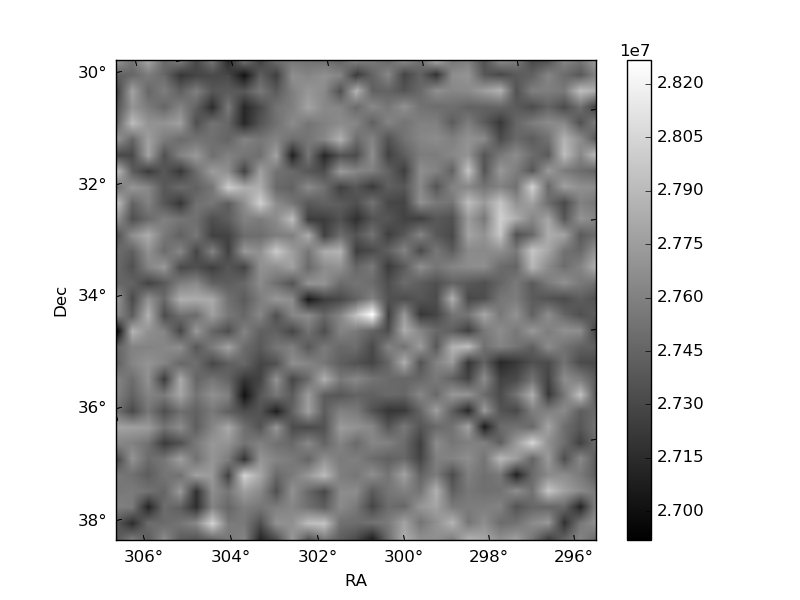
Histogram calculated using DETX and DETY for each event in the final _common_clean file
| Quadrant A | 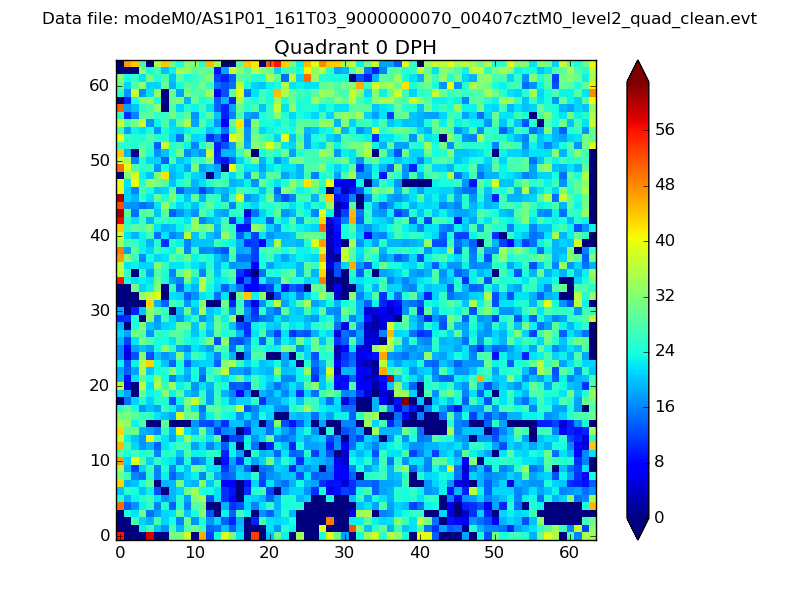 |
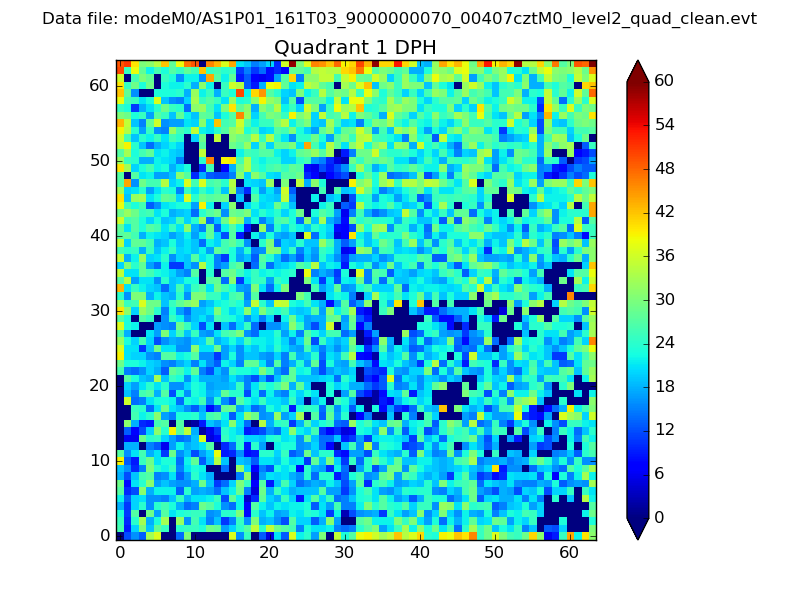 |
Quadrant B |
|---|---|---|---|
| Quadrant D | 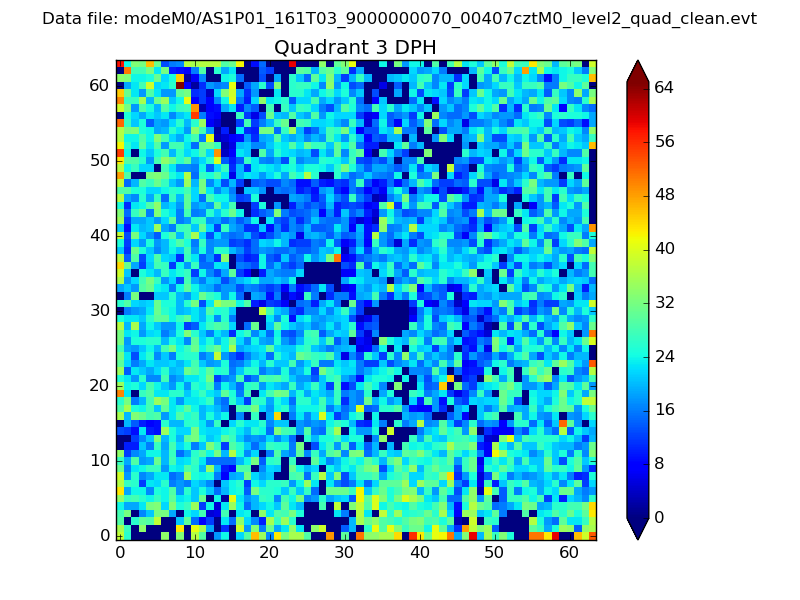 |
 |
Quadrant C |
| Plot type | Count rate plots | Images |
|---|---|---|
| Comparison with Poisson distribution Blue bars denote a histogram of data divided into 1 sec bins. Red curve is a Poisson curve with rate = median count rate of data. |
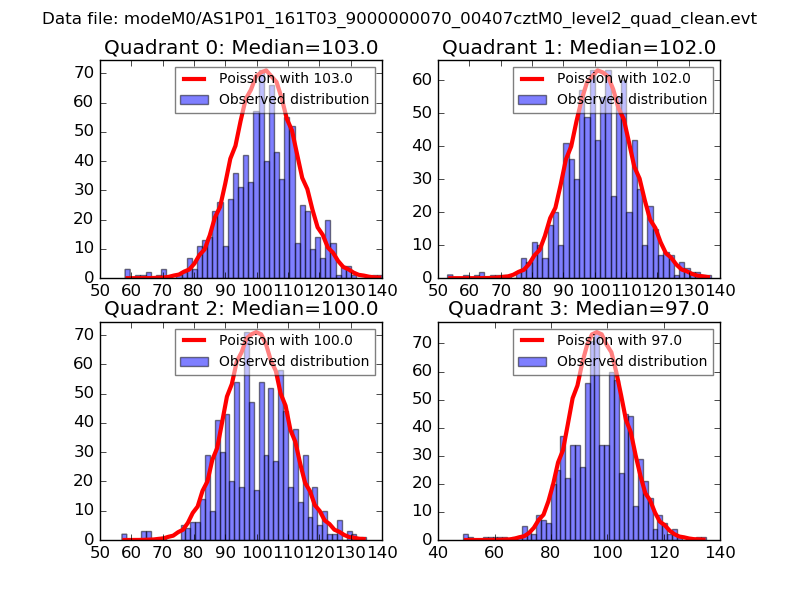 |
 |
| Quadrant-wise count rates Data is divided into 100 sec bins |
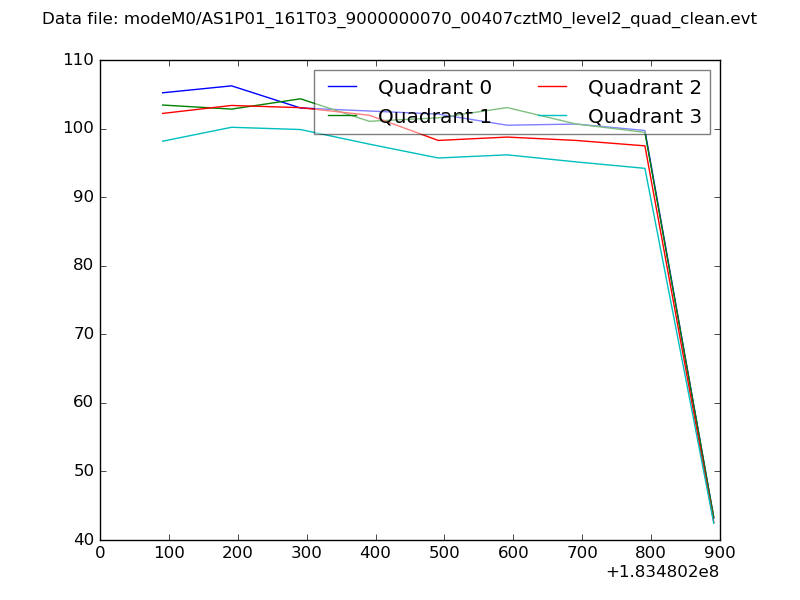 |
|
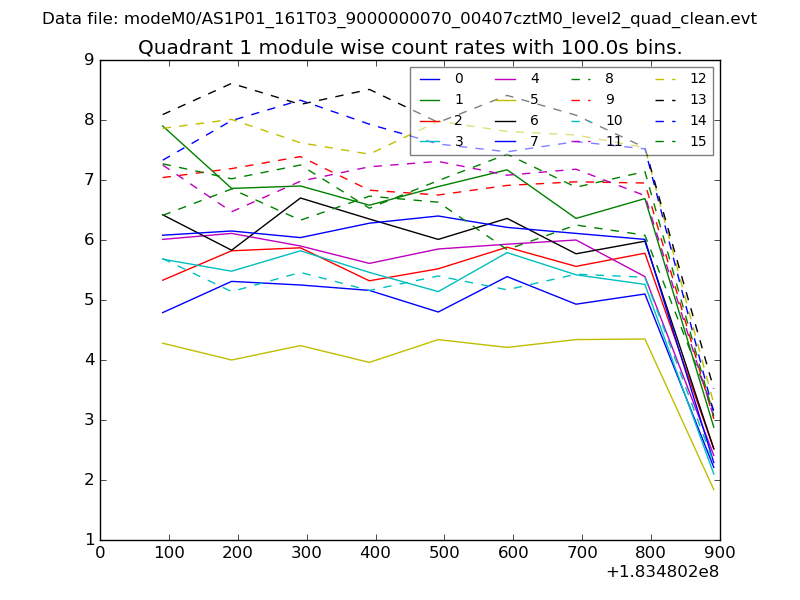
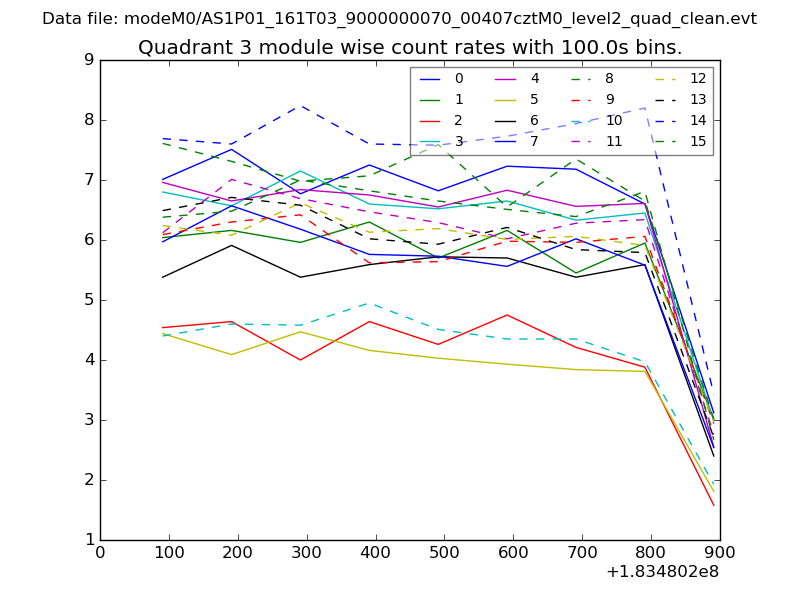
| Module-wise count rates for Quadrant A Data is divided into 100 sec bins |
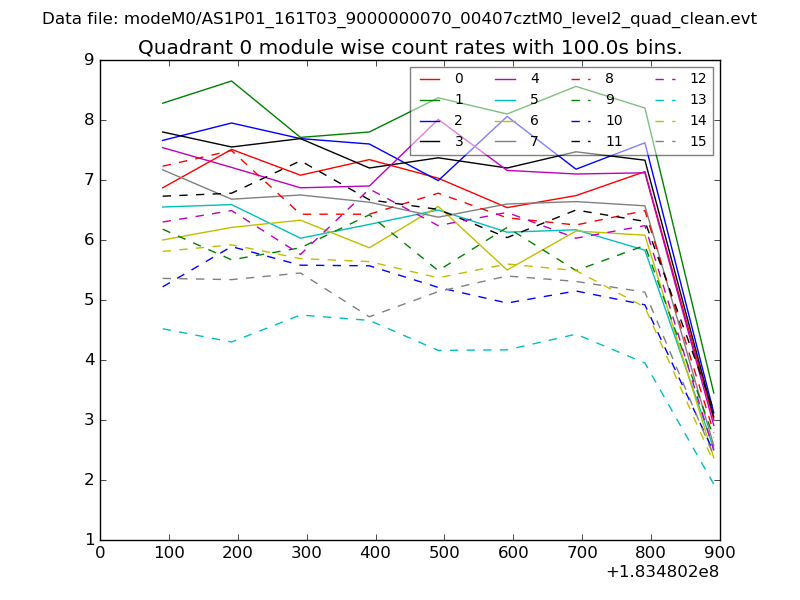 |
 |
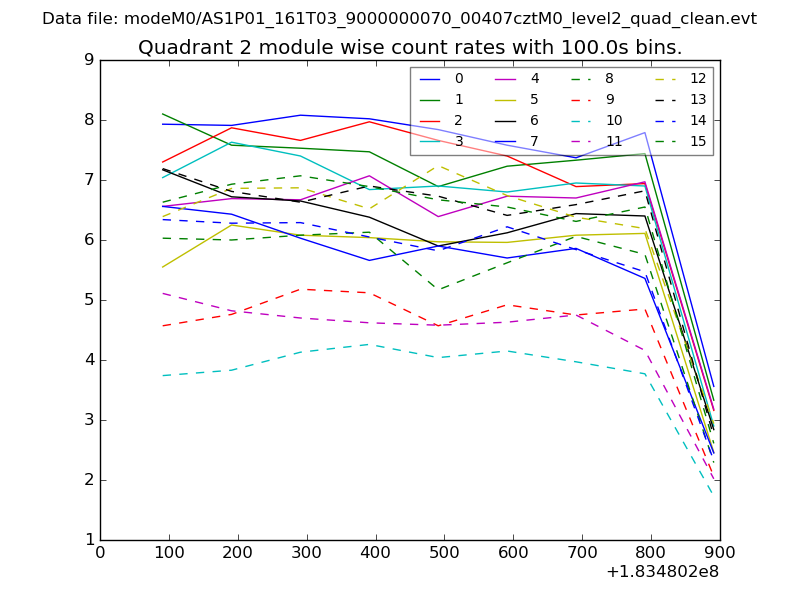
| Module-wise count rates for Quadrant B Data is divided into 100 sec bins |
 |
 |
| Module-wise count rates for Quadrant C Data is divided into 100 sec bins |
 |
 |
| Module-wise count rates for Quadrant D Data is divided into 100 sec bins |
 |
 |
| Parameter | Plot |
|---|---|
| CZT HV Monitor | 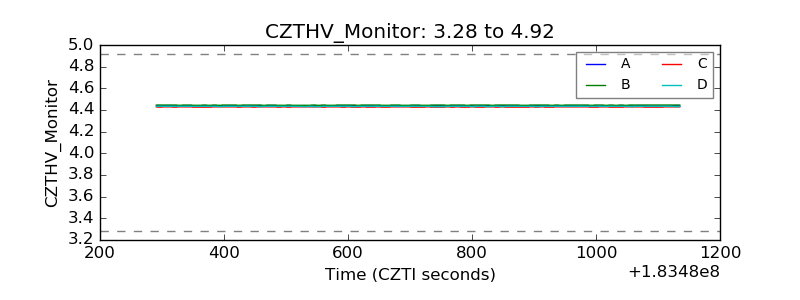 |
| D_VDD | 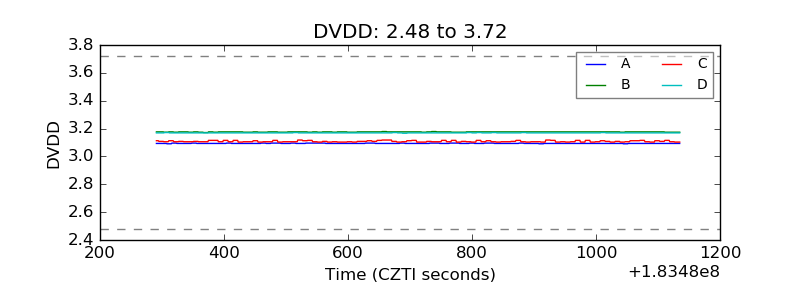 |
| Temperature 1 | 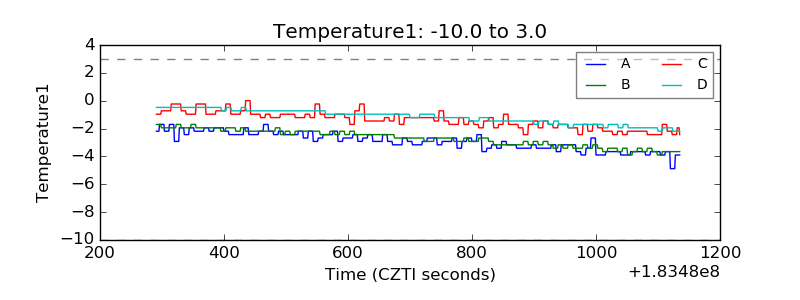 |
| Veto HV Monitor | 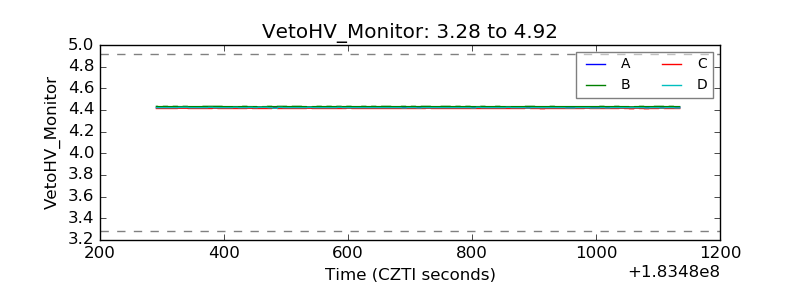 |
| Veto LLD | 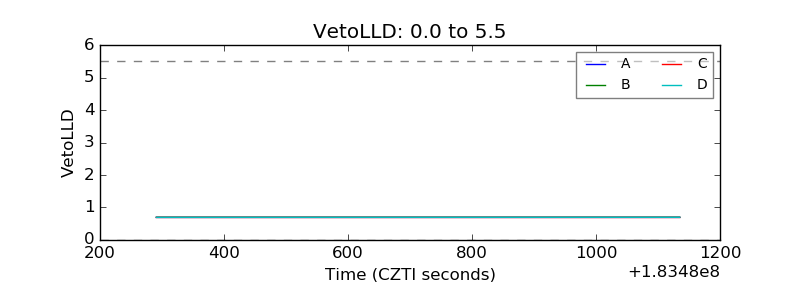 |
| Alpha Counter | 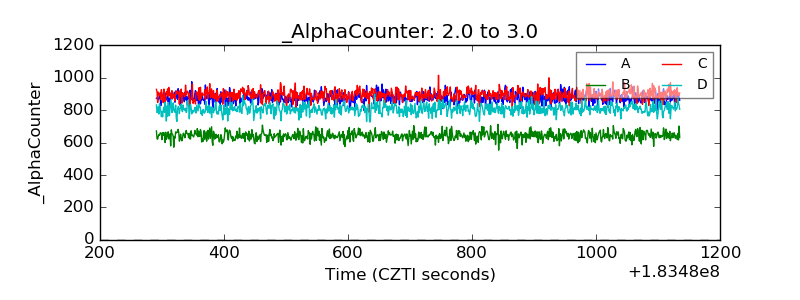 |
| _CPM_Rate | 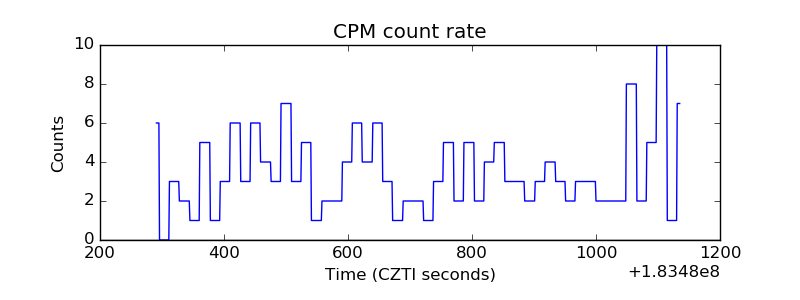 |
| CZT Counter | 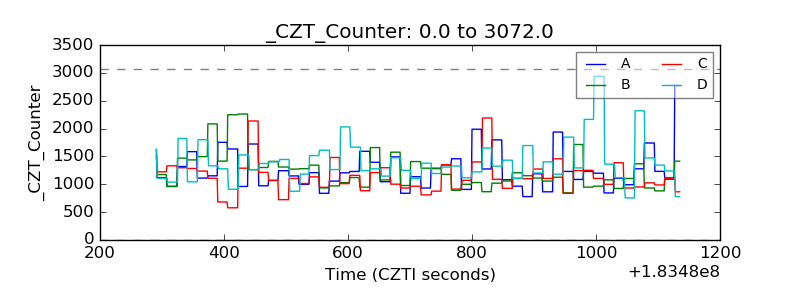 |
| +2.5 Volts monitor | 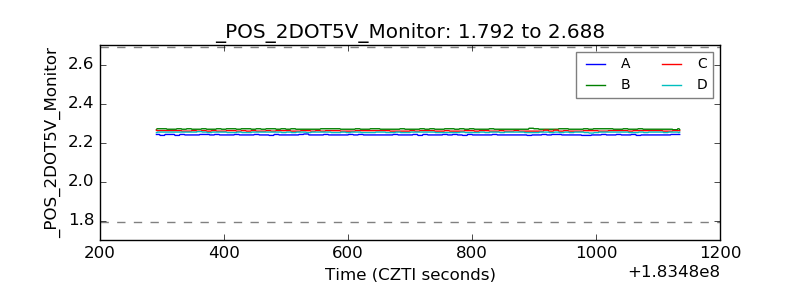 |
| +5 Volts monitor |  |
| _ROLL_ROT | 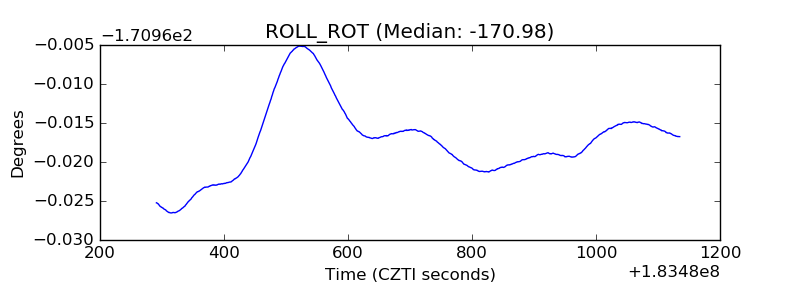 |
| _Roll_DEC | 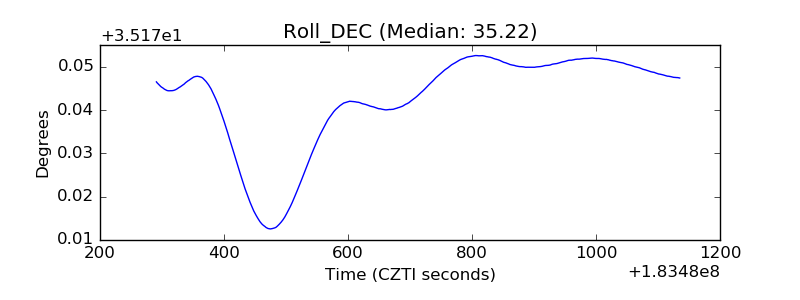 |
| _Roll_RA | 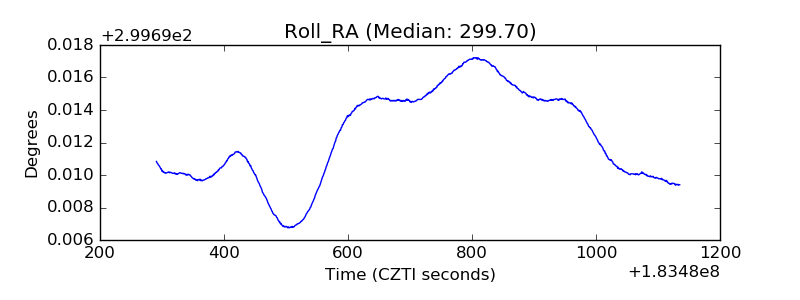 |
| Veto Counter | 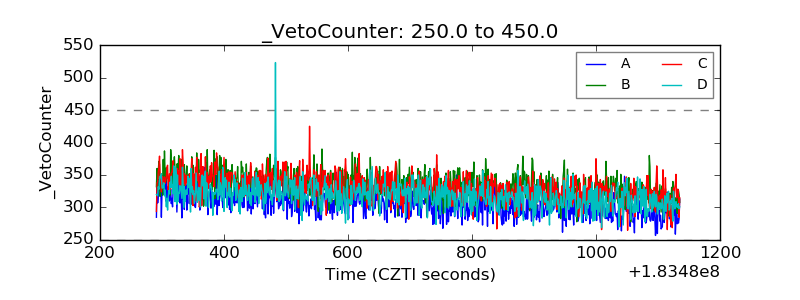 |