| Param | Original file | Final file |
|---|---|---|
| Filename | modeM0/AS1P01_161T03_9000000070_00409cztM0_level2.evt | modeM0/AS1P01_161T03_9000000070_00409cztM0_level2_quad_clean.evt |
| Size (bytes) | 757,854,720 | 46,209,600 |
| Size | 722.7 MB | 44.1 MB |
| Events in quadrant A | 5,810,795 | 269,054 |
| Events in quadrant B | 5,829,328 | 254,928 |
| Events in quadrant C | 5,394,011 | 266,122 |
| Events in quadrant D | 5,579,157 | 252,765 |
| Mode SS | |||
|---|---|---|---|
| Quadrant | BADHDUFLAG | Total packets | Discarded packets |
| A | 0 | 104 | 0 |
| B | 0 | 104 | 0 |
| C | 0 | 104 | 0 |
| D | 0 | 104 | 0 |
| Mode M0 | |||
|---|---|---|---|
| Quadrant | BADHDUFLAG | Total packets | Discarded packets |
| A | 0 | 20876 | 2 |
| B | 0 | 20927 | 1 |
| C | 0 | 19623 | 1 |
| D | 0 | 20178 | 1 |
| Mode M9 | |||
|---|---|---|---|
| Quadrant | BADHDUFLAG | Total packets | Discarded packets |
| A | 0 | 20 | 0 |
| B | 0 | 20 | 0 |
| C | 0 | 20 | 0 |
| D | 0 | 20 | 0 |
| Quadrant | Total seconds | Saturated seconds | Saturation percentage |
|---|---|---|---|
| A | 5074 | 2 | 0.039417% |
| B | 5074 | 1 | 0.019708% |
| C | 5074 | 2 | 0.039417% |
| D | 5074 | 12 | 0.236500% |
Noise dominated data is calculated using 1-second bins in cleaned event files. If a bin has >2000 counts, and if more than 50% of those come from <1% of pixels, then it is considered to be noise-dominated and hence unusable.
| Quadrant | # 1 sec bins | Bins with >0 counts | Bins with >2000 counts | High rate bins dominated by noise | Noise dominated (total time) | Noise dominated (detector-on time) | Marked lightcurve |
|---|---|---|---|---|---|---|---|
| A | 7139 | 5075 | 109 | 109 | 1.53% | 2.15% | 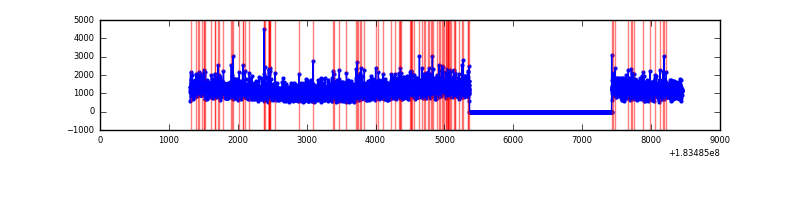 |
| B | 7139 | 5075 | 47 | 47 | 0.66% | 0.93% | 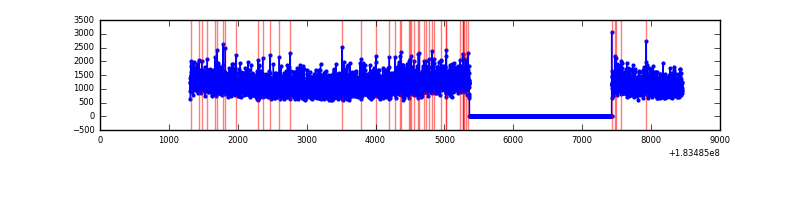 |
| C | 7139 | 5075 | 29 | 29 | 0.41% | 0.57% | 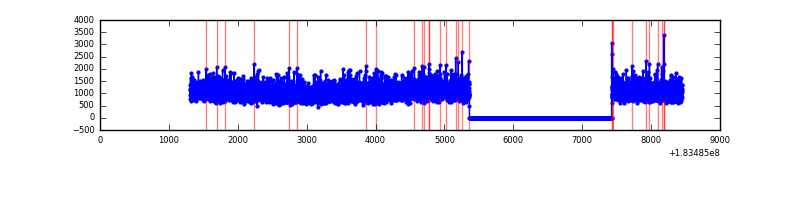 |
| D | 7139 | 5075 | 74 | 74 | 1.04% | 1.46% | 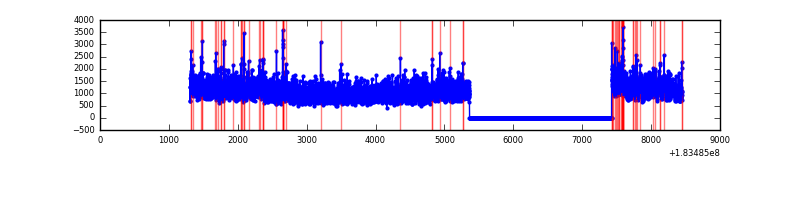 |
Top three noisy pixels from each quadrant. If the there are fewer than three noisy pixels in the level2.evt file, extra rows are filled as -1
| Pixel properties | Quadrant properties | ||||||
|---|---|---|---|---|---|---|---|
| Quadrant | DetID | PixID | Counts | Sigma | Mean | Median | Sigma |
| A | 0 | 238 | 54336 | 162.99 | 1452 | 1433 | 324.6 |
| A | 13 | 17 | 28283 | 82.72 | 1452 | 1433 | 324.6 |
| A | 13 | 160 | 27975 | 81.77 | 1452 | 1433 | 324.6 |
| B | 0 | 23 | 84707 | 243.01 | 1467 | 1472 | 342.5 |
| B | 0 | 220 | 44419 | 125.39 | 1467 | 1472 | 342.5 |
| B | 4 | 82 | 21234 | 57.7 | 1467 | 1472 | 342.5 |
| C | 1 | 1 | 28424 | 71.45 | 1353 | 1402 | 378.2 |
| C | 9 | 206 | 18283 | 44.63 | 1353 | 1402 | 378.2 |
| C | 2 | 53 | 12284 | 28.77 | 1353 | 1402 | 378.2 |
| D | 13 | 221 | 225348 | 557.01 | 1286 | 1335 | 402.2 |
| D | 13 | 7 | 136902 | 337.09 | 1286 | 1335 | 402.2 |
| D | 1 | 5 | 63269 | 154.0 | 1286 | 1335 | 402.2 |
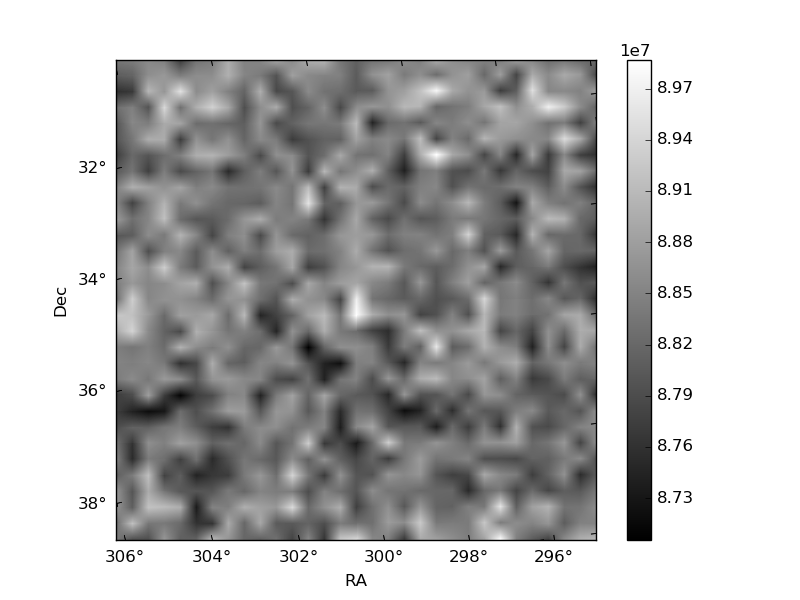
Histogram calculated using DETX and DETY for each event in the final _common_clean file
| Quadrant A | 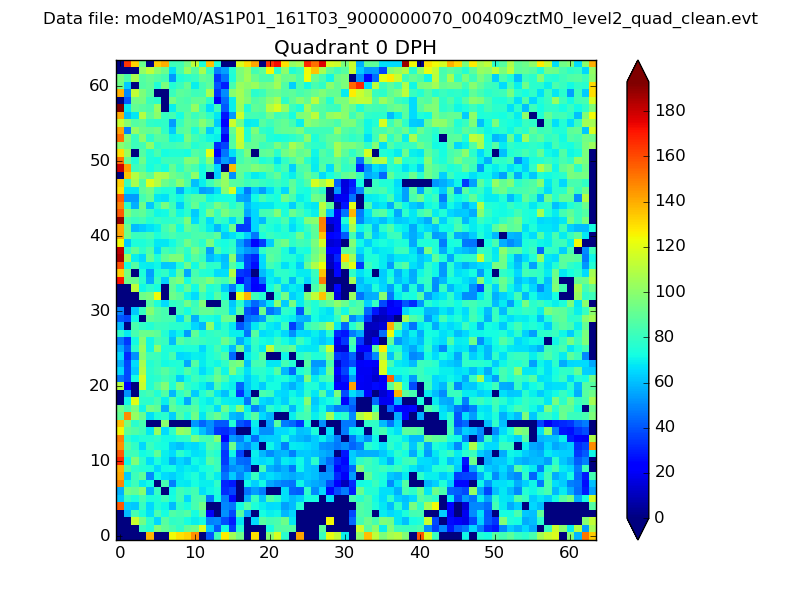 |
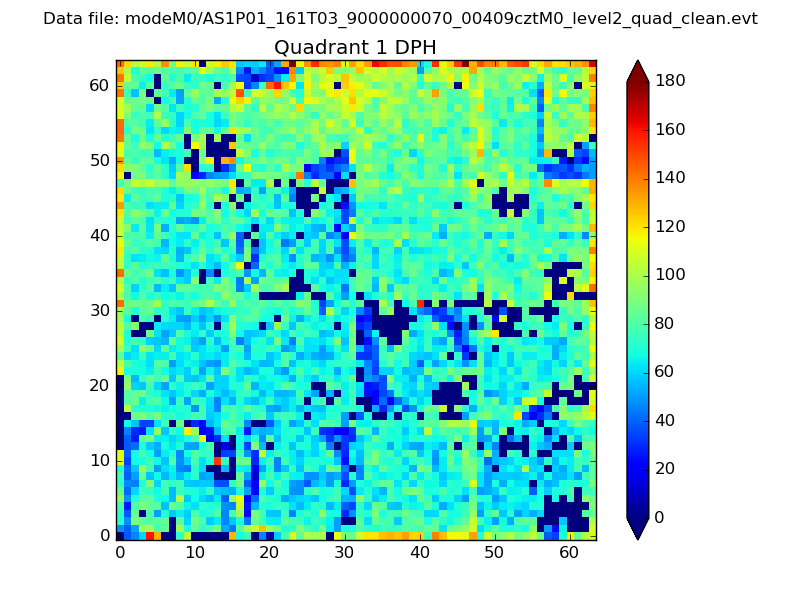 |
Quadrant B |
|---|---|---|---|
| Quadrant D | 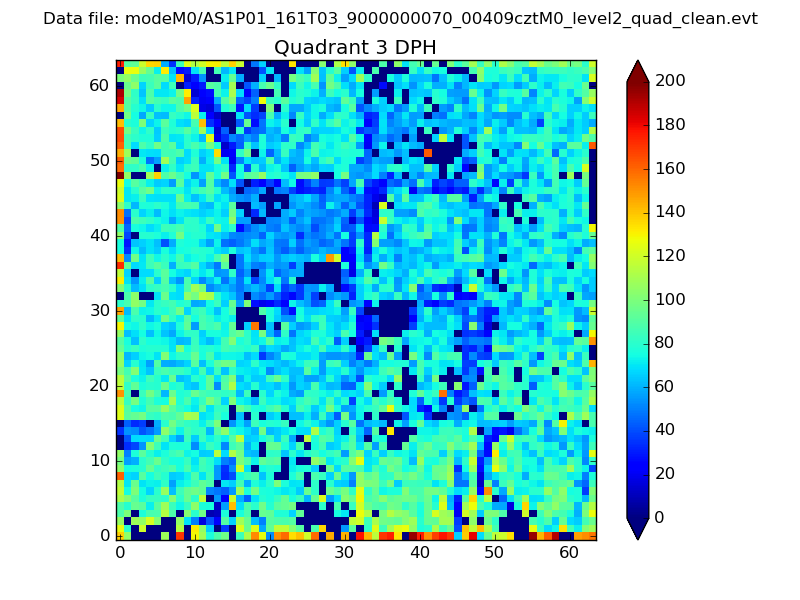 |
 |
Quadrant C |
| Plot type | Count rate plots | Images |
|---|---|---|
| Comparison with Poisson distribution Blue bars denote a histogram of data divided into 1 sec bins. Red curve is a Poisson curve with rate = median count rate of data. |
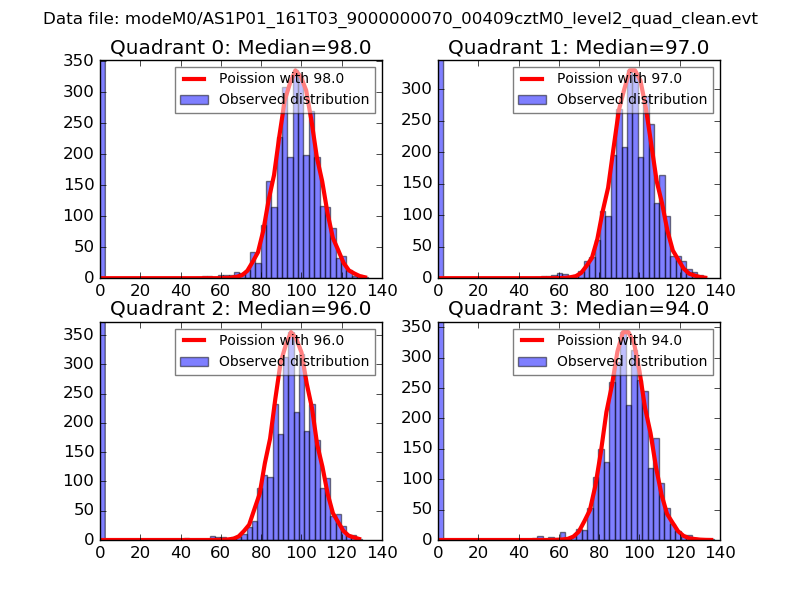 |
 |
| Quadrant-wise count rates Data is divided into 100 sec bins |
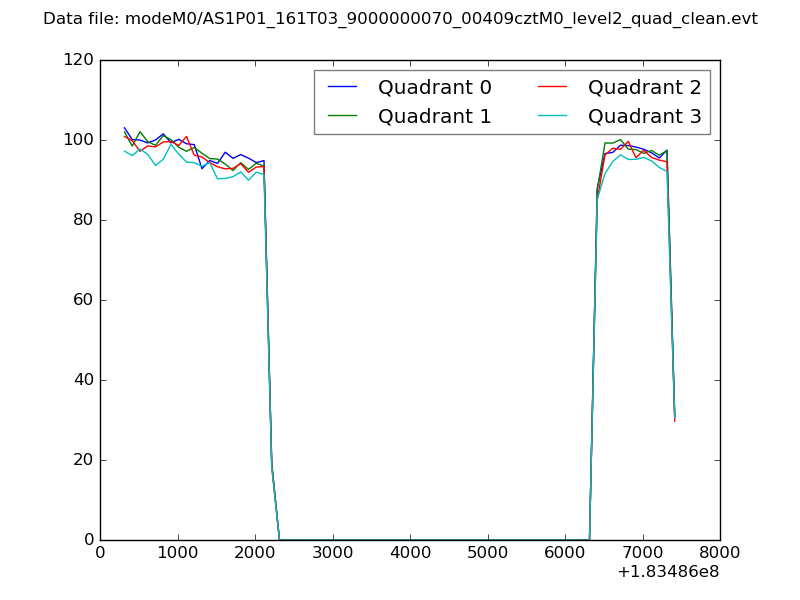 |
|
| Module-wise count rates for Quadrant A Data is divided into 100 sec bins |
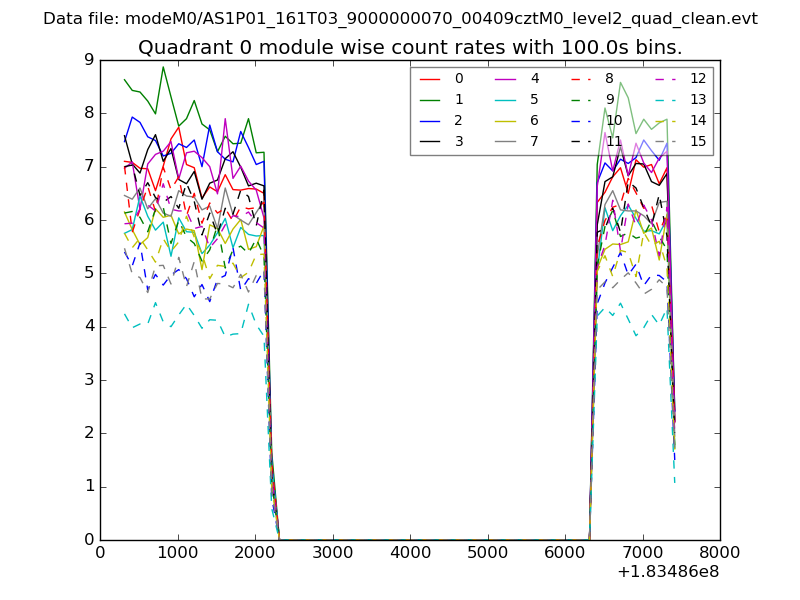 |
 |
| Module-wise count rates for Quadrant B Data is divided into 100 sec bins |
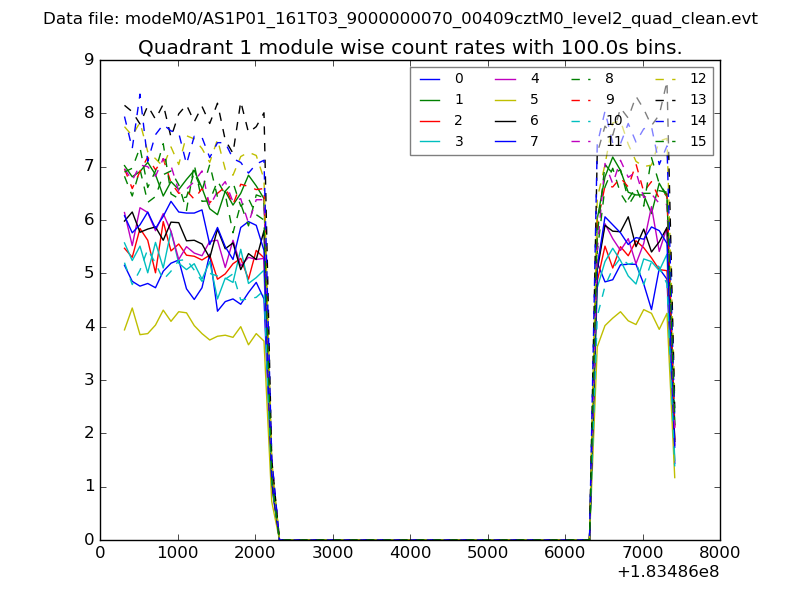 |
 |
| Module-wise count rates for Quadrant C Data is divided into 100 sec bins |
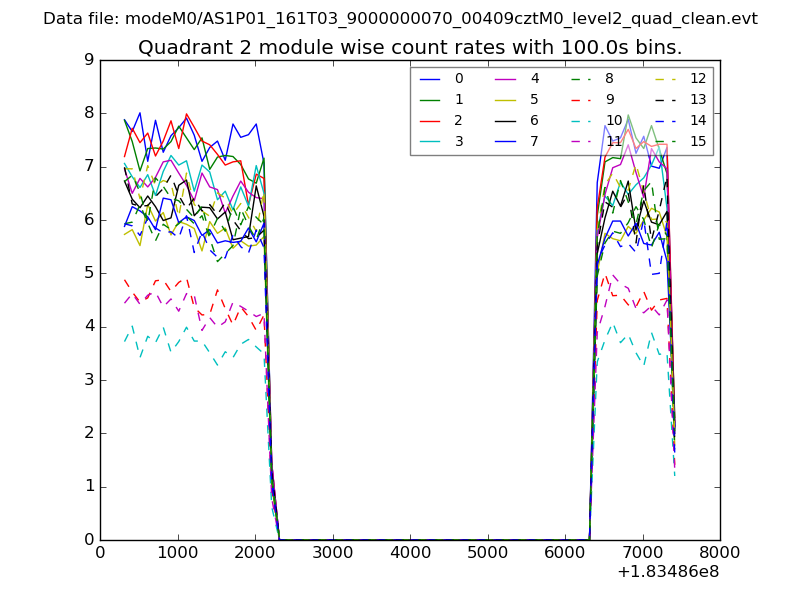 |
 |
| Module-wise count rates for Quadrant D Data is divided into 100 sec bins |
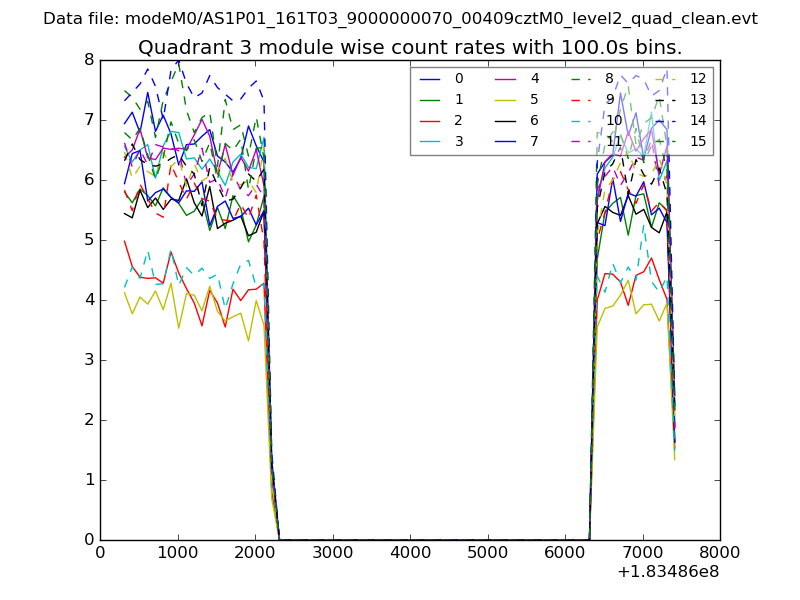 |
 |
| Parameter | Plot |
|---|---|
| CZT HV Monitor | 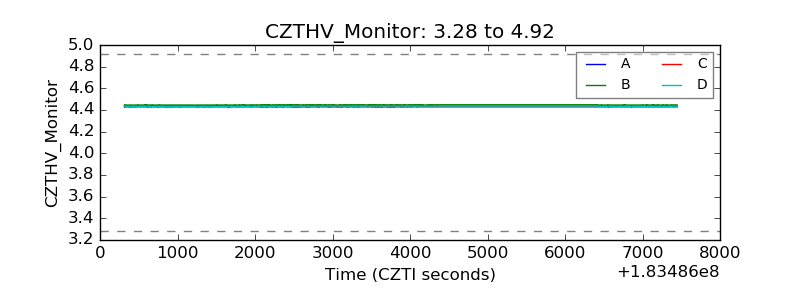 |
| D_VDD | 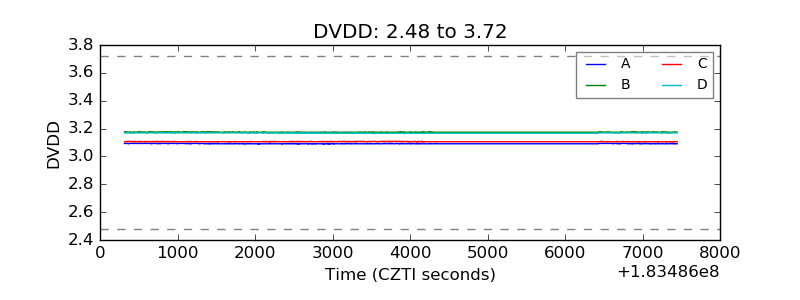 |
| Temperature 1 | 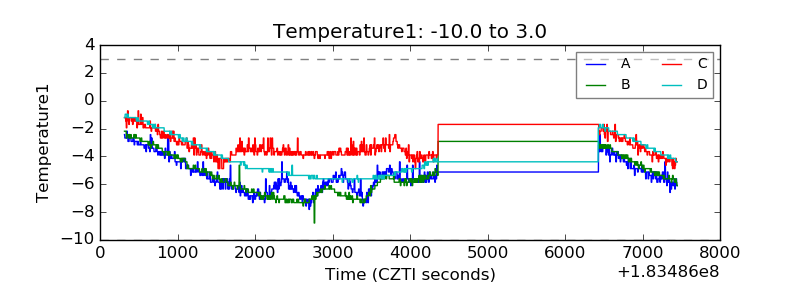 |
| Veto HV Monitor | 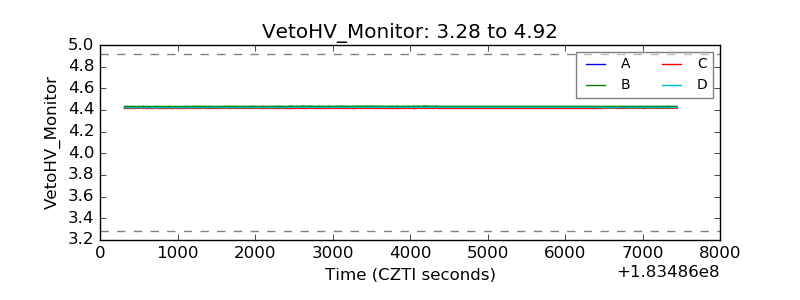 |
| Veto LLD | 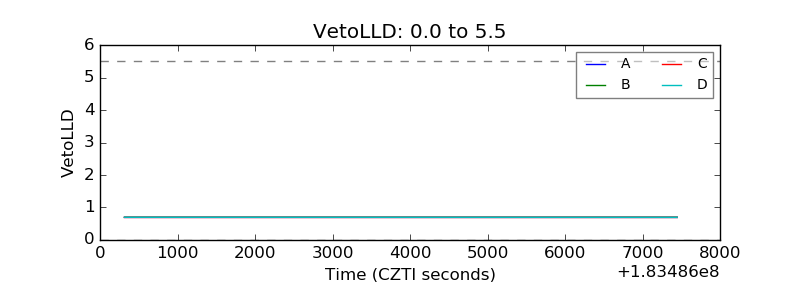 |
| Alpha Counter | 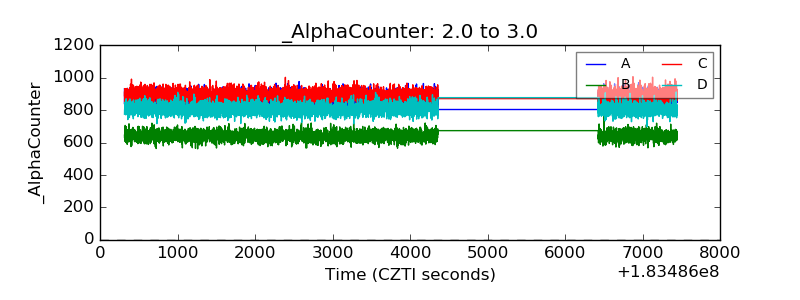 |
| _CPM_Rate | 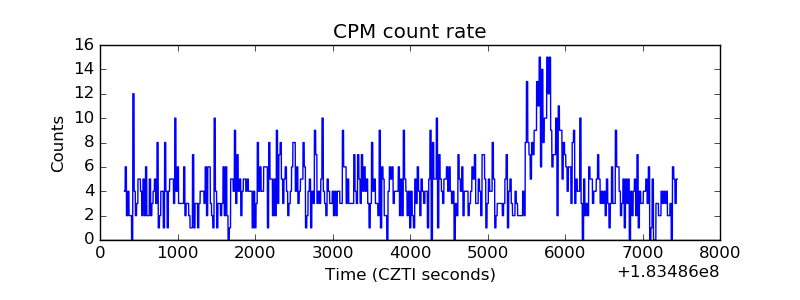 |
| CZT Counter | 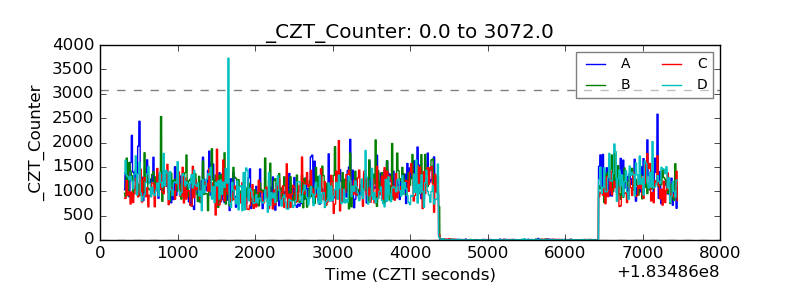 |
| +2.5 Volts monitor |  |
| +5 Volts monitor |  |
| _ROLL_ROT | 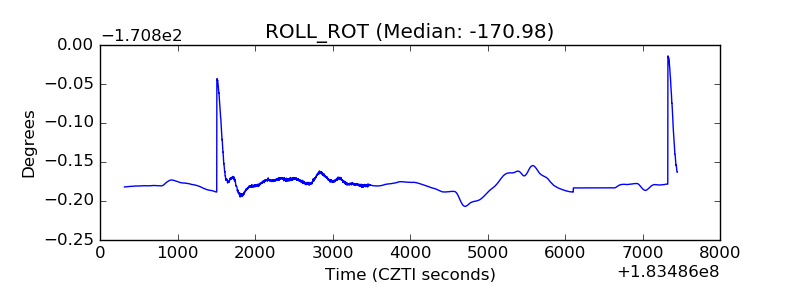 |
| _Roll_DEC | 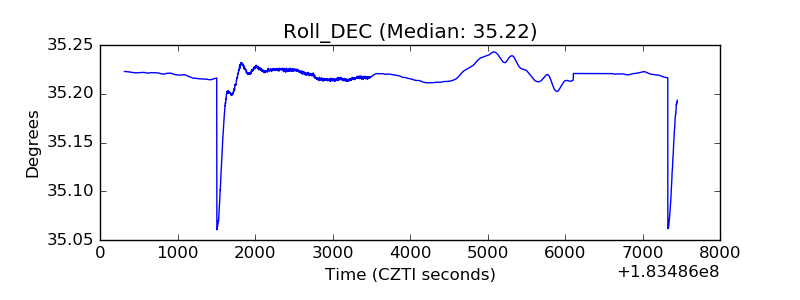 |
| _Roll_RA | 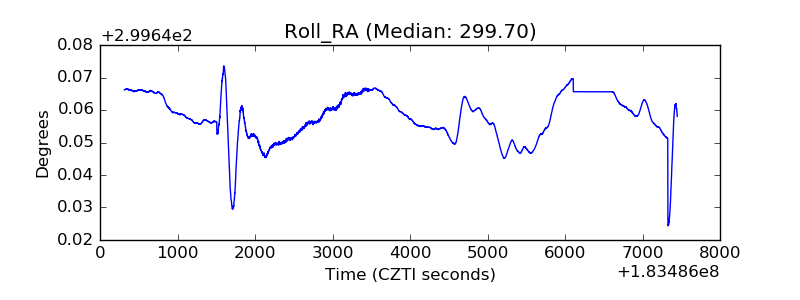 |
| Veto Counter | 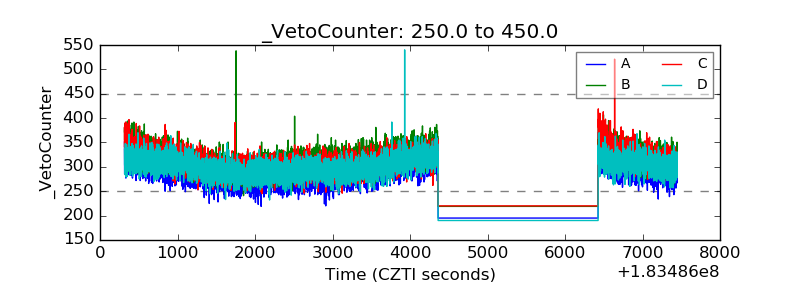 |