| Param | Original file | Final file |
|---|---|---|
| Filename | modeM0/AS1P01_161T03_9000000070_00411cztM0_level2.evt | modeM0/AS1P01_161T03_9000000070_00411cztM0_level2_quad_clean.evt |
| Size (bytes) | 764,933,760 | 40,242,240 |
| Size | 729.5 MB | 38.4 MB |
| Events in quadrant A | 5,744,914 | 225,492 |
| Events in quadrant B | 5,964,508 | 214,499 |
| Events in quadrant C | 5,565,314 | 222,714 |
| Events in quadrant D | 5,563,729 | 210,229 |
| Mode SS | |||
|---|---|---|---|
| Quadrant | BADHDUFLAG | Total packets | Discarded packets |
| A | 0 | 100 | 0 |
| B | 0 | 100 | 0 |
| C | 0 | 100 | 0 |
| D | 0 | 100 | 0 |
| Mode M0 | |||
|---|---|---|---|
| Quadrant | BADHDUFLAG | Total packets | Discarded packets |
| A | 0 | 20580 | 2 |
| B | 0 | 21230 | 1 |
| C | 0 | 20003 | 1 |
| D | 0 | 20025 | 1 |
| Mode M9 | |||
|---|---|---|---|
| Quadrant | BADHDUFLAG | Total packets | Discarded packets |
| A | 0 | 21 | 0 |
| B | 0 | 21 | 0 |
| C | 0 | 21 | 0 |
| D | 0 | 21 | 0 |
| Quadrant | Total seconds | Saturated seconds | Saturation percentage |
|---|---|---|---|
| A | 4920 | 5 | 0.101626% |
| B | 4920 | 48 | 0.975610% |
| C | 4920 | 21 | 0.426829% |
| D | 4920 | 34 | 0.691057% |
Noise dominated data is calculated using 1-second bins in cleaned event files. If a bin has >2000 counts, and if more than 50% of those come from <1% of pixels, then it is considered to be noise-dominated and hence unusable.
| Quadrant | # 1 sec bins | Bins with >0 counts | Bins with >2000 counts | High rate bins dominated by noise | Noise dominated (total time) | Noise dominated (detector-on time) | Marked lightcurve |
|---|---|---|---|---|---|---|---|
| A | 6984 | 4921 | 109 | 109 | 1.56% | 2.21% | 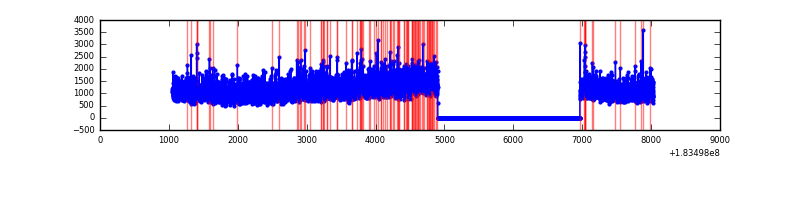 |
| B | 6984 | 4921 | 153 | 153 | 2.19% | 3.11% | 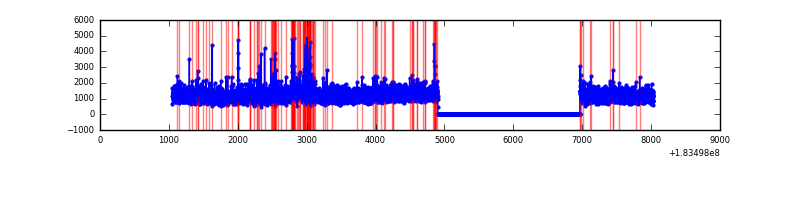 |
| C | 6984 | 4921 | 110 | 110 | 1.58% | 2.24% | 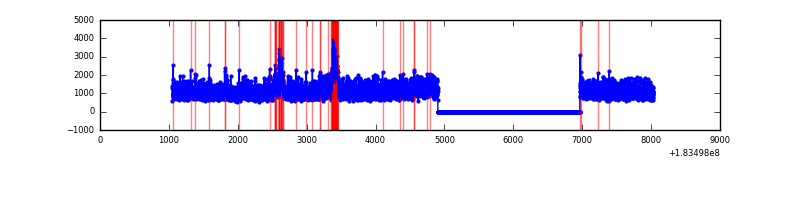 |
| D | 6984 | 4921 | 119 | 119 | 1.70% | 2.42% | 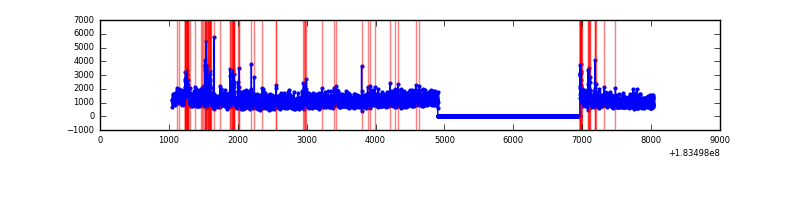 |
Top three noisy pixels from each quadrant. If the there are fewer than three noisy pixels in the level2.evt file, extra rows are filled as -1
| Pixel properties | Quadrant properties | ||||||
|---|---|---|---|---|---|---|---|
| Quadrant | DetID | PixID | Counts | Sigma | Mean | Median | Sigma |
| A | 12 | 133 | 100418 | 309.48 | 1429 | 1416 | 319.9 |
| A | 0 | 238 | 37820 | 113.8 | 1429 | 1416 | 319.9 |
| A | 12 | 243 | 22787 | 66.81 | 1429 | 1416 | 319.9 |
| B | 2 | 32 | 323520 | 951.69 | 1451 | 1460 | 338.4 |
| B | 0 | 23 | 20835 | 57.25 | 1451 | 1460 | 338.4 |
| B | 14 | 53 | 20276 | 55.6 | 1451 | 1460 | 338.4 |
| C | 1 | 1 | 337579 | 904.22 | 1326 | 1380 | 371.8 |
| C | 9 | 206 | 13630 | 32.95 | 1326 | 1380 | 371.8 |
| C | 3 | 159 | 5980 | 12.37 | 1326 | 1380 | 371.8 |
| D | 13 | 7 | 440635 | 1115.79 | 1249 | 1300 | 393.7 |
| D | 13 | 221 | 111775 | 280.58 | 1249 | 1300 | 393.7 |
| D | 1 | 5 | 64014 | 159.28 | 1249 | 1300 | 393.7 |
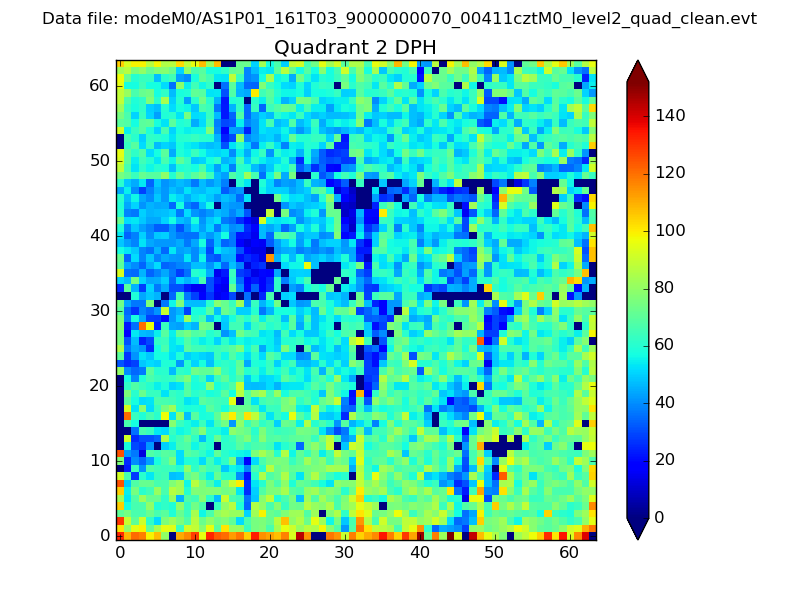
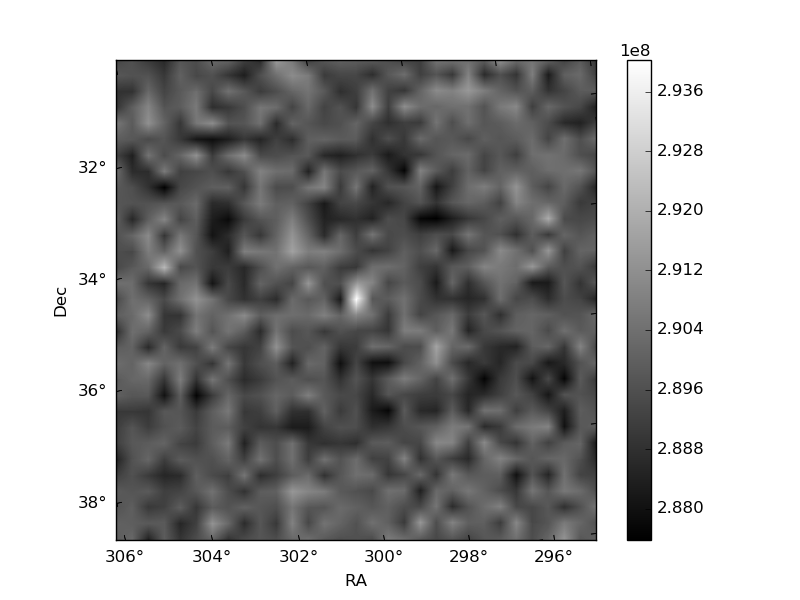
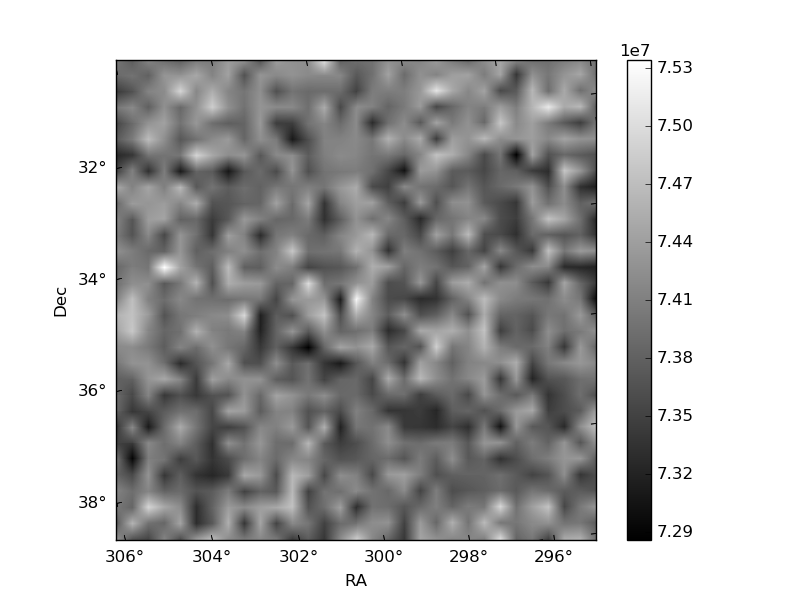
Histogram calculated using DETX and DETY for each event in the final _common_clean file
| Quadrant A | 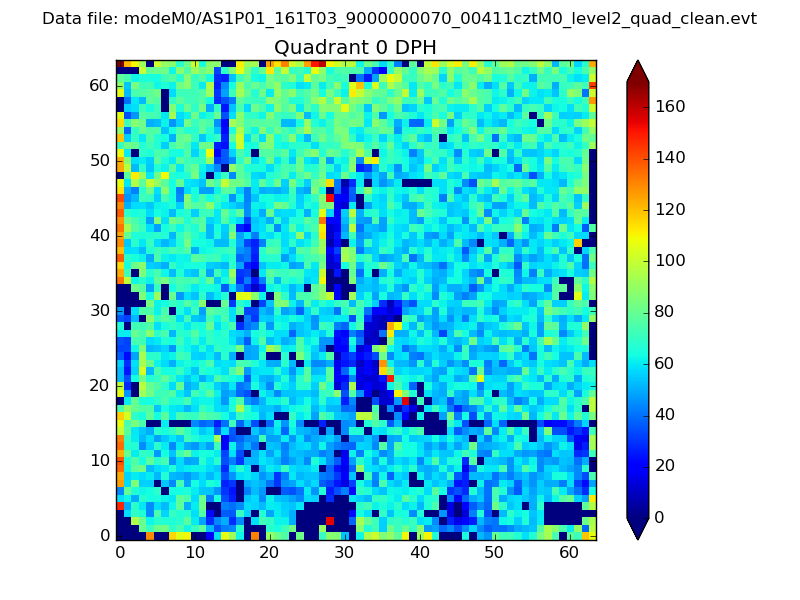 |
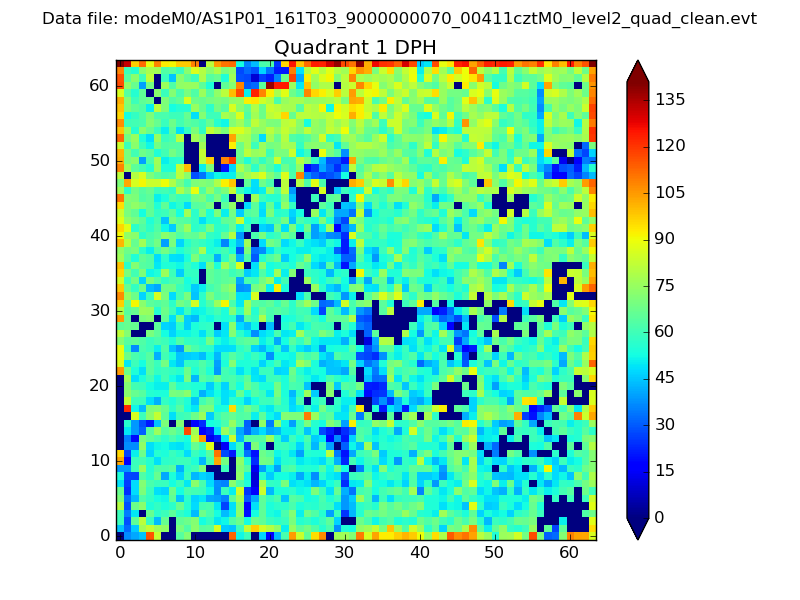 |
Quadrant B |
|---|---|---|---|
| Quadrant D | 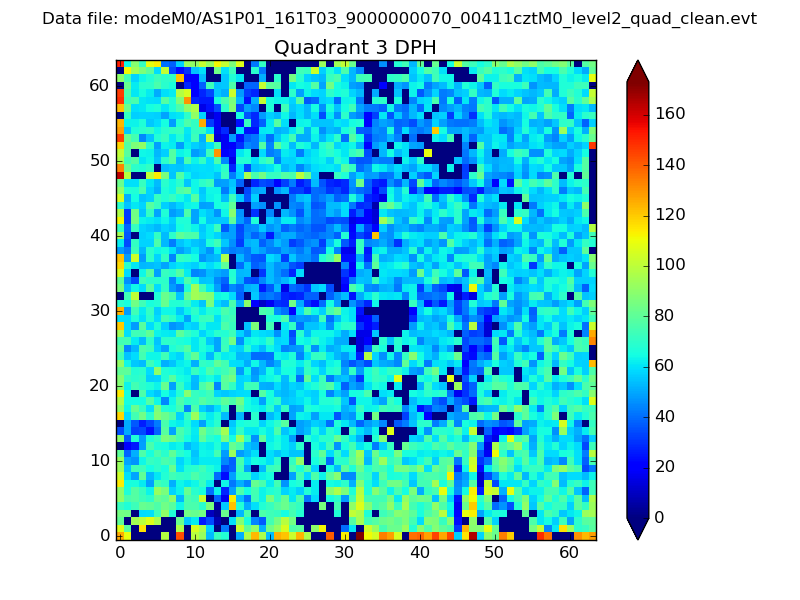 |
 |
Quadrant C |
| Plot type | Count rate plots | Images |
|---|---|---|
| Comparison with Poisson distribution Blue bars denote a histogram of data divided into 1 sec bins. Red curve is a Poisson curve with rate = median count rate of data. |
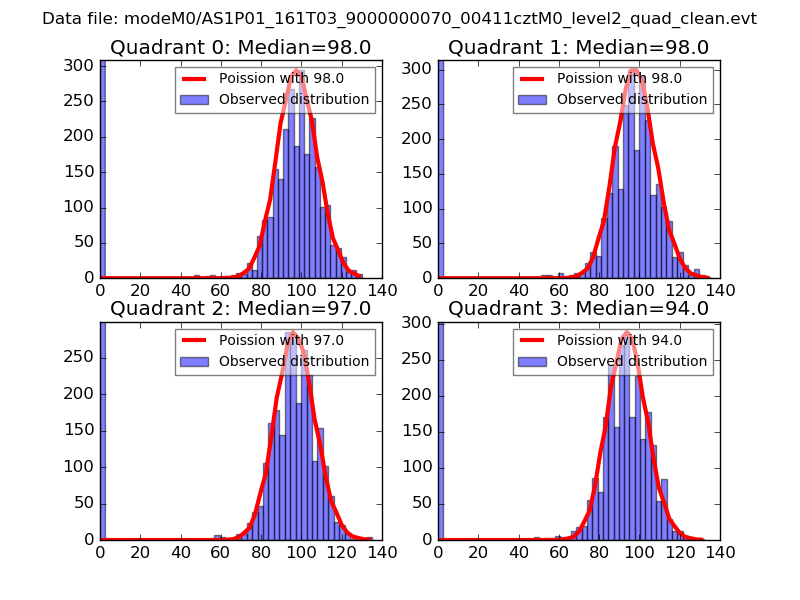 |
 |
| Quadrant-wise count rates Data is divided into 100 sec bins |
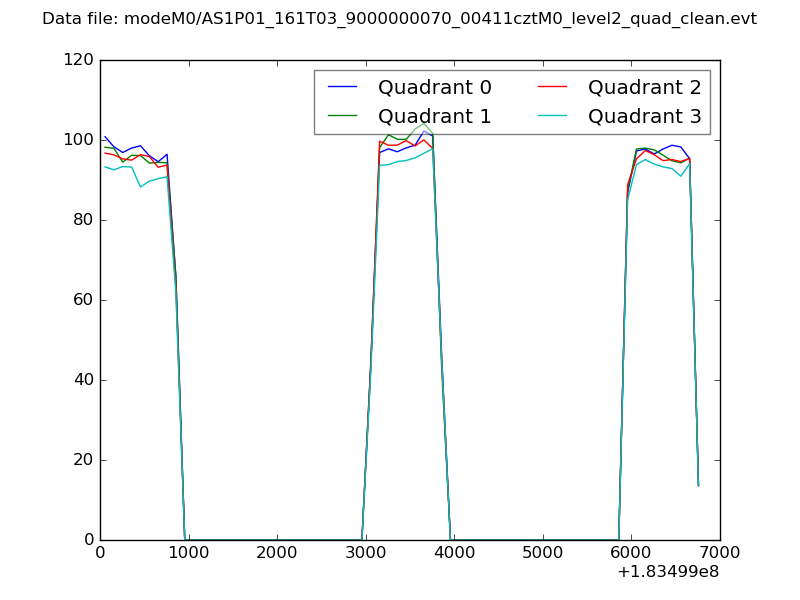 |
|
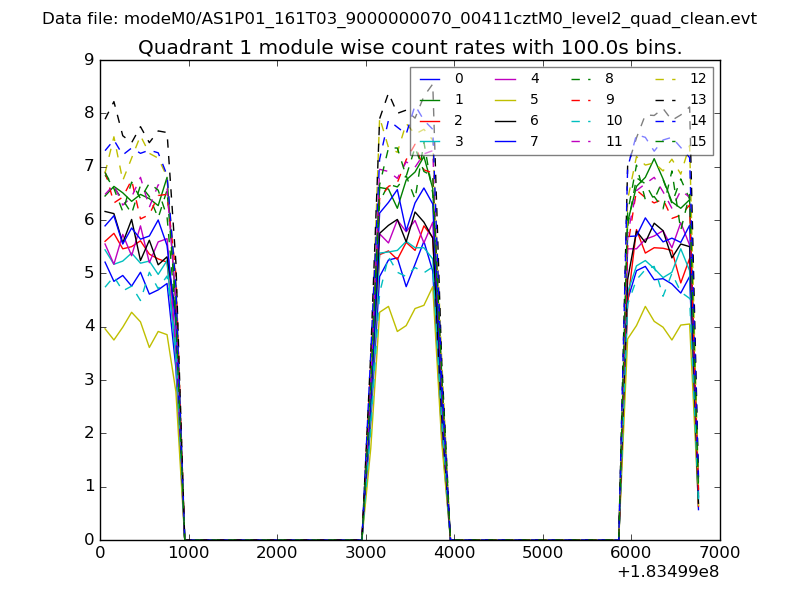
| Module-wise count rates for Quadrant A Data is divided into 100 sec bins |
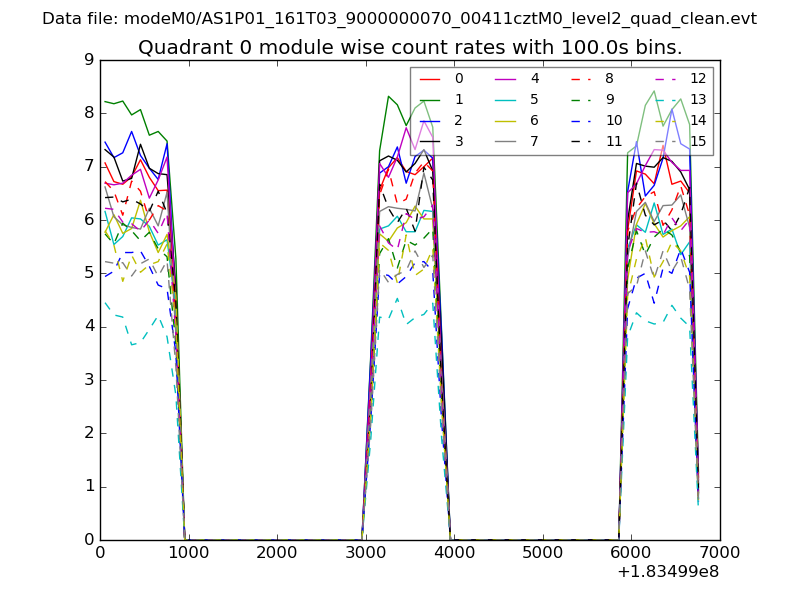 |
 |
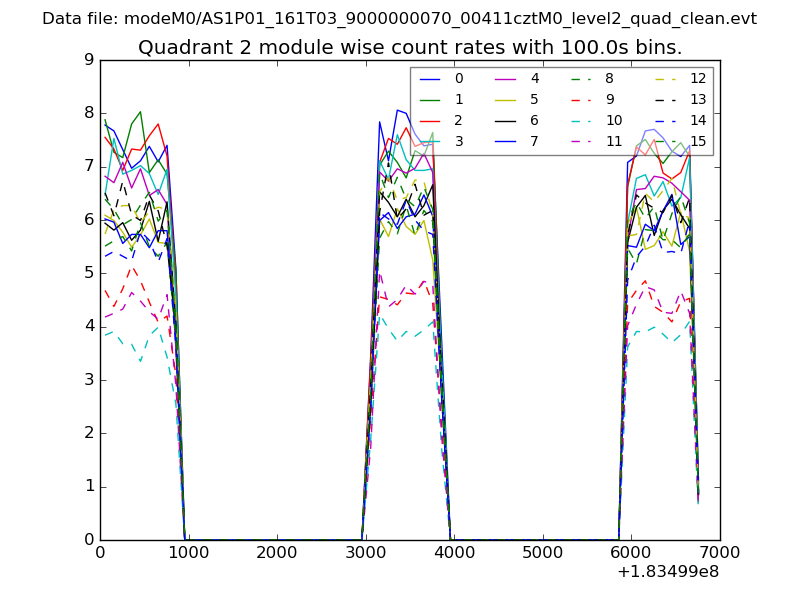
| Module-wise count rates for Quadrant B Data is divided into 100 sec bins |
 |
 |
| Module-wise count rates for Quadrant C Data is divided into 100 sec bins |
 |
 |
| Module-wise count rates for Quadrant D Data is divided into 100 sec bins |
 |
 |
| Parameter | Plot |
|---|---|
| CZT HV Monitor | 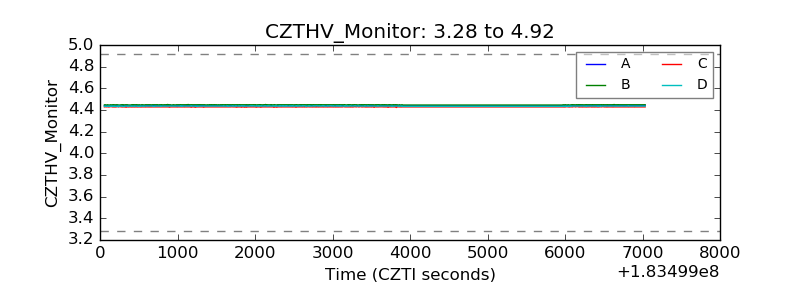 |
| D_VDD | 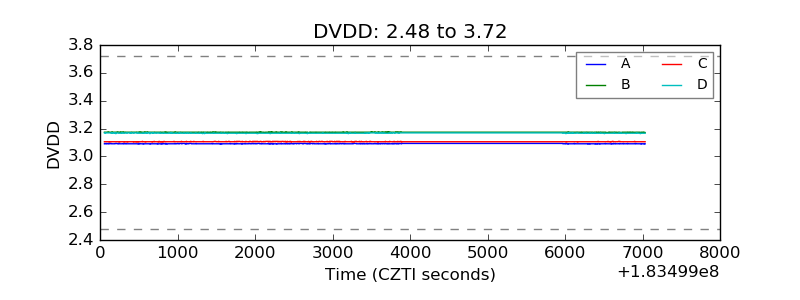 |
| Temperature 1 | 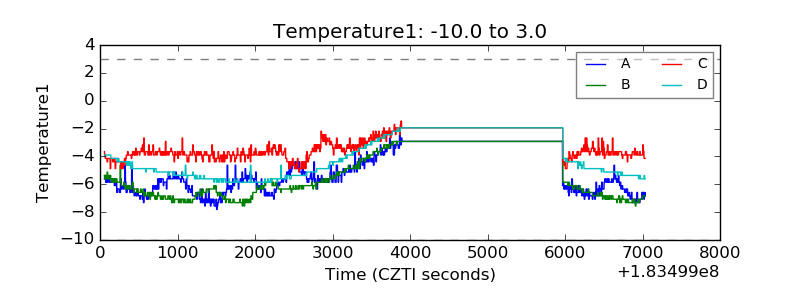 |
| Veto HV Monitor | 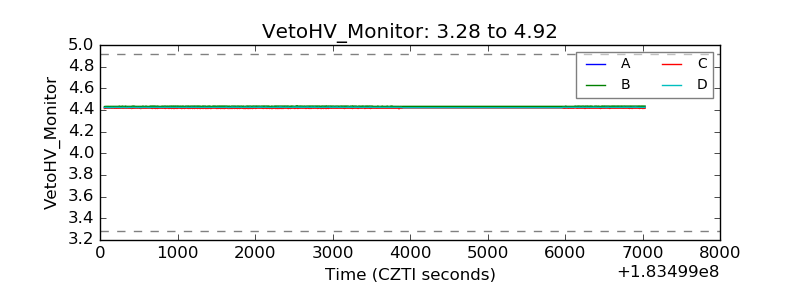 |
| Veto LLD | 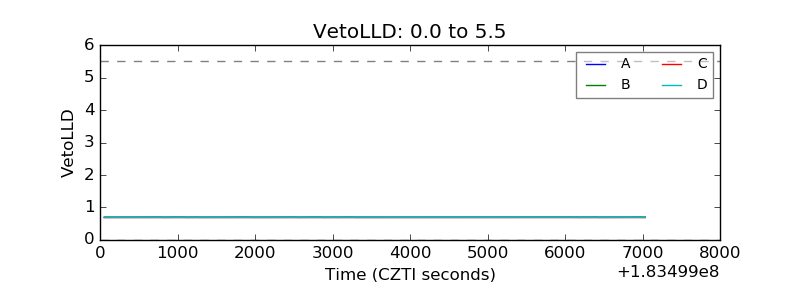 |
| Alpha Counter | 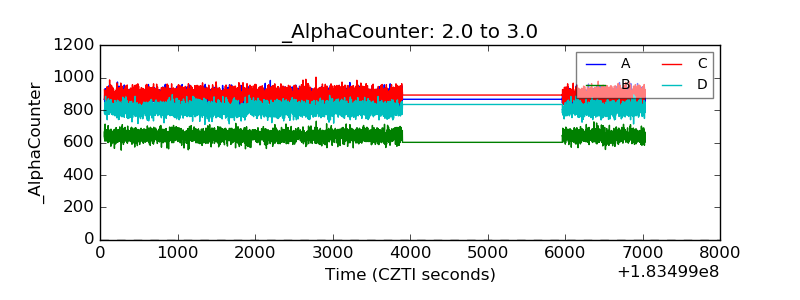 |
| _CPM_Rate | 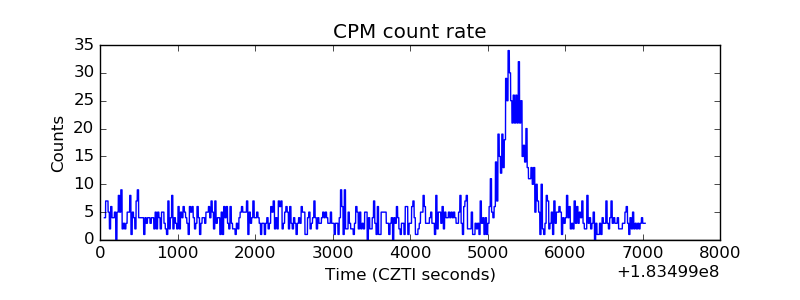 |
| CZT Counter | 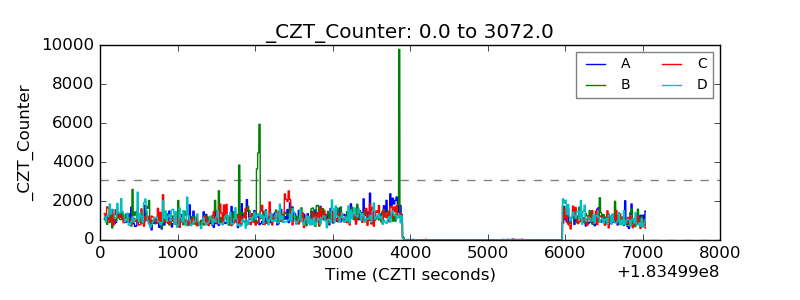 |
| +2.5 Volts monitor |  |
| +5 Volts monitor |  |
| _ROLL_ROT | 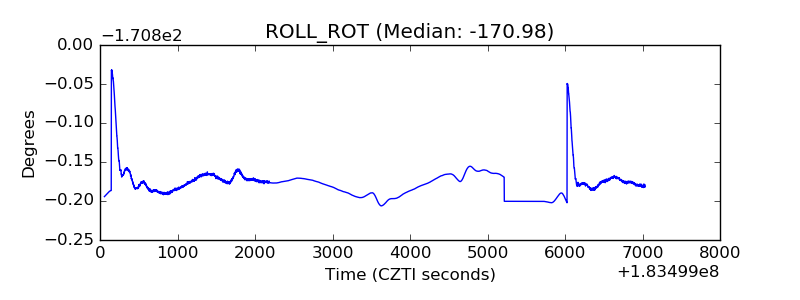 |
| _Roll_DEC | 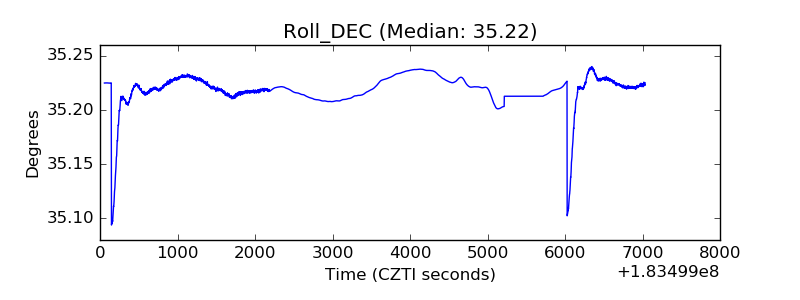 |
| _Roll_RA | 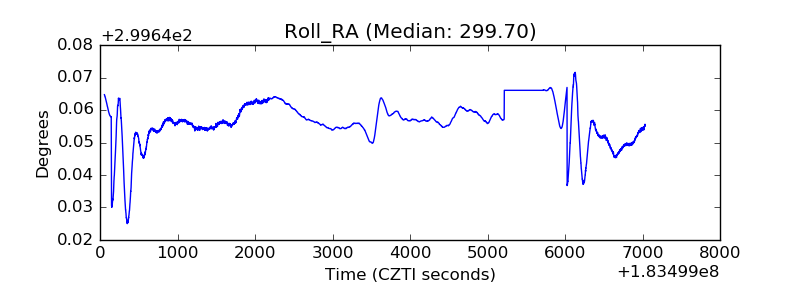 |
| Veto Counter | 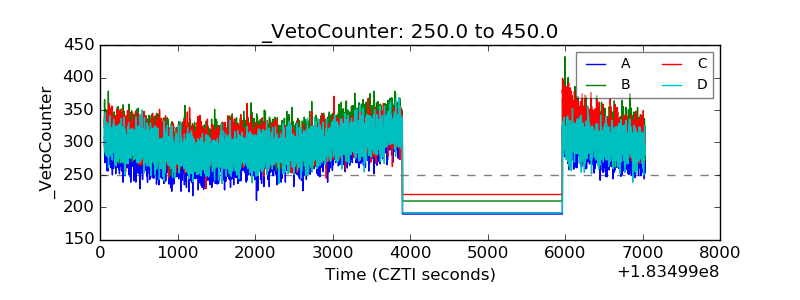 |