| Param | Original file | Final file |
|---|---|---|
| Filename | modeM0/AS1P01_161T03_9000000070_00412cztM0_level2.evt | modeM0/AS1P01_161T03_9000000070_00412cztM0_level2_quad_clean.evt |
| Size (bytes) | 831,712,320 | 40,818,240 |
| Size | 793.2 MB | 38.9 MB |
| Events in quadrant A | 6,537,487 | 219,160 |
| Events in quadrant B | 6,417,262 | 209,401 |
| Events in quadrant C | 5,994,435 | 217,326 |
| Events in quadrant D | 5,874,749 | 206,122 |
| Mode SS | |||
|---|---|---|---|
| Quadrant | BADHDUFLAG | Total packets | Discarded packets |
| A | 0 | 112 | 0 |
| B | 0 | 112 | 0 |
| C | 0 | 112 | 0 |
| D | 0 | 112 | 0 |
| Mode M0 | |||
|---|---|---|---|
| Quadrant | BADHDUFLAG | Total packets | Discarded packets |
| A | 0 | 23275 | 3 |
| B | 0 | 22951 | 2 |
| C | 0 | 21690 | 2 |
| D | 0 | 21395 | 2 |
| Mode M9 | |||
|---|---|---|---|
| Quadrant | BADHDUFLAG | Total packets | Discarded packets |
| A | 0 | 22 | 0 |
| B | 0 | 22 | 0 |
| C | 0 | 22 | 0 |
| D | 0 | 23 | 0 |
| Quadrant | Total seconds | Saturated seconds | Saturation percentage |
|---|---|---|---|
| A | 5474 | 3 | 0.054805% |
| B | 5474 | 7 | 0.127877% |
| C | 5474 | 3 | 0.054805% |
| D | 5474 | 15 | 0.274023% |
Noise dominated data is calculated using 1-second bins in cleaned event files. If a bin has >2000 counts, and if more than 50% of those come from <1% of pixels, then it is considered to be noise-dominated and hence unusable.
| Quadrant | # 1 sec bins | Bins with >0 counts | Bins with >2000 counts | High rate bins dominated by noise | Noise dominated (total time) | Noise dominated (detector-on time) | Marked lightcurve |
|---|---|---|---|---|---|---|---|
| A | 7539 | 5475 | 133 | 133 | 1.76% | 2.43% | 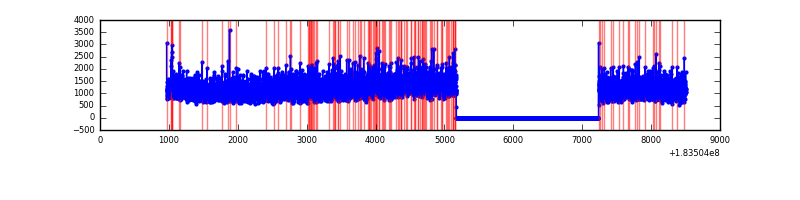 |
| B | 7539 | 5475 | 81 | 81 | 1.07% | 1.48% | 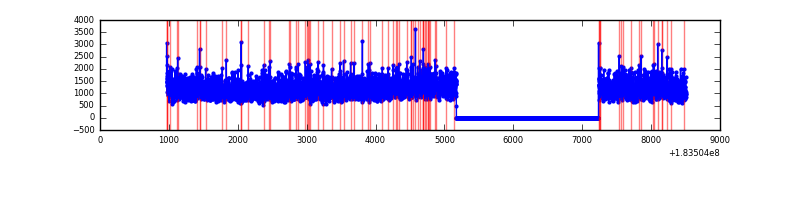 |
| C | 7539 | 5475 | 36 | 36 | 0.48% | 0.66% | 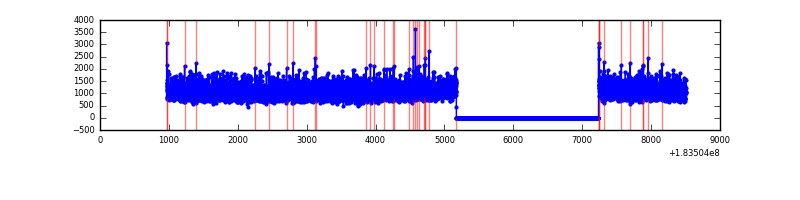 |
| D | 7539 | 5475 | 85 | 85 | 1.13% | 1.55% | 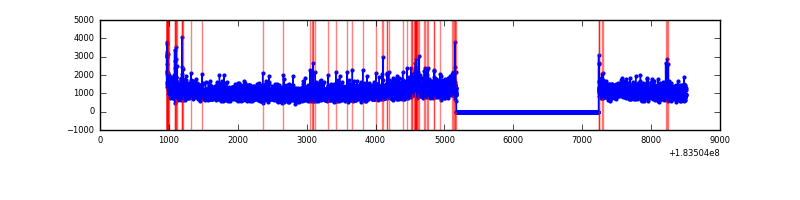 |
Top three noisy pixels from each quadrant. If the there are fewer than three noisy pixels in the level2.evt file, extra rows are filled as -1
| Pixel properties | Quadrant properties | ||||||
|---|---|---|---|---|---|---|---|
| Quadrant | DetID | PixID | Counts | Sigma | Mean | Median | Sigma |
| A | 12 | 133 | 120597 | 328.96 | 1623 | 1610 | 361.7 |
| A | 0 | 238 | 48675 | 130.12 | 1623 | 1610 | 361.7 |
| A | 12 | 243 | 46977 | 125.42 | 1623 | 1610 | 361.7 |
| B | 15 | 82 | 19675 | 46.66 | 1651 | 1661 | 386.1 |
| B | 0 | 220 | 19429 | 46.02 | 1651 | 1661 | 386.1 |
| B | 0 | 207 | 14817 | 34.08 | 1651 | 1661 | 386.1 |
| C | 3 | 159 | 33722 | 76.59 | 1505 | 1566 | 419.9 |
| C | 9 | 206 | 20266 | 44.54 | 1505 | 1566 | 419.9 |
| C | 1 | 1 | 16185 | 34.82 | 1505 | 1566 | 419.9 |
| D | 13 | 7 | 90554 | 197.02 | 1424 | 1481 | 452.1 |
| D | 13 | 221 | 90422 | 196.73 | 1424 | 1481 | 452.1 |
| D | 1 | 5 | 77425 | 167.98 | 1424 | 1481 | 452.1 |
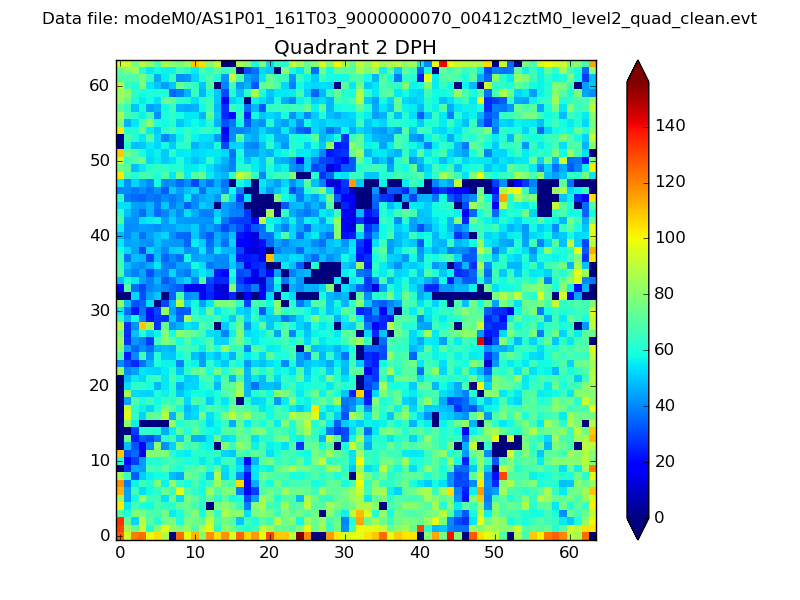
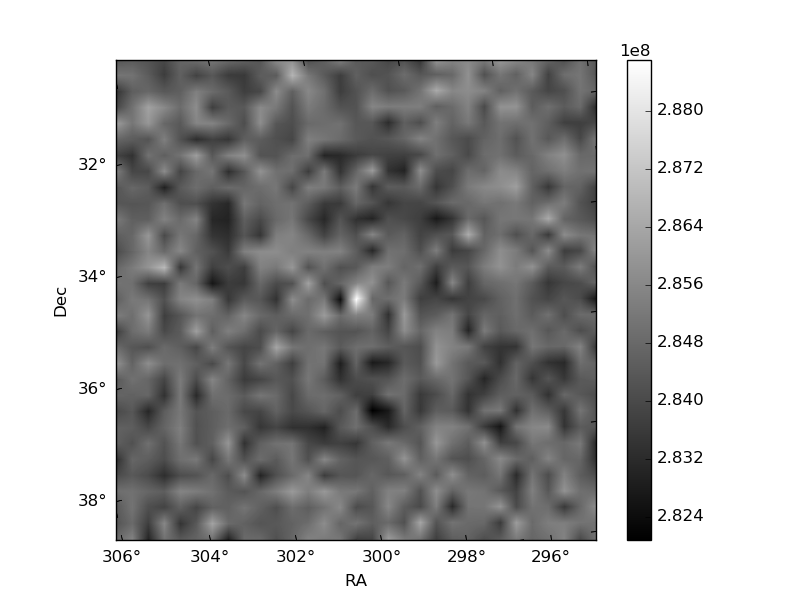
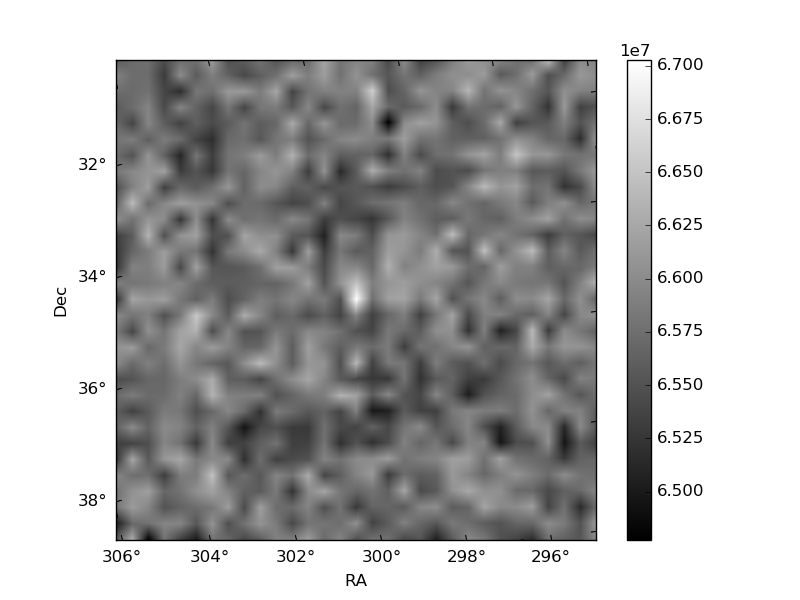
Histogram calculated using DETX and DETY for each event in the final _common_clean file
| Quadrant A | 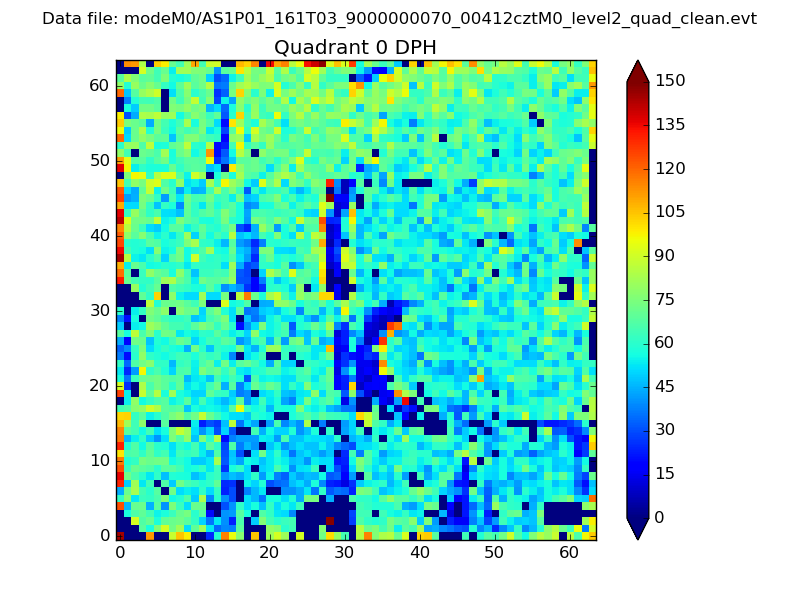 |
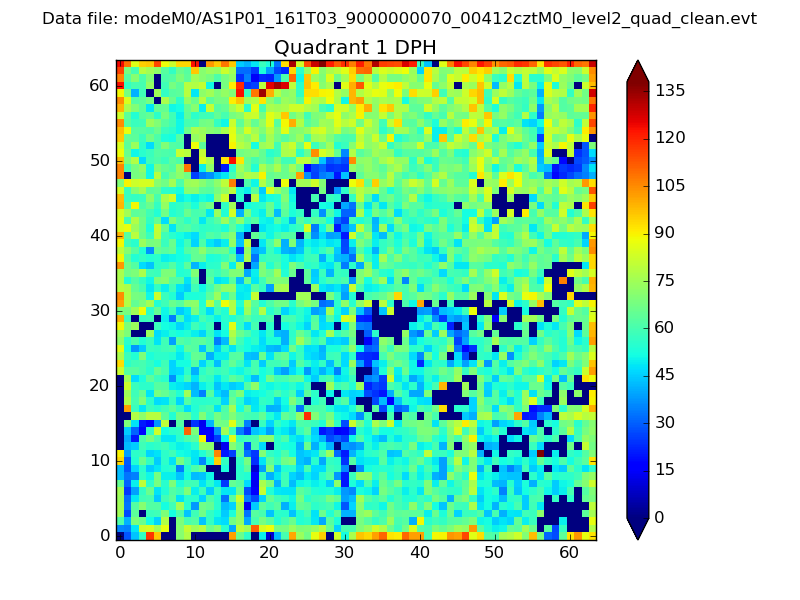 |
Quadrant B |
|---|---|---|---|
| Quadrant D | 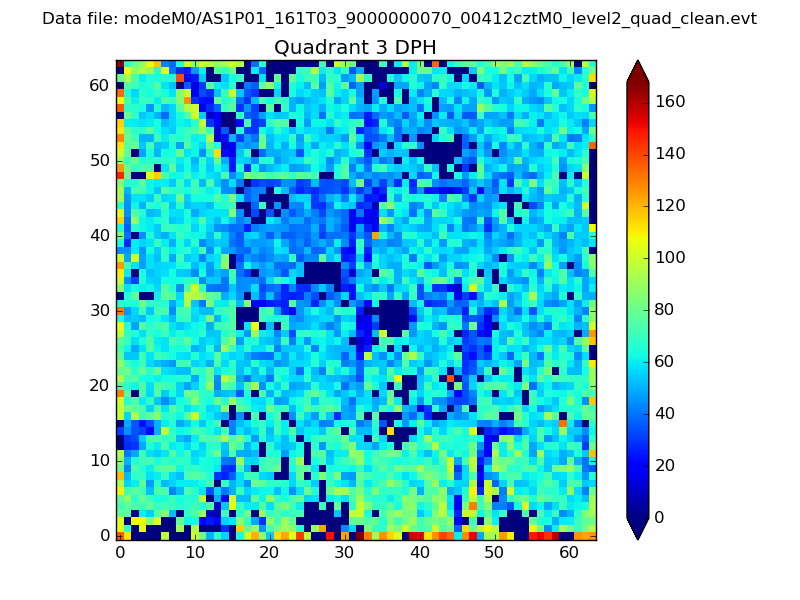 |
 |
Quadrant C |
| Plot type | Count rate plots | Images |
|---|---|---|
| Comparison with Poisson distribution Blue bars denote a histogram of data divided into 1 sec bins. Red curve is a Poisson curve with rate = median count rate of data. |
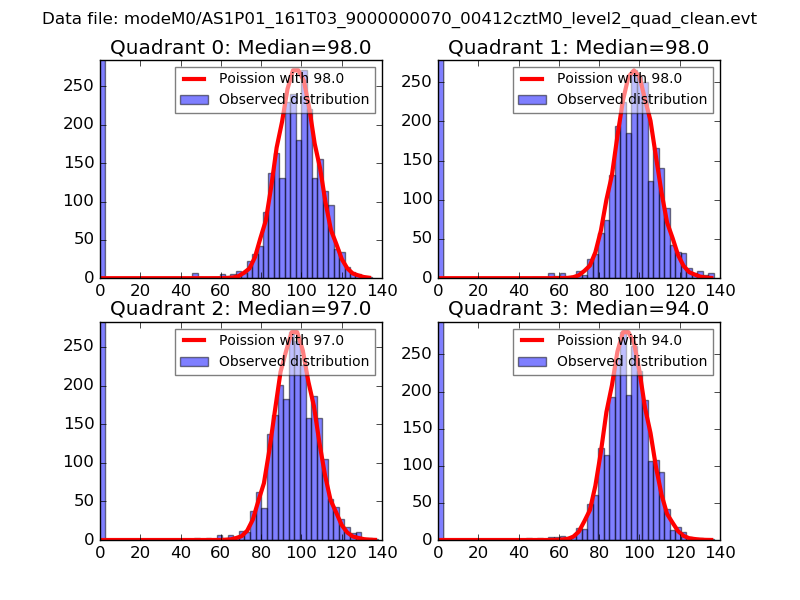 |
 |
| Quadrant-wise count rates Data is divided into 100 sec bins |
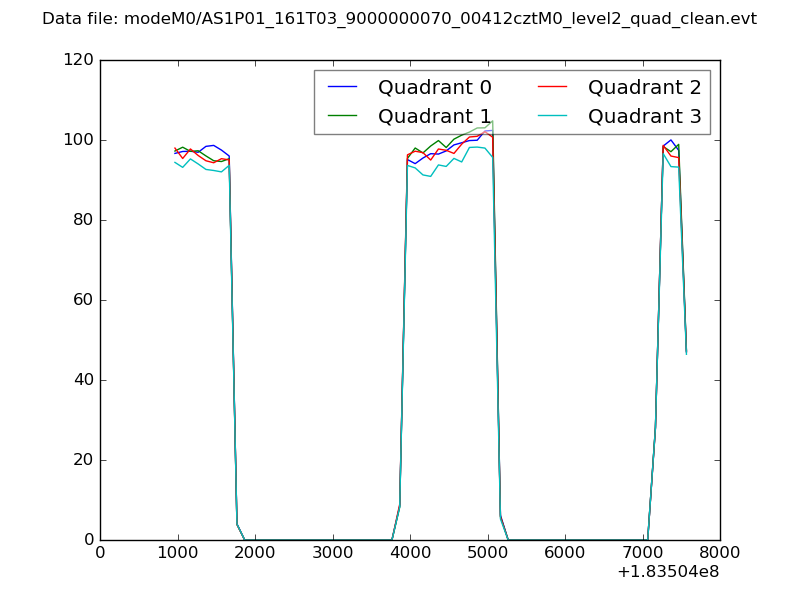 |
|
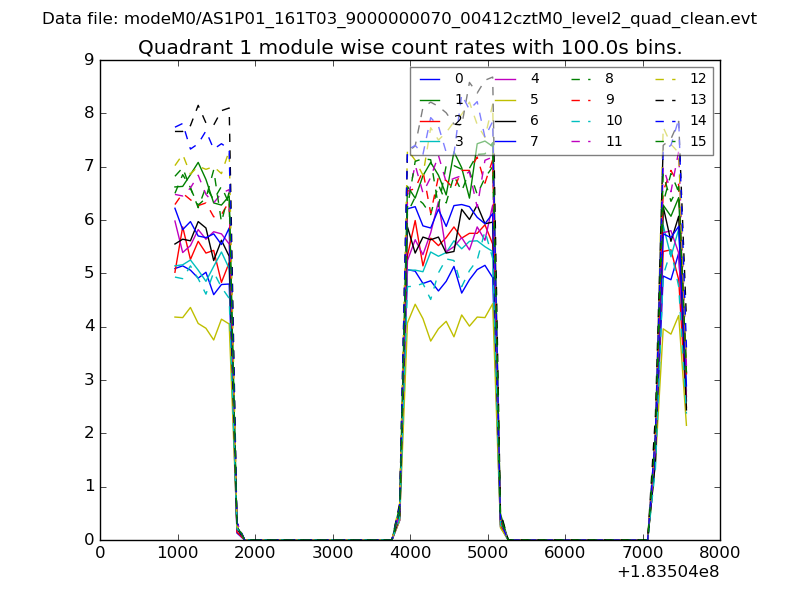
| Module-wise count rates for Quadrant A Data is divided into 100 sec bins |
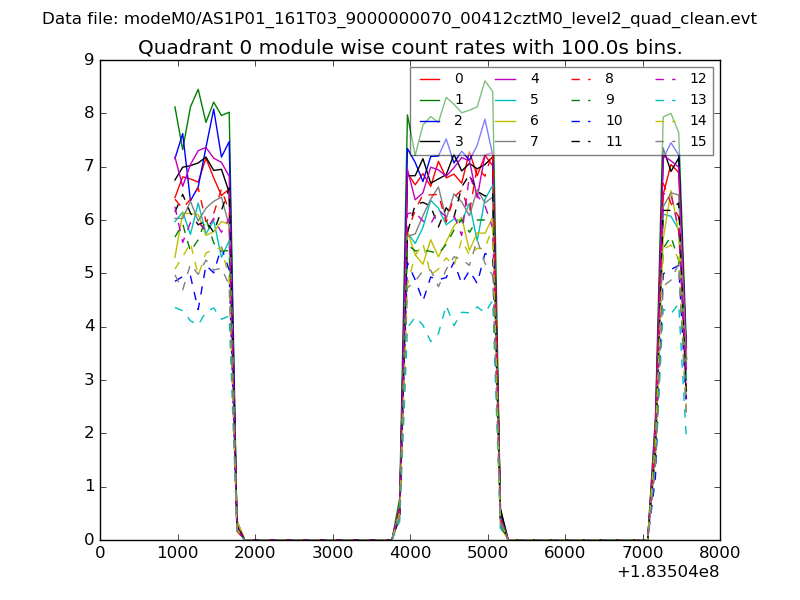 |
 |
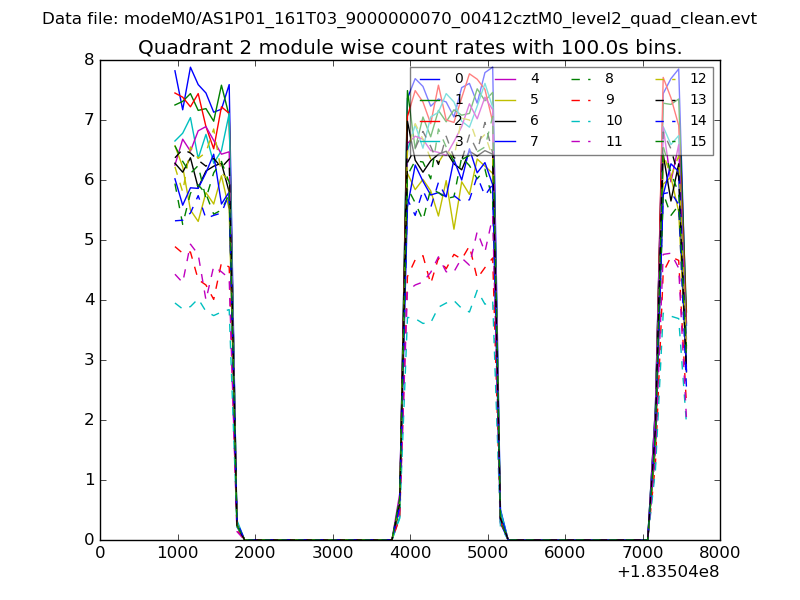
| Module-wise count rates for Quadrant B Data is divided into 100 sec bins |
 |
 |
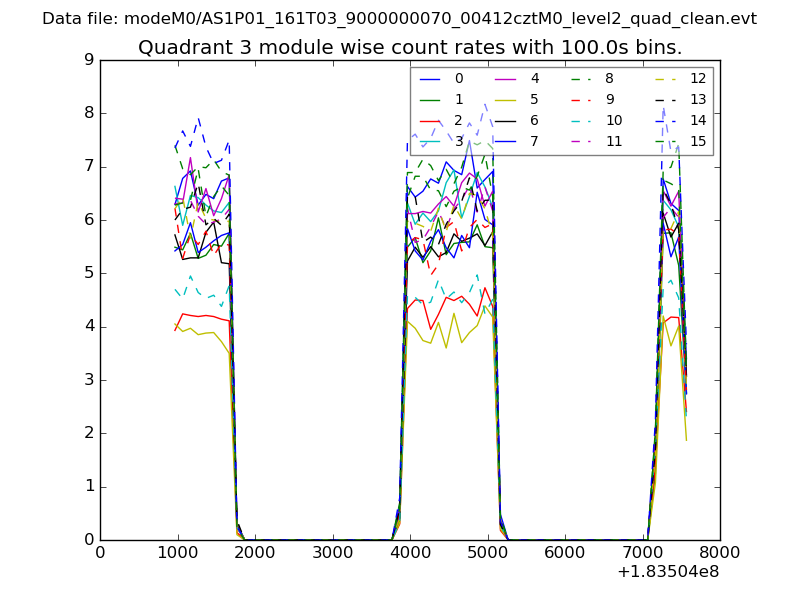
| Module-wise count rates for Quadrant C Data is divided into 100 sec bins |
 |
 |
| Module-wise count rates for Quadrant D Data is divided into 100 sec bins |
 |
 |
| Parameter | Plot |
|---|---|
| CZT HV Monitor | 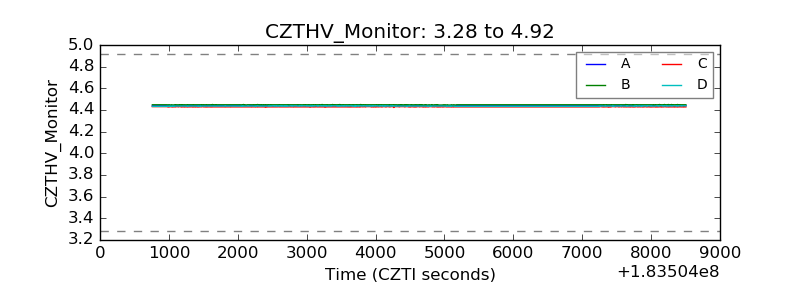 |
| D_VDD | 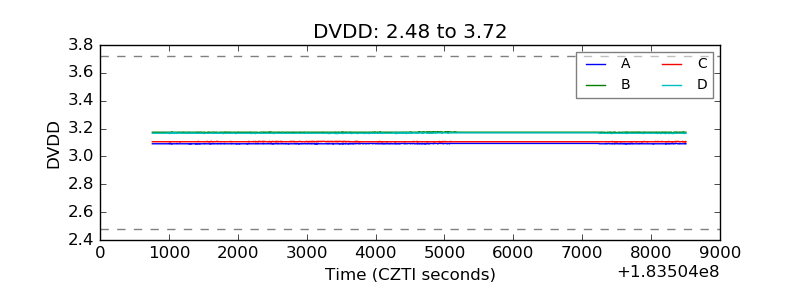 |
| Temperature 1 | 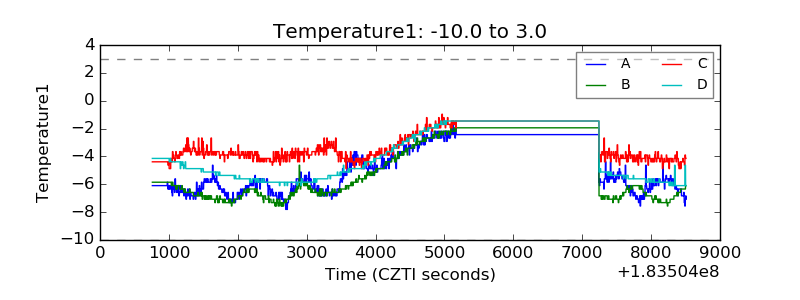 |
| Veto HV Monitor | 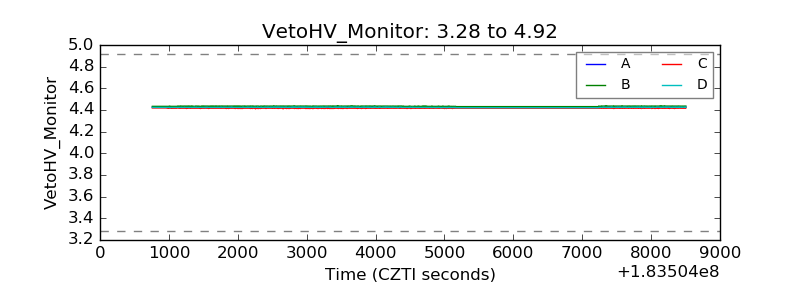 |
| Veto LLD | 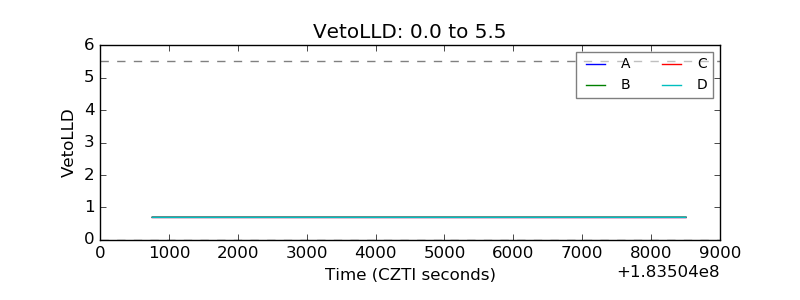 |
| Alpha Counter | 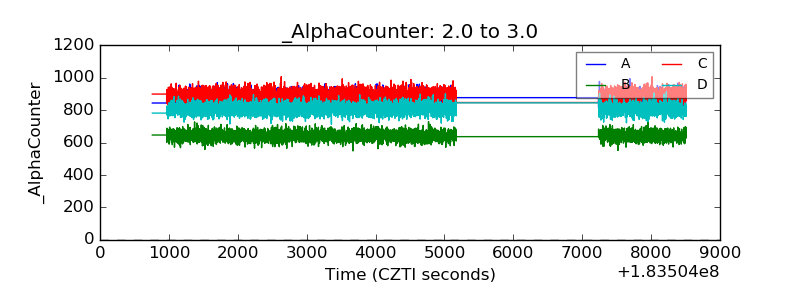 |
| _CPM_Rate | 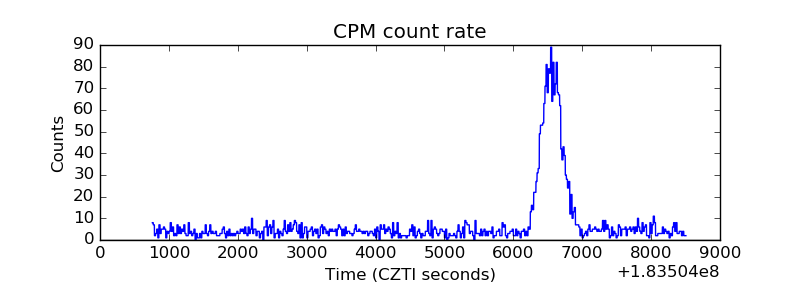 |
| CZT Counter | 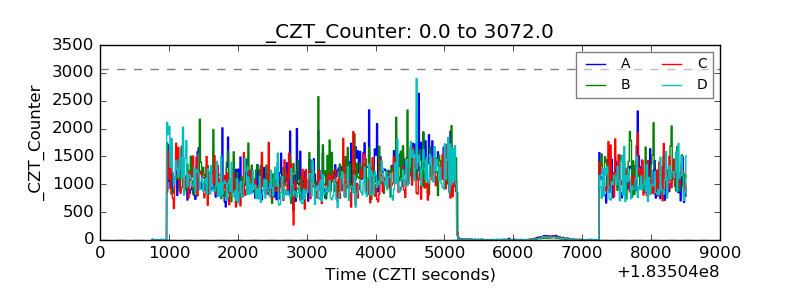 |
| +2.5 Volts monitor |  |
| +5 Volts monitor |  |
| _ROLL_ROT | 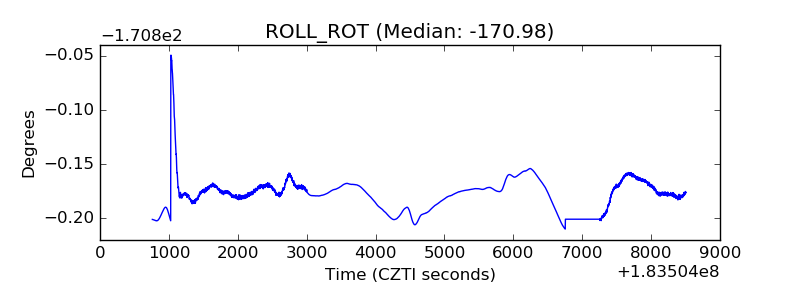 |
| _Roll_DEC | 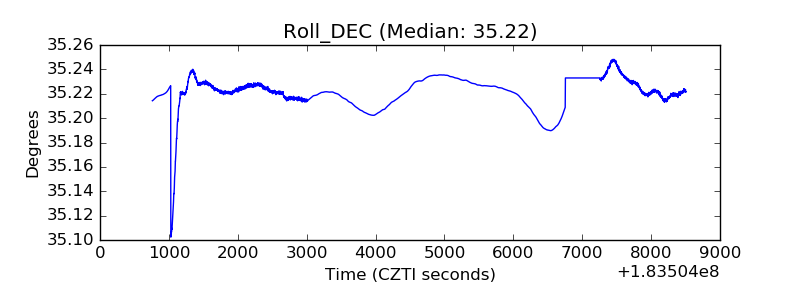 |
| _Roll_RA | 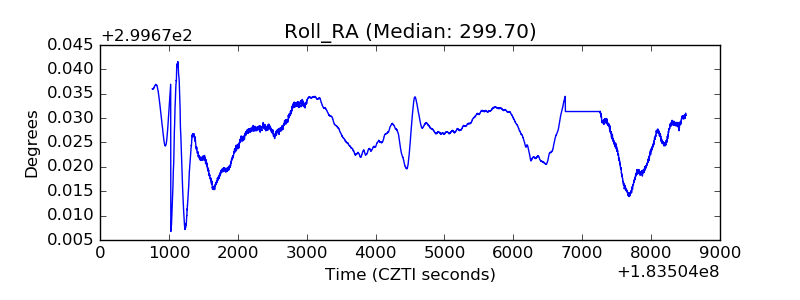 |
| Veto Counter | 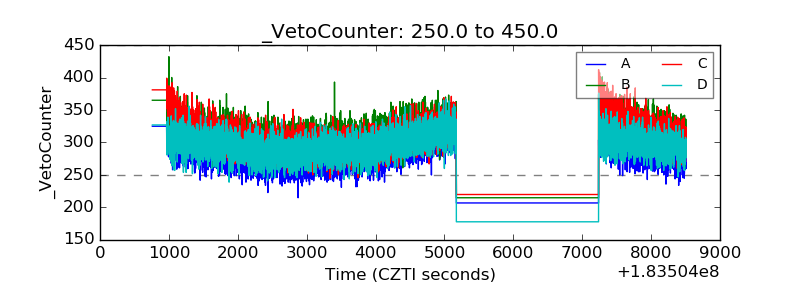 |