| Param | Original file | Final file |
|---|---|---|
| Filename | modeM0/AS1P01_161T03_9000000070_00413cztM0_level2.evt | modeM0/AS1P01_161T03_9000000070_00413cztM0_level2_quad_clean.evt |
| Size (bytes) | 844,928,640 | 38,151,360 |
| Size | 805.8 MB | 36.4 MB |
| Events in quadrant A | 6,561,343 | 195,813 |
| Events in quadrant B | 6,492,633 | 197,283 |
| Events in quadrant C | 6,106,607 | 194,286 |
| Events in quadrant D | 6,067,666 | 187,677 |
| Mode SS | |||
|---|---|---|---|
| Quadrant | BADHDUFLAG | Total packets | Discarded packets |
| A | 0 | 110 | 0 |
| B | 0 | 110 | 0 |
| C | 0 | 110 | 0 |
| D | 0 | 110 | 0 |
| Mode M0 | |||
|---|---|---|---|
| Quadrant | BADHDUFLAG | Total packets | Discarded packets |
| A | 0 | 23313 | 3 |
| B | 0 | 23191 | 2 |
| C | 0 | 22008 | 2 |
| D | 0 | 21884 | 2 |
| Mode M9 | |||
|---|---|---|---|
| Quadrant | BADHDUFLAG | Total packets | Discarded packets |
| A | 0 | 21 | 0 |
| B | 0 | 21 | 0 |
| C | 0 | 21 | 0 |
| D | 0 | 21 | 0 |
| Quadrant | Total seconds | Saturated seconds | Saturation percentage |
|---|---|---|---|
| A | 5420 | 4 | 0.073801% |
| B | 5420 | 2 | 0.036900% |
| C | 5420 | 4 | 0.073801% |
| D | 5420 | 6 | 0.110701% |
Noise dominated data is calculated using 1-second bins in cleaned event files. If a bin has >2000 counts, and if more than 50% of those come from <1% of pixels, then it is considered to be noise-dominated and hence unusable.
| Quadrant | # 1 sec bins | Bins with >0 counts | Bins with >2000 counts | High rate bins dominated by noise | Noise dominated (total time) | Noise dominated (detector-on time) | Marked lightcurve |
|---|---|---|---|---|---|---|---|
| A | 7485 | 5421 | 118 | 118 | 1.58% | 2.18% | 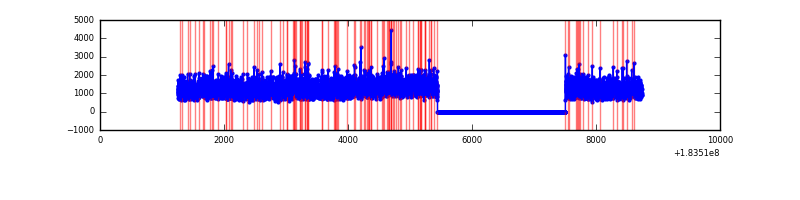 |
| B | 7485 | 5421 | 83 | 83 | 1.11% | 1.53% | 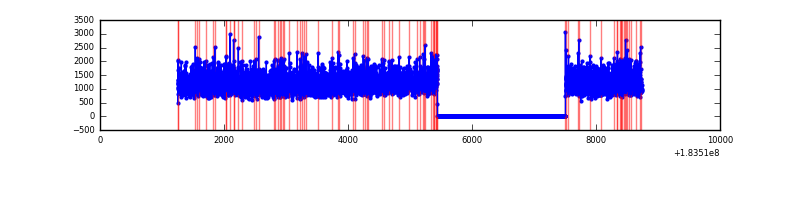 |
| C | 7485 | 5421 | 49 | 49 | 0.65% | 0.90% | 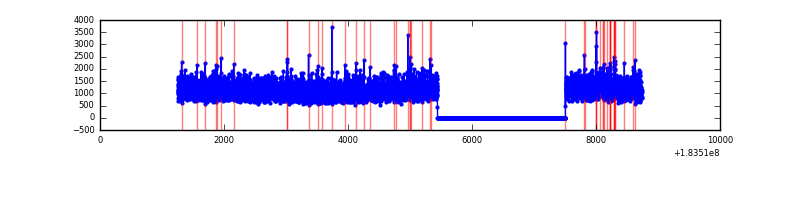 |
| D | 7485 | 5421 | 85 | 85 | 1.14% | 1.57% | 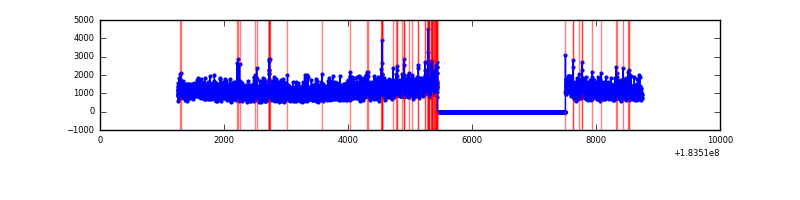 |
Top three noisy pixels from each quadrant. If the there are fewer than three noisy pixels in the level2.evt file, extra rows are filled as -1
| Pixel properties | Quadrant properties | ||||||
|---|---|---|---|---|---|---|---|
| Quadrant | DetID | PixID | Counts | Sigma | Mean | Median | Sigma |
| A | 0 | 238 | 77891 | 205.02 | 1656 | 1642 | 371.9 |
| A | 12 | 133 | 40136 | 103.5 | 1656 | 1642 | 371.9 |
| A | 12 | 243 | 27514 | 69.57 | 1656 | 1642 | 371.9 |
| B | 0 | 220 | 20629 | 48.0 | 1673 | 1687 | 394.6 |
| B | 15 | 82 | 15480 | 34.95 | 1673 | 1687 | 394.6 |
| B | 0 | 230 | 13408 | 29.7 | 1673 | 1687 | 394.6 |
| C | 3 | 159 | 99172 | 229.82 | 1515 | 1571 | 424.7 |
| C | 10 | 38 | 24026 | 52.87 | 1515 | 1571 | 424.7 |
| C | 1 | 1 | 20807 | 45.29 | 1515 | 1571 | 424.7 |
| D | 13 | 221 | 139783 | 304.76 | 1436 | 1489 | 453.8 |
| D | 13 | 7 | 72617 | 156.75 | 1436 | 1489 | 453.8 |
| D | 13 | 216 | 70556 | 152.2 | 1436 | 1489 | 453.8 |
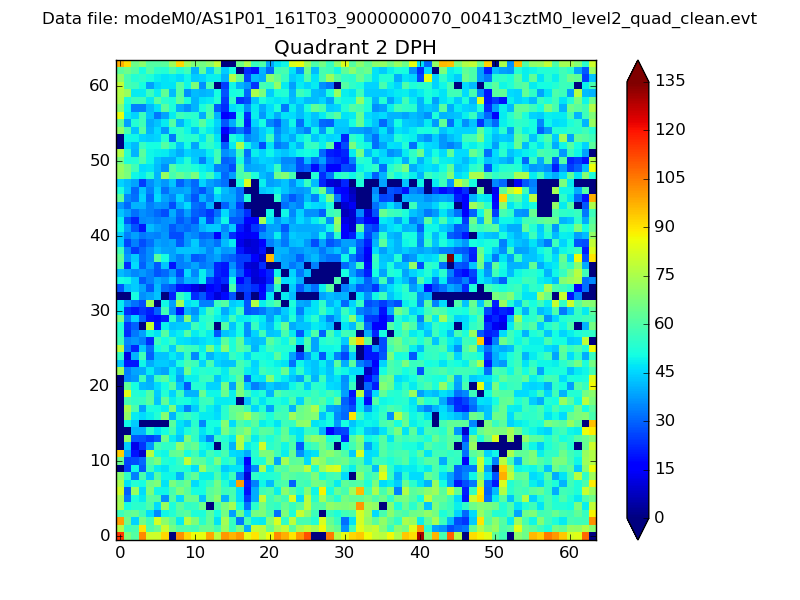
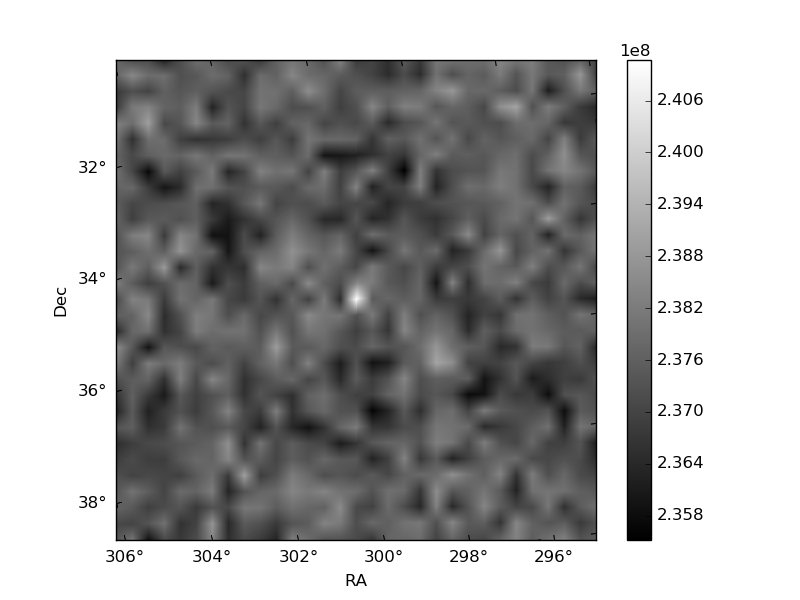
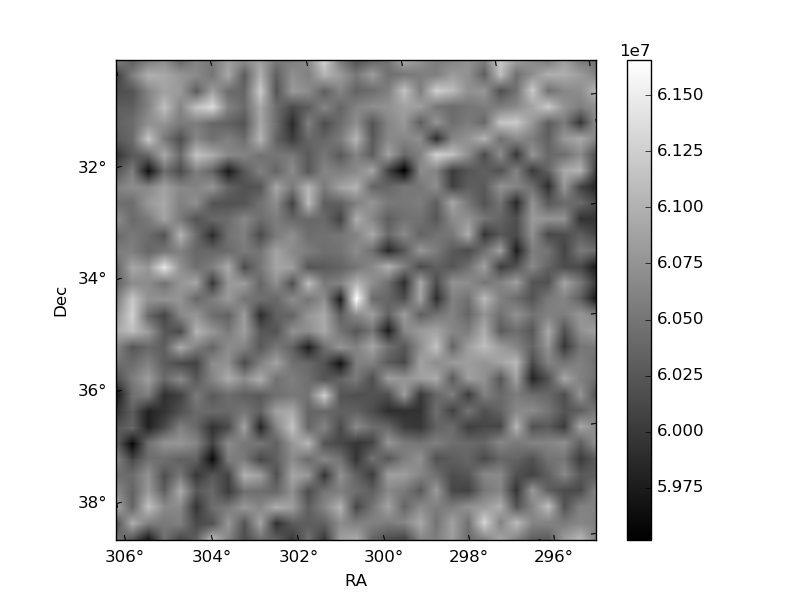
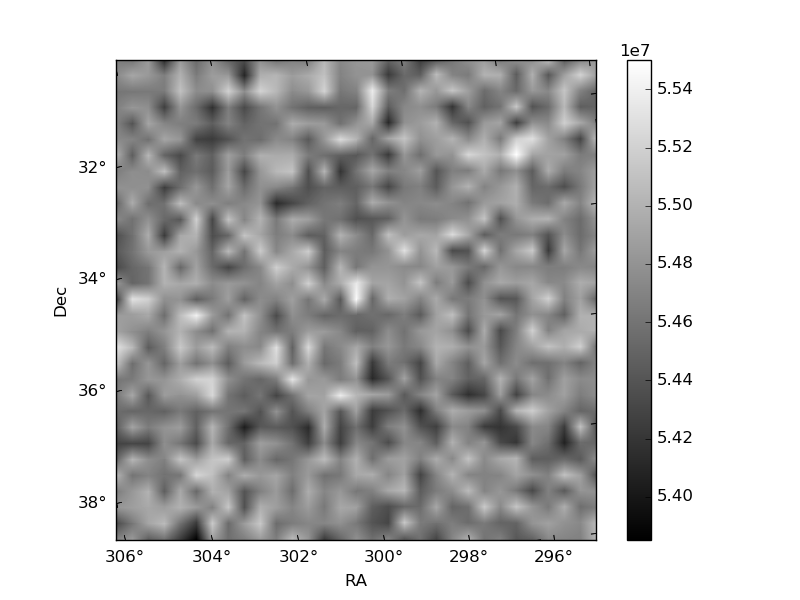
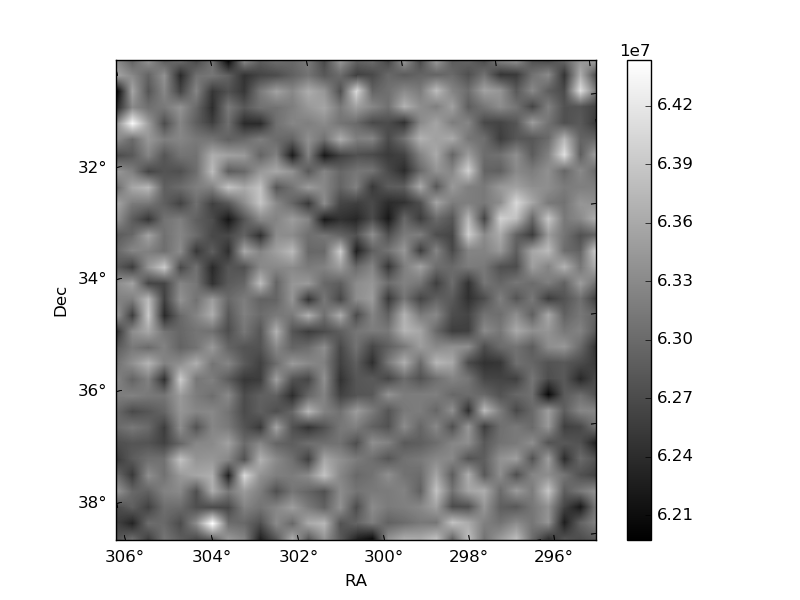
Histogram calculated using DETX and DETY for each event in the final _common_clean file
| Quadrant A | 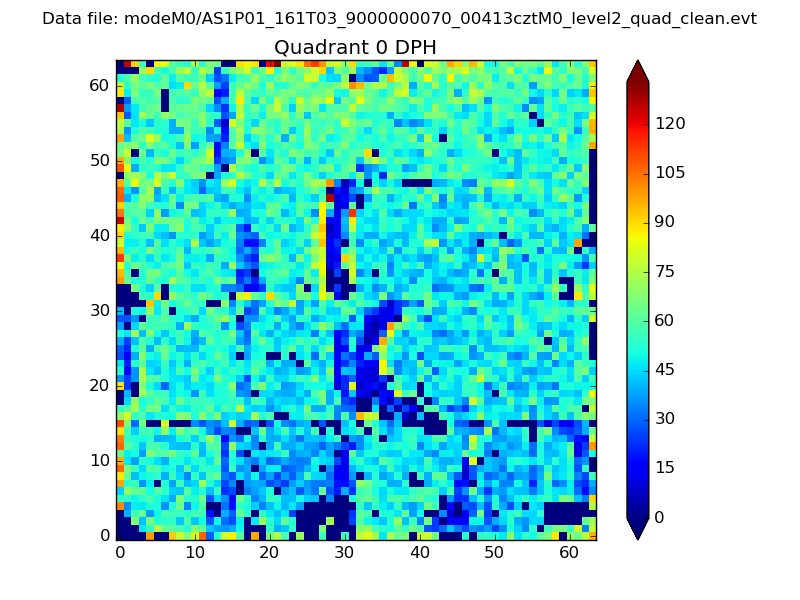 |
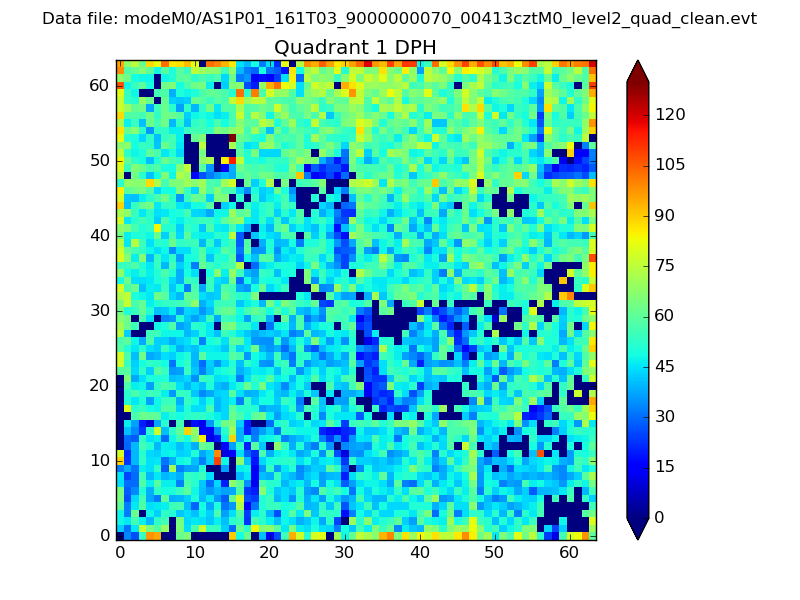 |
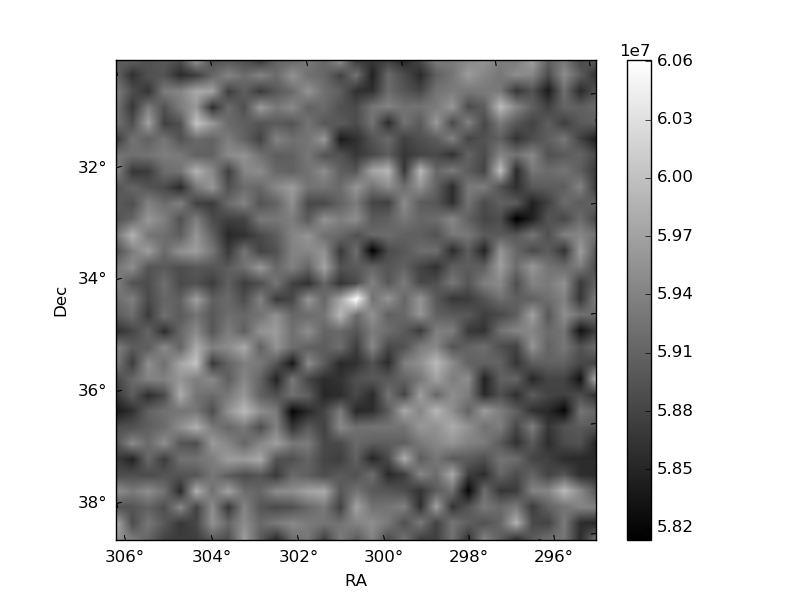
Quadrant B |
|---|---|---|---|
| Quadrant D | 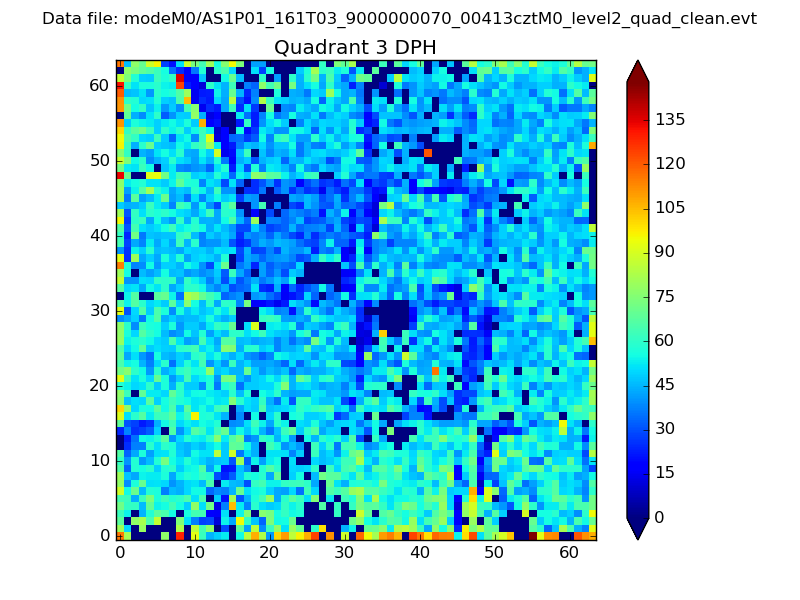 |
 |
Quadrant C |
| Plot type | Count rate plots | Images |
|---|---|---|
| Comparison with Poisson distribution Blue bars denote a histogram of data divided into 1 sec bins. Red curve is a Poisson curve with rate = median count rate of data. |
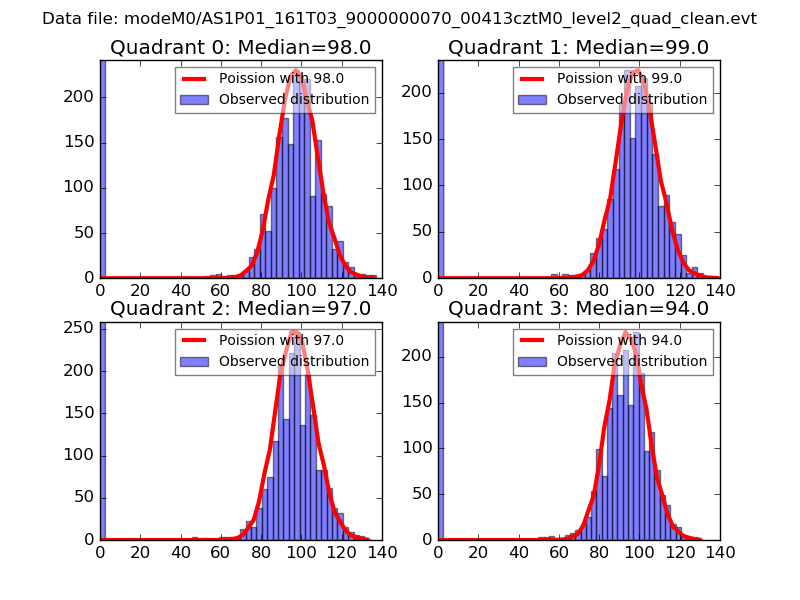 |
 |
| Quadrant-wise count rates Data is divided into 100 sec bins |
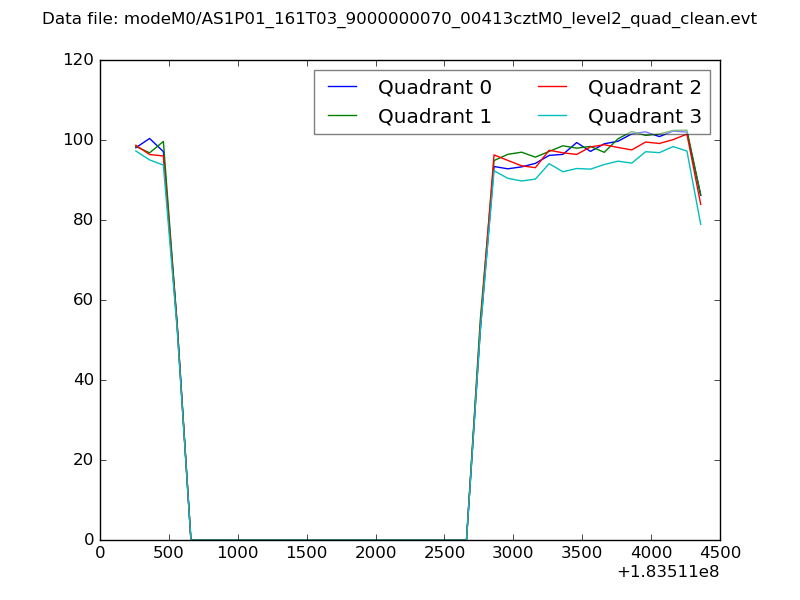 |
|
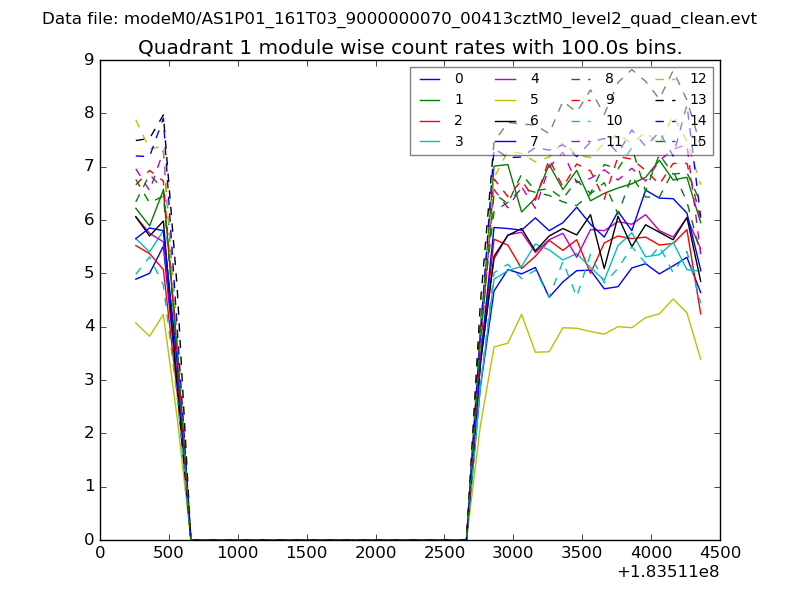
| Module-wise count rates for Quadrant A Data is divided into 100 sec bins |
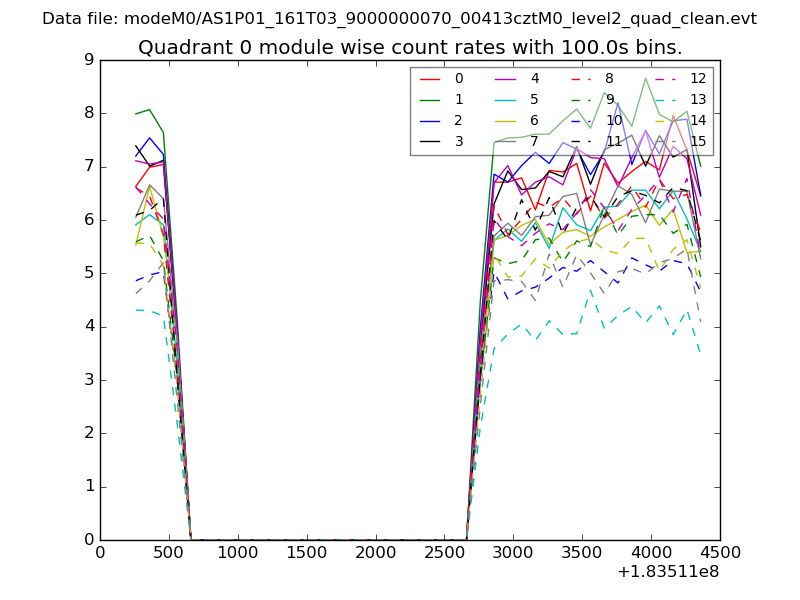 |
 |
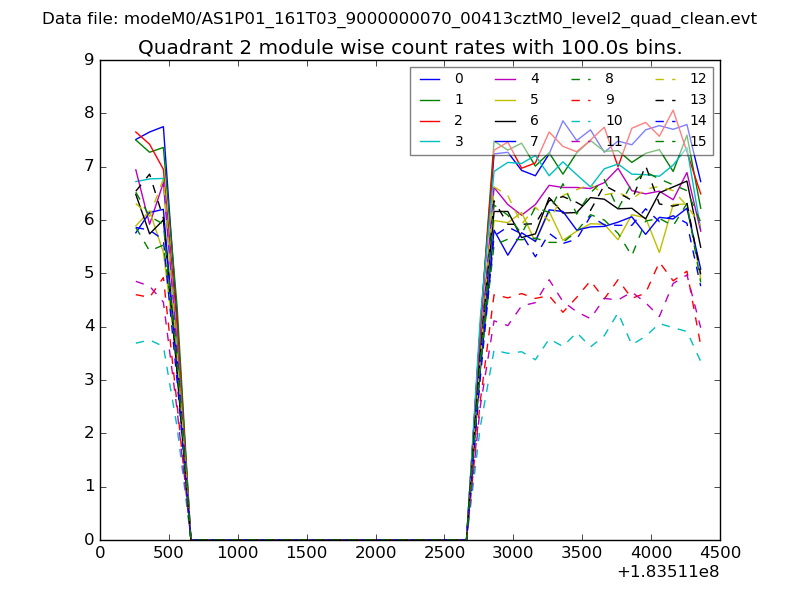
| Module-wise count rates for Quadrant B Data is divided into 100 sec bins |
 |
 |
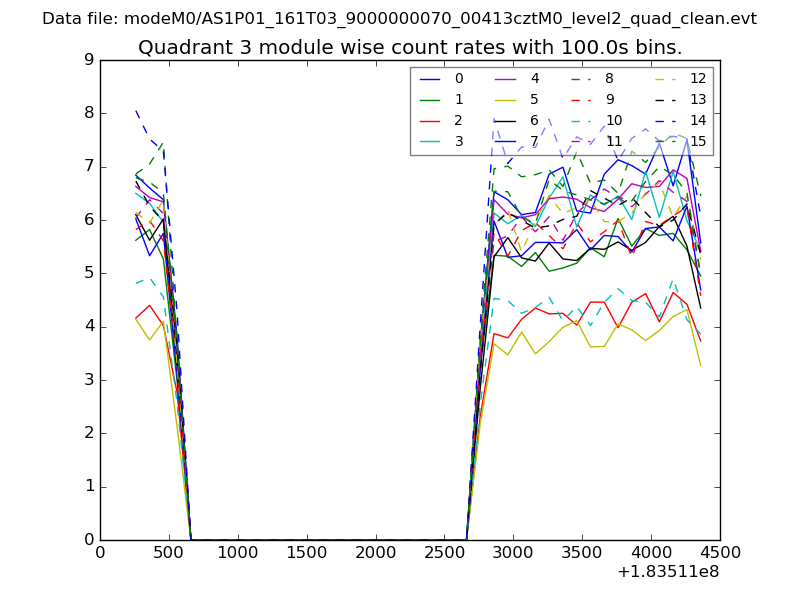
| Module-wise count rates for Quadrant C Data is divided into 100 sec bins |
 |
 |
| Module-wise count rates for Quadrant D Data is divided into 100 sec bins |
 |
 |
| Parameter | Plot |
|---|---|
| CZT HV Monitor | 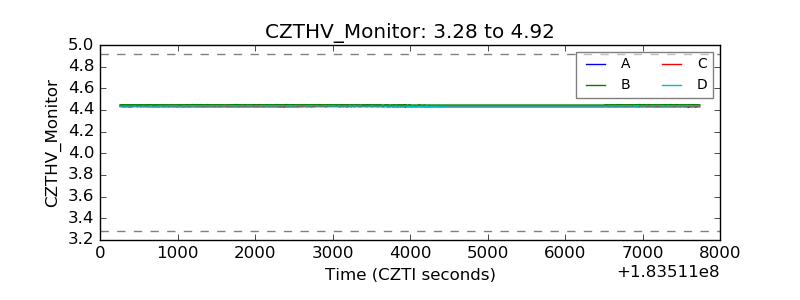 |
| D_VDD | 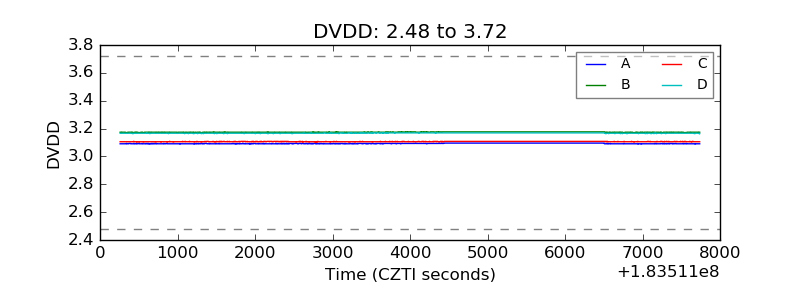 |
| Temperature 1 | 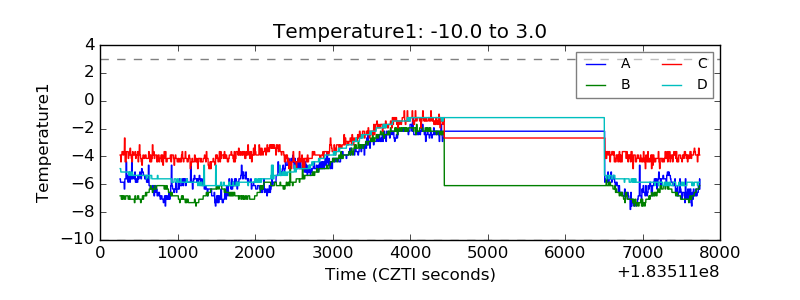 |
| Veto HV Monitor | 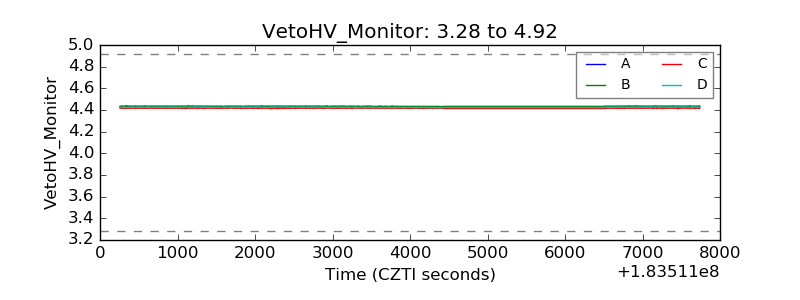 |
| Veto LLD | 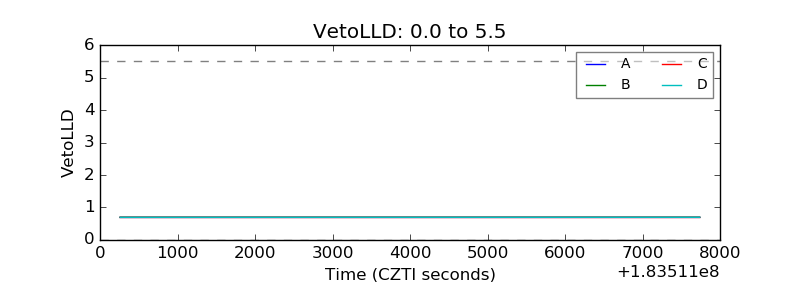 |
| Alpha Counter | 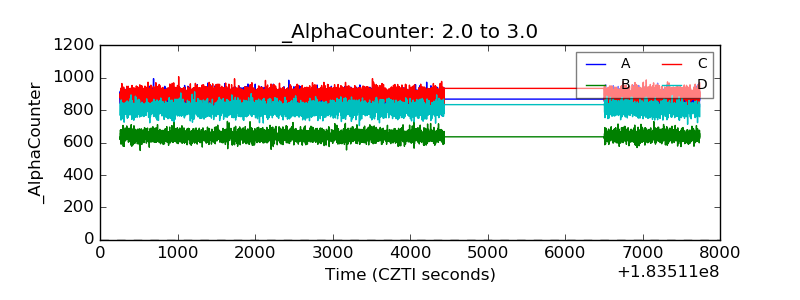 |
| _CPM_Rate | 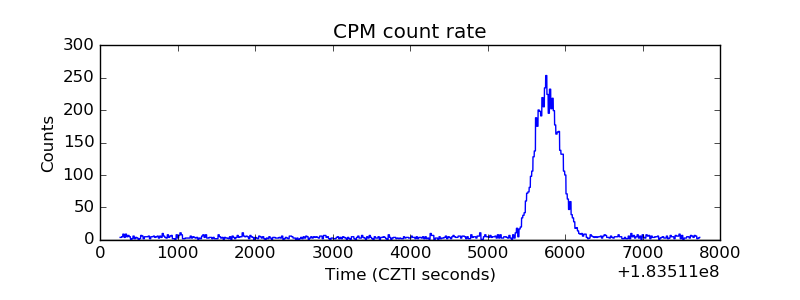 |
| CZT Counter | 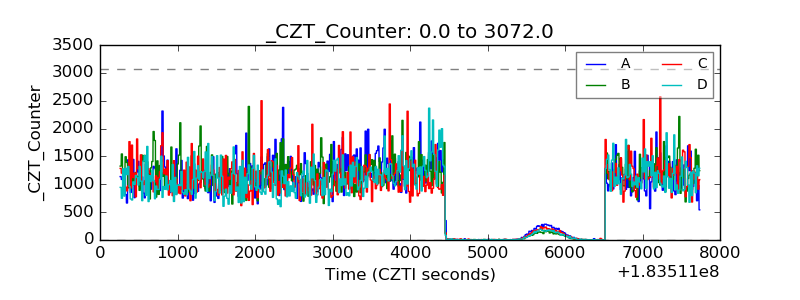 |
| +2.5 Volts monitor | 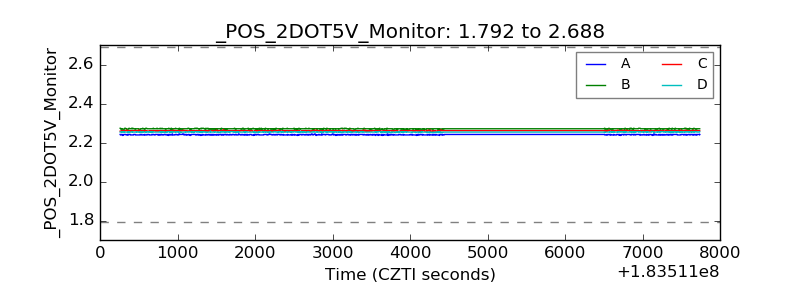 |
| +5 Volts monitor |  |
| _ROLL_ROT | 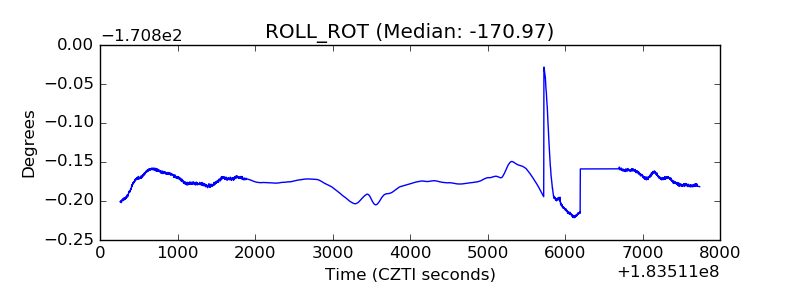 |
| _Roll_DEC | 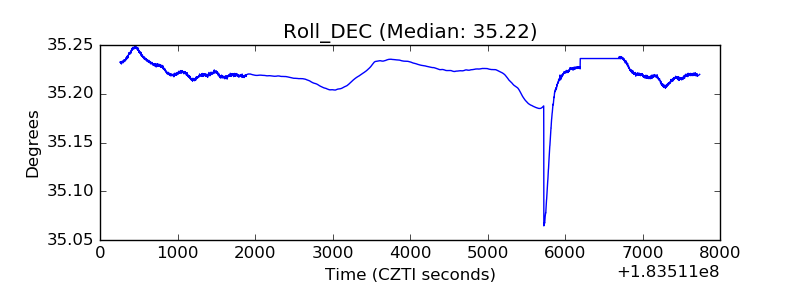 |
| _Roll_RA | 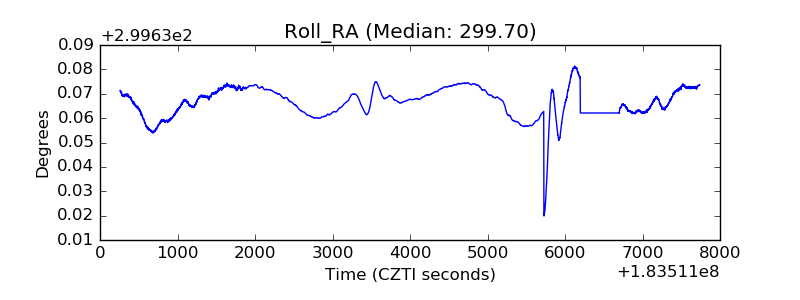 |
| Veto Counter | 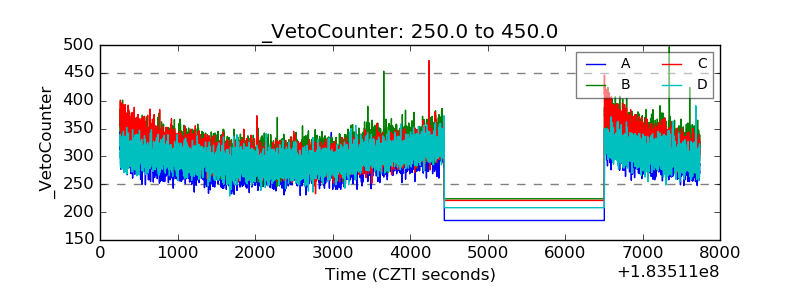 |