| Param | Original file | Final file |
|---|---|---|
| Filename | modeM0/AS1P01_161T03_9000000070_00415cztM0_level2.evt | modeM0/AS1P01_161T03_9000000070_00415cztM0_level2_quad_clean.evt |
| Size (bytes) | 636,528,960 | 41,313,600 |
| Size | 607.0 MB | 39.4 MB |
| Events in quadrant A | 4,855,865 | 246,035 |
| Events in quadrant B | 4,733,392 | 247,168 |
| Events in quadrant C | 4,269,159 | 244,860 |
| Events in quadrant D | 5,154,236 | 232,248 |
| Mode SS | |||
|---|---|---|---|
| Quadrant | BADHDUFLAG | Total packets | Discarded packets |
| A | 0 | 82 | 0 |
| B | 0 | 82 | 0 |
| C | 0 | 82 | 0 |
| D | 0 | 82 | 0 |
| Mode M0 | |||
|---|---|---|---|
| Quadrant | BADHDUFLAG | Total packets | Discarded packets |
| A | 0 | 17235 | 0 |
| B | 0 | 16898 | 0 |
| C | 0 | 15515 | 0 |
| D | 0 | 18141 | 0 |
| Mode M9 | |||
|---|---|---|---|
| Quadrant | BADHDUFLAG | Total packets | Discarded packets |
| A | 0 | 6 | 0 |
| B | 0 | 6 | 0 |
| C | 0 | 6 | 0 |
| D | 0 | 6 | 0 |
| Quadrant | Total seconds | Saturated seconds | Saturation percentage |
|---|---|---|---|
| A | 3967 | 3 | 0.075624% |
| B | 3967 | 0 | 0.000000% |
| C | 3967 | 0 | 0.000000% |
| D | 3967 | 59 | 1.487270% |
Noise dominated data is calculated using 1-second bins in cleaned event files. If a bin has >2000 counts, and if more than 50% of those come from <1% of pixels, then it is considered to be noise-dominated and hence unusable.
| Quadrant | # 1 sec bins | Bins with >0 counts | Bins with >2000 counts | High rate bins dominated by noise | Noise dominated (total time) | Noise dominated (detector-on time) | Marked lightcurve |
|---|---|---|---|---|---|---|---|
| A | 3967 | 3967 | 86 | 86 | 2.17% | 2.17% | 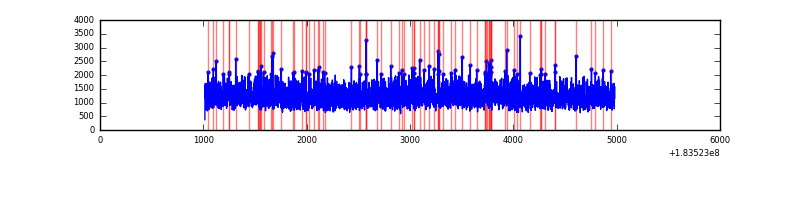 |
| B | 3967 | 3967 | 54 | 54 | 1.36% | 1.36% | 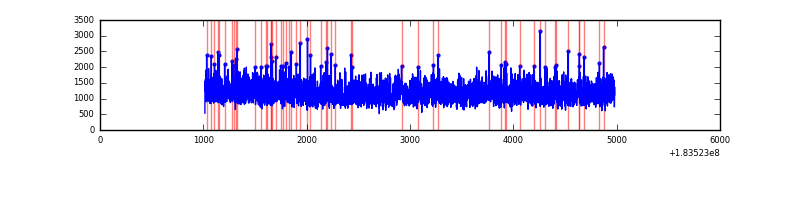 |
| C | 3967 | 3967 | 22 | 22 | 0.55% | 0.55% | 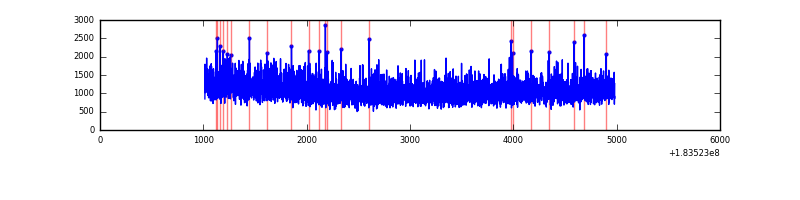 |
| D | 3967 | 3967 | 358 | 358 | 9.02% | 9.02% | 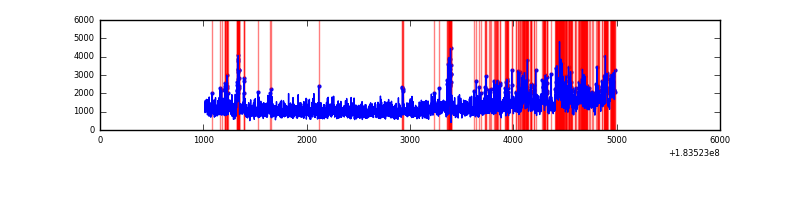 |
Top three noisy pixels from each quadrant. If the there are fewer than three noisy pixels in the level2.evt file, extra rows are filled as -1
| Pixel properties | Quadrant properties | ||||||
|---|---|---|---|---|---|---|---|
| Quadrant | DetID | PixID | Counts | Sigma | Mean | Median | Sigma |
| A | 0 | 238 | 47528 | 165.34 | 1239 | 1228 | 280.0 |
| A | 15 | 4 | 8830 | 27.15 | 1239 | 1228 | 280.0 |
| A | 12 | 243 | 7440 | 22.18 | 1239 | 1228 | 280.0 |
| B | 0 | 23 | 22615 | 74.1 | 1211 | 1219 | 288.7 |
| B | 2 | 253 | 13831 | 43.68 | 1211 | 1219 | 288.7 |
| B | 4 | 184 | 13258 | 41.7 | 1211 | 1219 | 288.7 |
| C | 1 | 1 | 6994 | 19.32 | 1084 | 1123 | 303.9 |
| C | 9 | 241 | 3470 | 7.72 | 1084 | 1123 | 303.9 |
| C | 9 | 206 | 3160 | 6.7 | 1084 | 1123 | 303.9 |
| D | 13 | 7 | 519734 | 1558.06 | 1060 | 1101 | 332.9 |
| D | 13 | 221 | 204390 | 610.72 | 1060 | 1101 | 332.9 |
| D | 1 | 5 | 160303 | 478.27 | 1060 | 1101 | 332.9 |
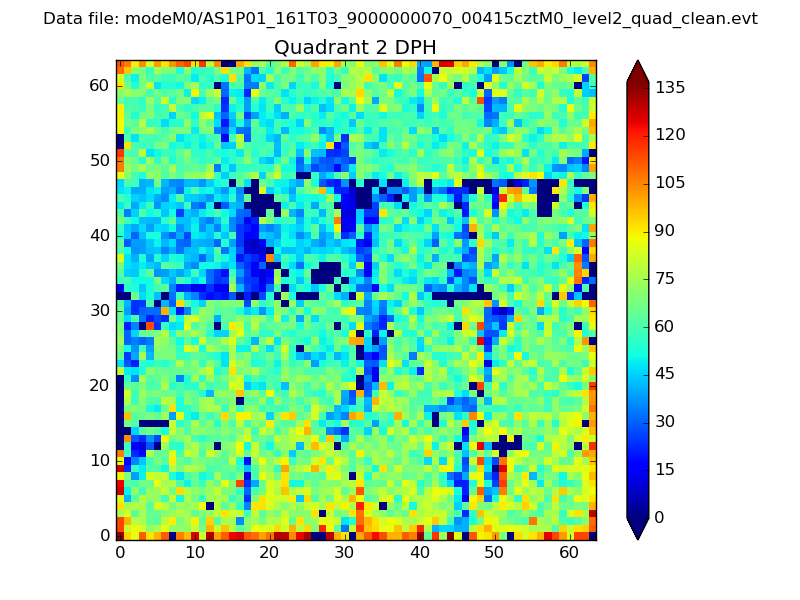
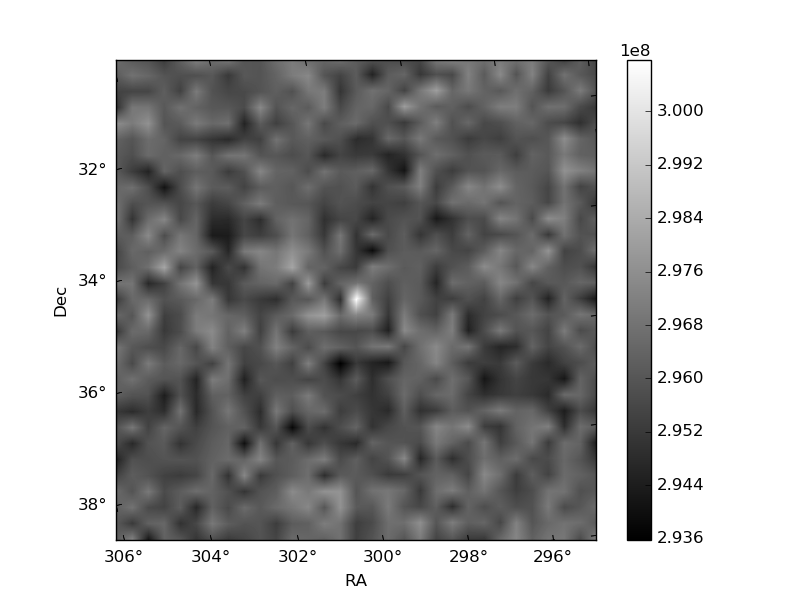
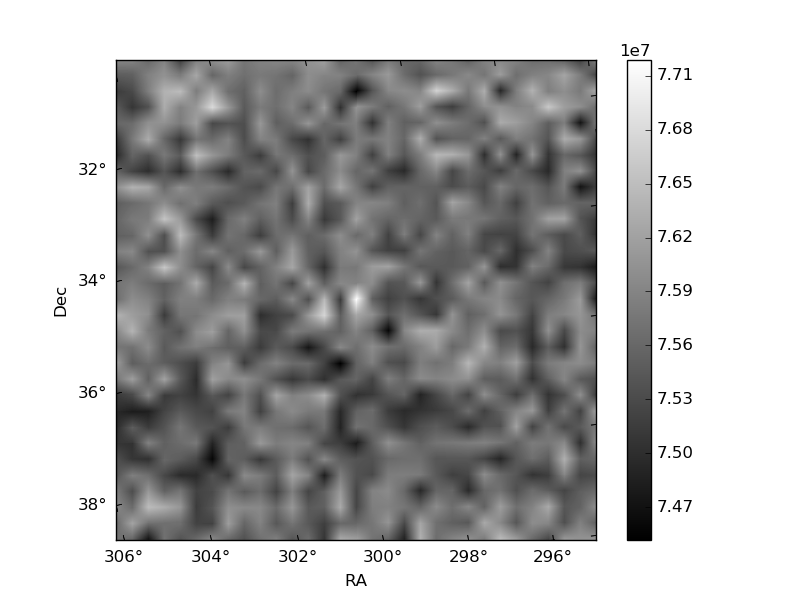
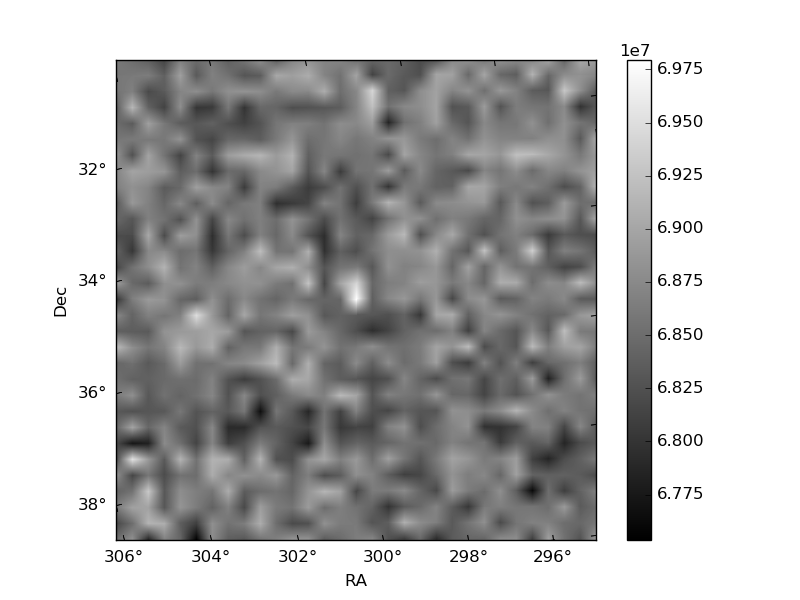
Histogram calculated using DETX and DETY for each event in the final _common_clean file
| Quadrant A | 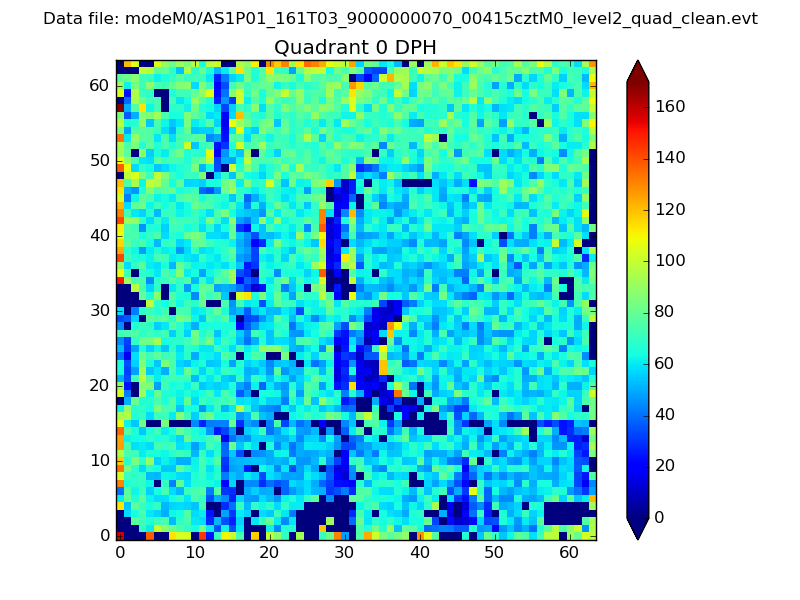 |
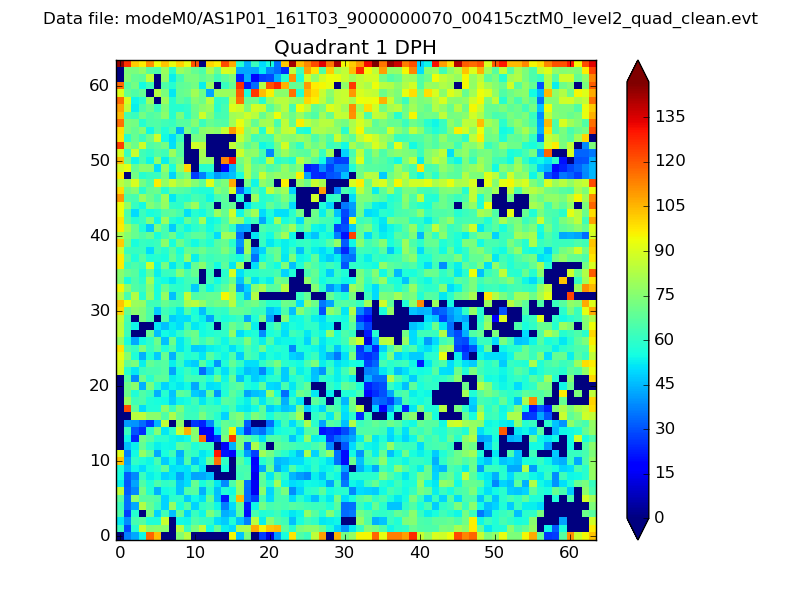 |
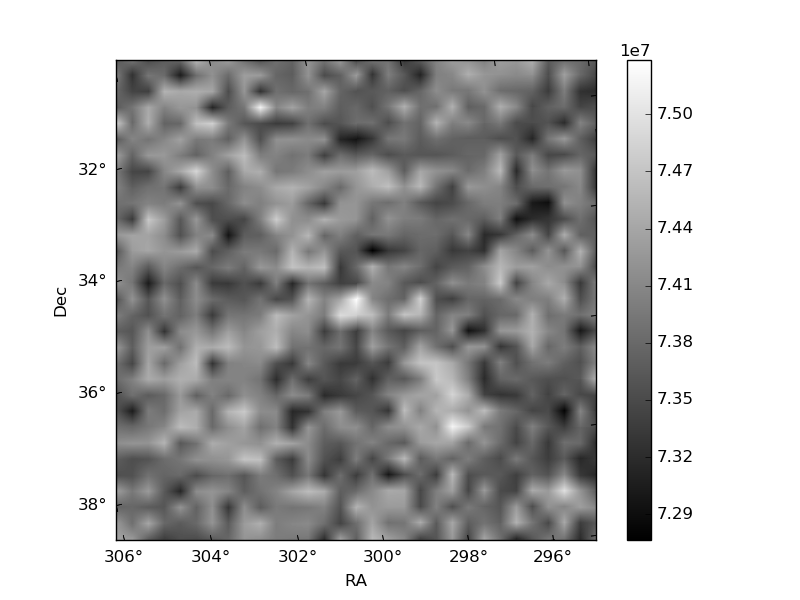
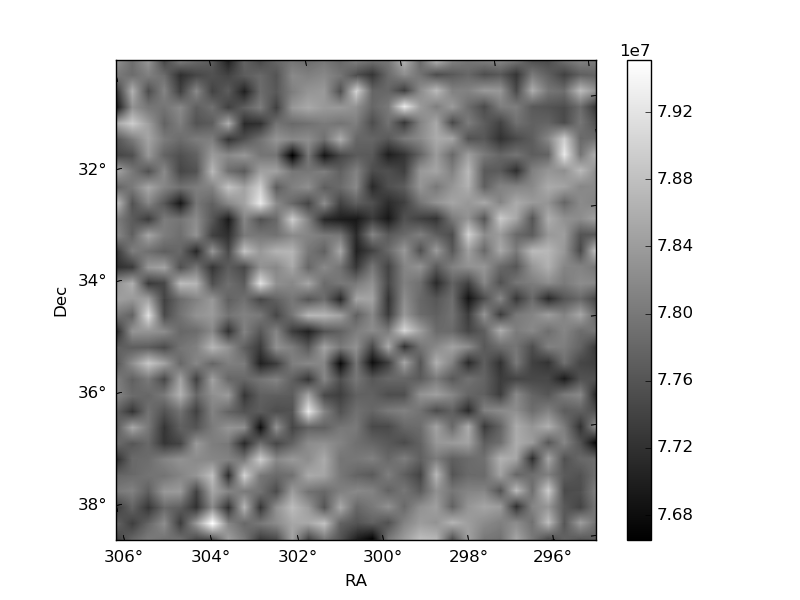
Quadrant B |
|---|---|---|---|
| Quadrant D | 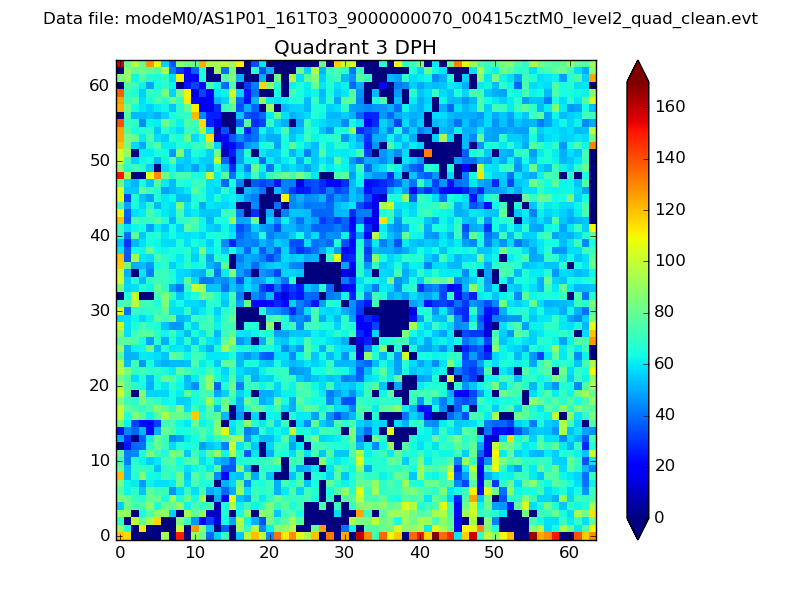 |
 |
Quadrant C |
| Plot type | Count rate plots | Images |
|---|---|---|
| Comparison with Poisson distribution Blue bars denote a histogram of data divided into 1 sec bins. Red curve is a Poisson curve with rate = median count rate of data. |
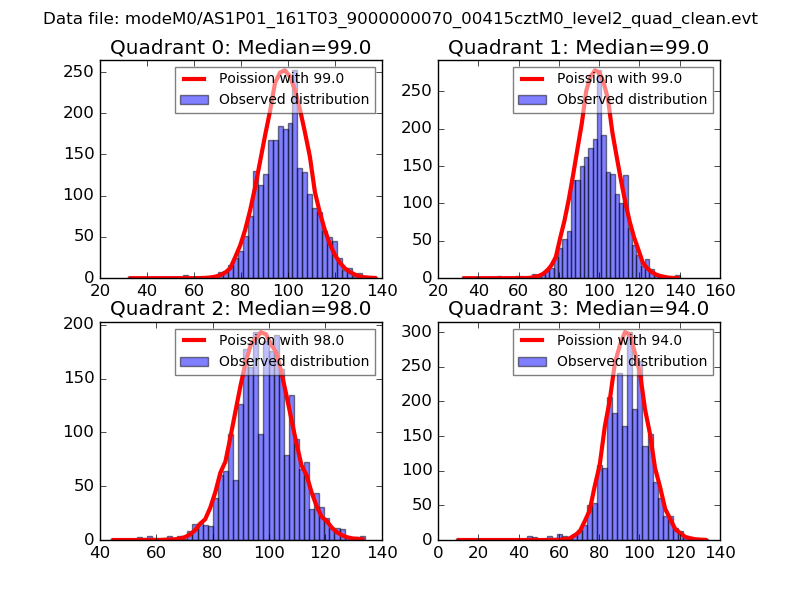 |
 |
| Quadrant-wise count rates Data is divided into 100 sec bins |
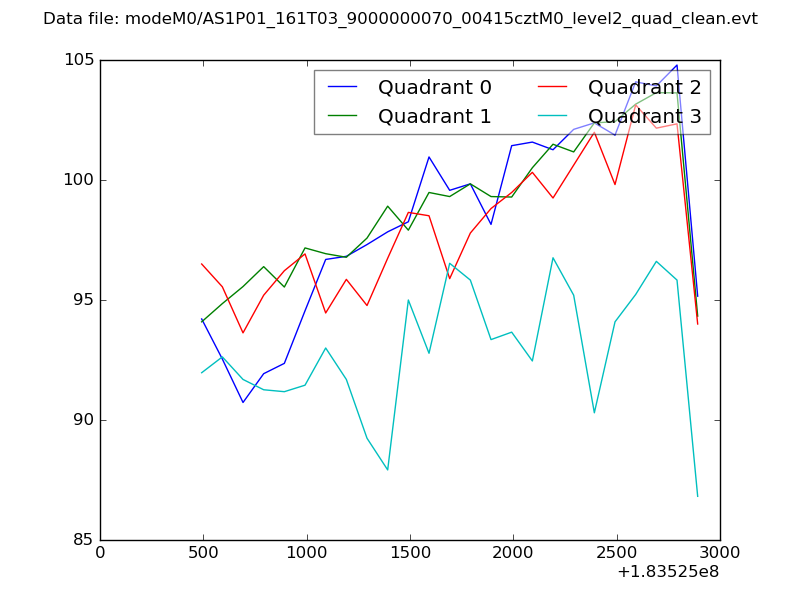 |
|
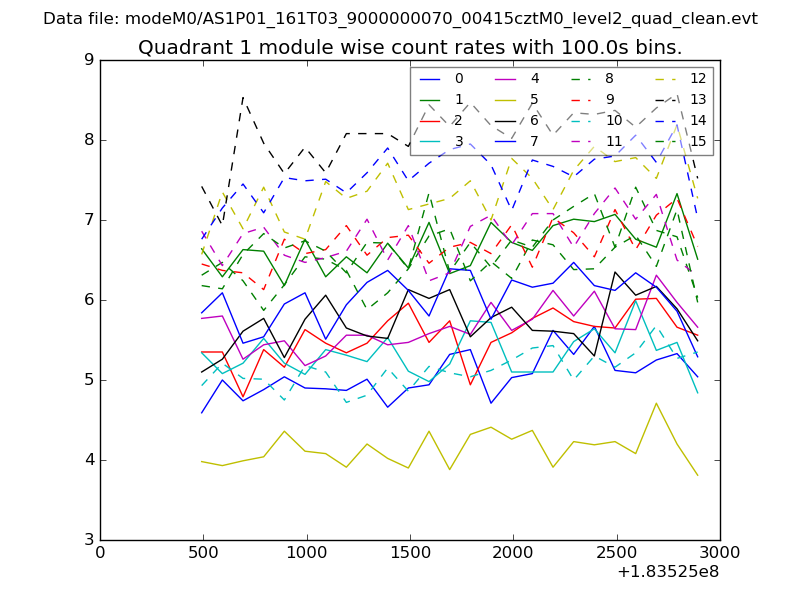
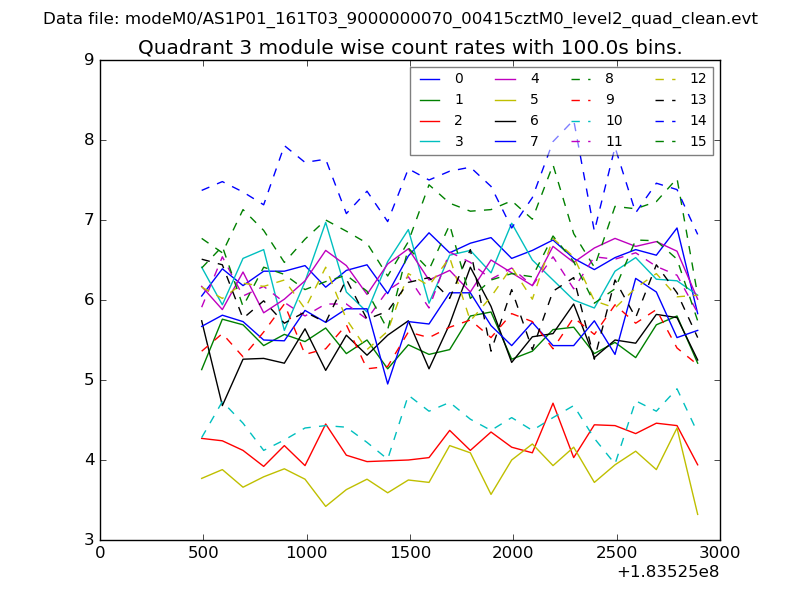
| Module-wise count rates for Quadrant A Data is divided into 100 sec bins |
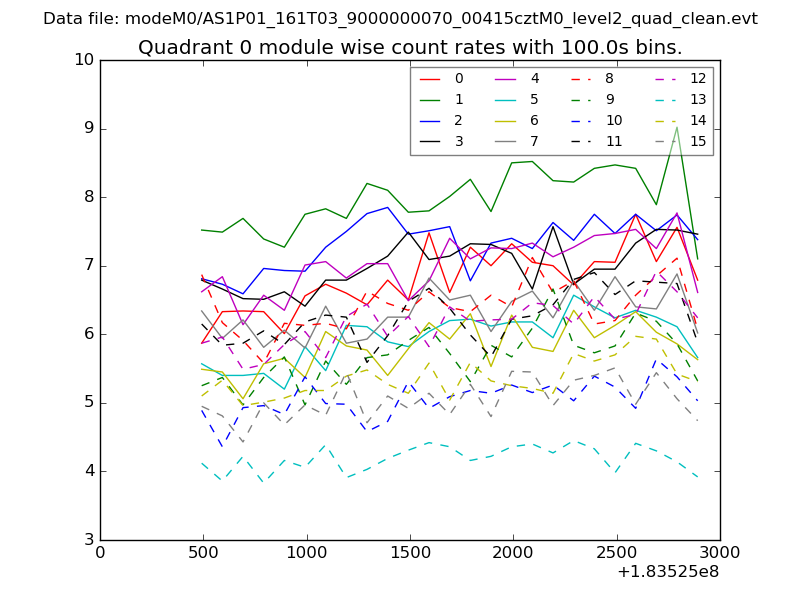 |
 |
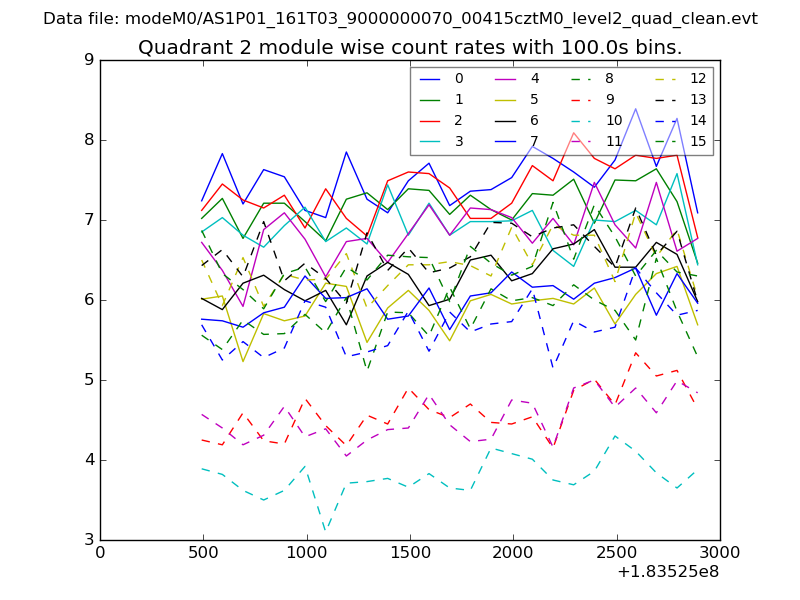
| Module-wise count rates for Quadrant B Data is divided into 100 sec bins |
 |
 |
| Module-wise count rates for Quadrant C Data is divided into 100 sec bins |
 |
 |
| Module-wise count rates for Quadrant D Data is divided into 100 sec bins |
 |
 |
| Parameter | Plot |
|---|---|
| CZT HV Monitor | 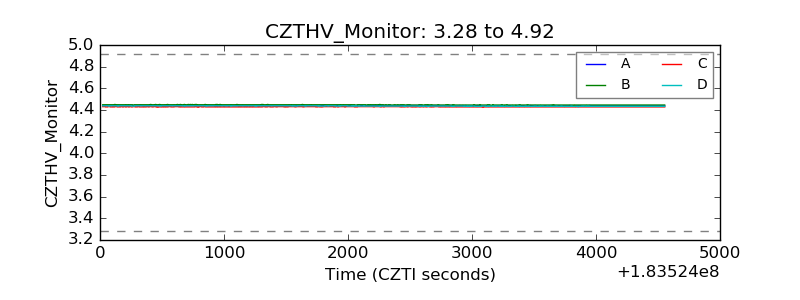 |
| D_VDD | 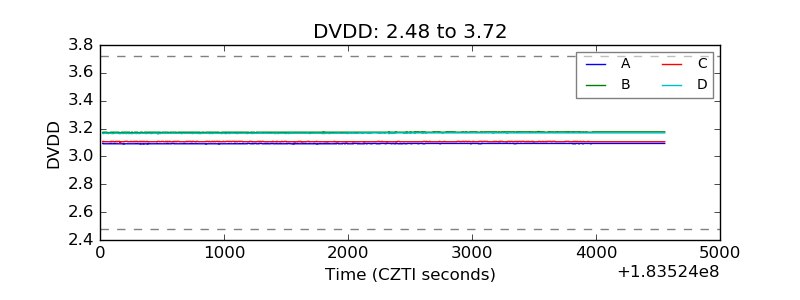 |
| Temperature 1 | 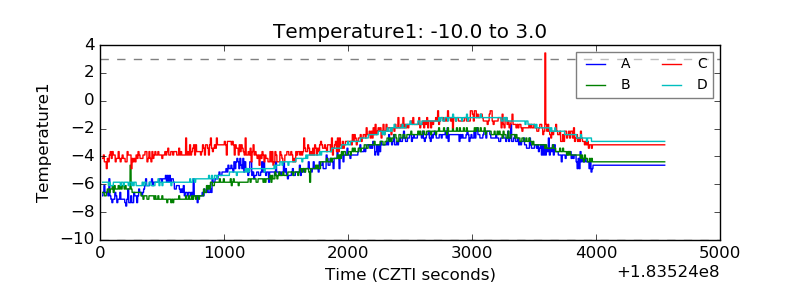 |
| Veto HV Monitor | 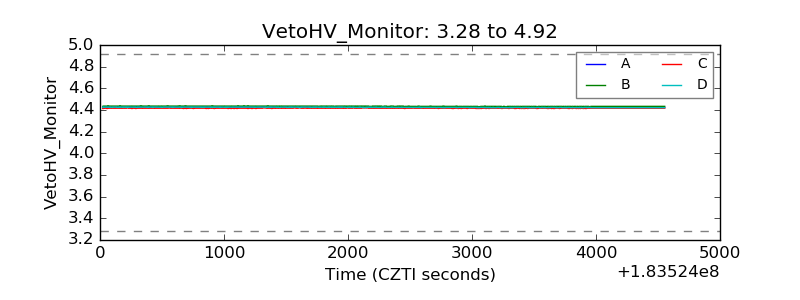 |
| Veto LLD | 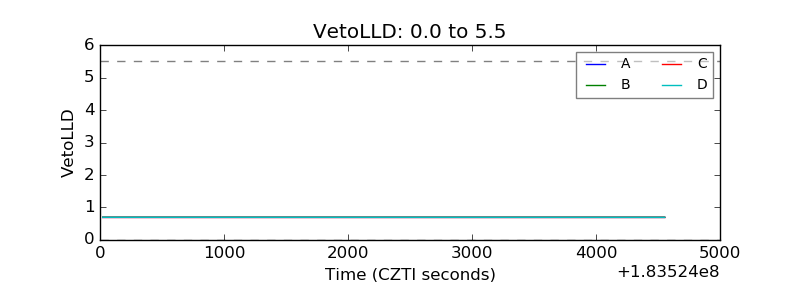 |
| Alpha Counter | 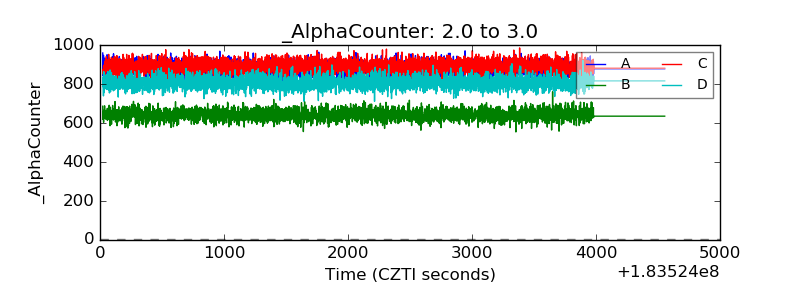 |
| _CPM_Rate | 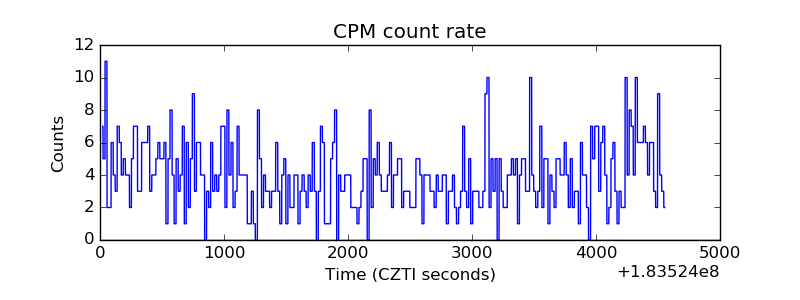 |
| CZT Counter | 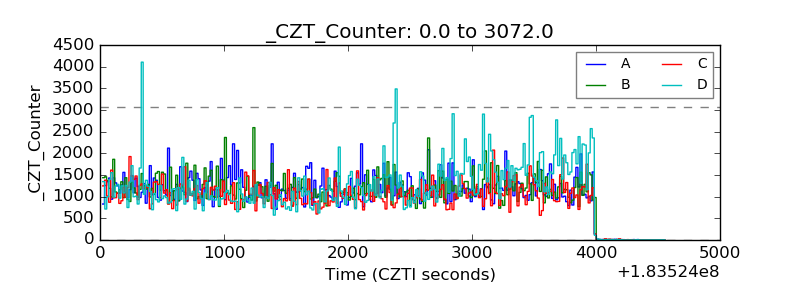 |
| +2.5 Volts monitor | 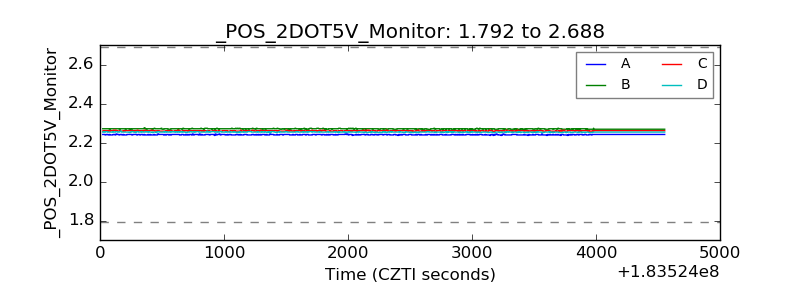 |
| +5 Volts monitor |  |
| _ROLL_ROT | 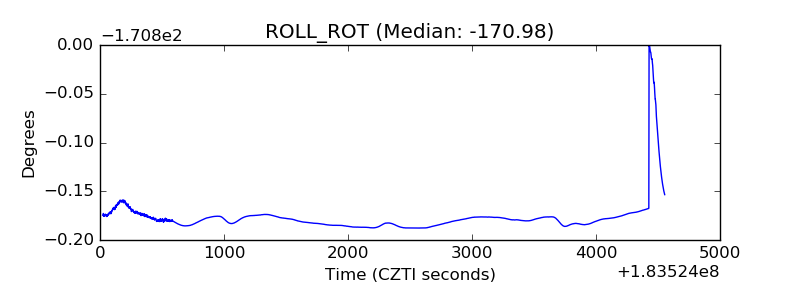 |
| _Roll_DEC |  |
| _Roll_RA | 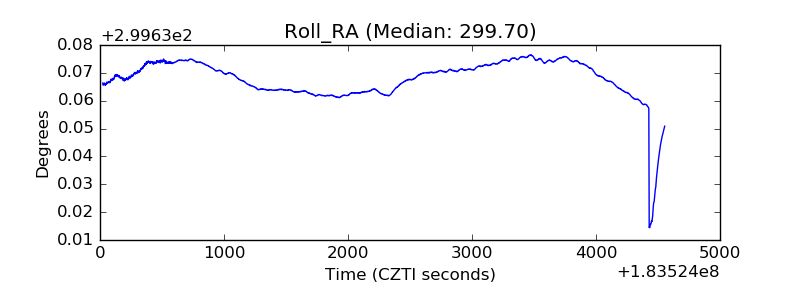 |
| Veto Counter | 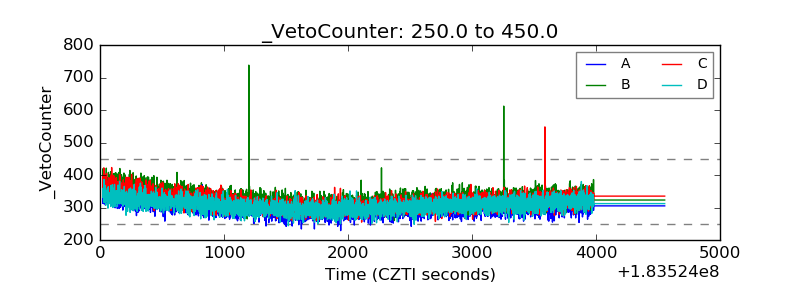 |