| Param | Original file | Final file |
|---|---|---|
| Filename | modeM0/AS1P01_044T01_9000000072_00421cztM0_level2.evt | modeM0/AS1P01_044T01_9000000072_00421cztM0_level2_quad_clean.evt |
| Size (bytes) | 801,570,240 | 72,717,120 |
| Size | 764.4 MB | 69.3 MB |
| Events in quadrant A | 6,226,652 | 463,063 |
| Events in quadrant B | 6,079,291 | 468,800 |
| Events in quadrant C | 5,403,695 | 464,128 |
| Events in quadrant D | 6,226,206 | 447,996 |
| Mode M9 | |||
|---|---|---|---|
| Quadrant | BADHDUFLAG | Total packets | Discarded packets |
| A | 0 | 30 | 0 |
| B | 0 | 30 | 0 |
| C | 0 | 30 | 0 |
| D | 0 | 31 | 0 |
| Mode M0 | |||
|---|---|---|---|
| Quadrant | BADHDUFLAG | Total packets | Discarded packets |
| A | 0 | 22089 | 3 |
| B | 0 | 21673 | 2 |
| C | 0 | 19688 | 2 |
| D | 0 | 22149 | 2 |
| Mode SS | |||
|---|---|---|---|
| Quadrant | BADHDUFLAG | Total packets | Discarded packets |
| A | 0 | 104 | 0 |
| B | 0 | 104 | 0 |
| C | 0 | 104 | 0 |
| D | 0 | 104 | 0 |
| Quadrant | Total seconds | Saturated seconds | Saturation percentage |
|---|---|---|---|
| A | 5107 | 9 | 0.176229% |
| B | 5107 | 5 | 0.097905% |
| C | 5107 | 3 | 0.058743% |
| D | 5107 | 38 | 0.744077% |
Noise dominated data is calculated using 1-second bins in cleaned event files. If a bin has >2000 counts, and if more than 50% of those come from <1% of pixels, then it is considered to be noise-dominated and hence unusable.
| Quadrant | # 1 sec bins | Bins with >0 counts | Bins with >2000 counts | High rate bins dominated by noise | Noise dominated (total time) | Noise dominated (detector-on time) | Marked lightcurve |
|---|---|---|---|---|---|---|---|
| A | 7172 | 5108 | 134 | 134 | 1.87% | 2.62% | 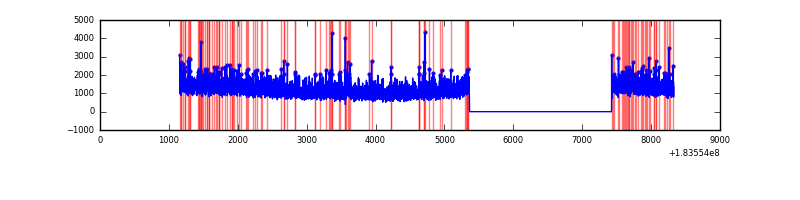 |
| B | 7172 | 5108 | 76 | 76 | 1.06% | 1.49% | 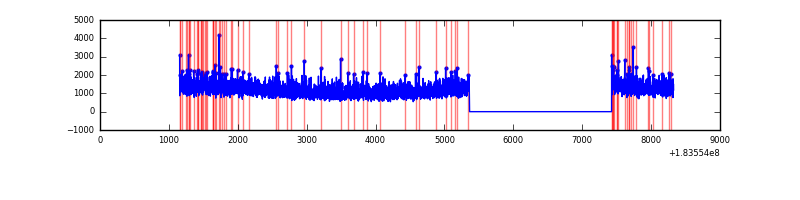 |
| C | 7172 | 5108 | 43 | 43 | 0.60% | 0.84% | 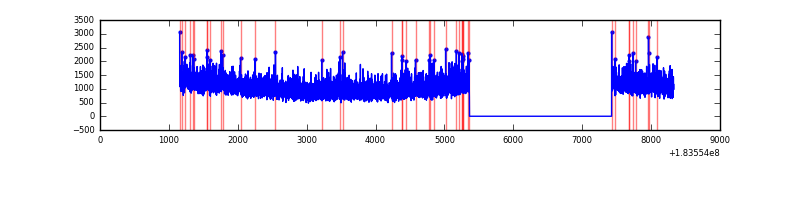 |
| D | 7172 | 5108 | 273 | 273 | 3.81% | 5.34% | 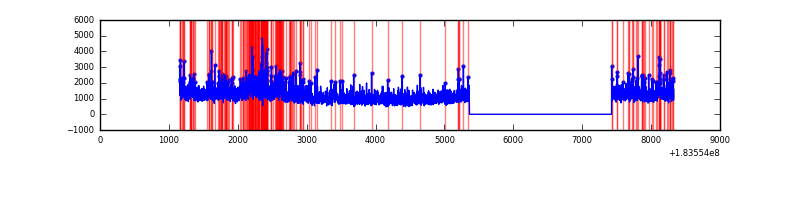 |
Top three noisy pixels from each quadrant. If the there are fewer than three noisy pixels in the level2.evt file, extra rows are filled as -1
| Pixel properties | Quadrant properties | ||||||
|---|---|---|---|---|---|---|---|
| Quadrant | DetID | PixID | Counts | Sigma | Mean | Median | Sigma |
| A | 0 | 238 | 105355 | 300.24 | 1558 | 1549 | 345.7 |
| A | 12 | 243 | 74402 | 210.72 | 1558 | 1549 | 345.7 |
| A | 15 | 4 | 8021 | 18.72 | 1558 | 1549 | 345.7 |
| B | 2 | 32 | 26327 | 68.22 | 1542 | 1553 | 363.2 |
| B | 15 | 185 | 22670 | 58.15 | 1542 | 1553 | 363.2 |
| B | 8 | 4 | 18533 | 46.76 | 1542 | 1553 | 363.2 |
| C | 9 | 206 | 36393 | 91.85 | 1356 | 1400 | 381.0 |
| C | 9 | 85 | 13423 | 31.56 | 1356 | 1400 | 381.0 |
| C | 0 | 207 | 9929 | 22.39 | 1356 | 1400 | 381.0 |
| D | 13 | 7 | 552121 | 1323.04 | 1328 | 1376 | 416.3 |
| D | 1 | 5 | 104334 | 247.33 | 1328 | 1376 | 416.3 |
| D | 1 | 4 | 84897 | 200.64 | 1328 | 1376 | 416.3 |
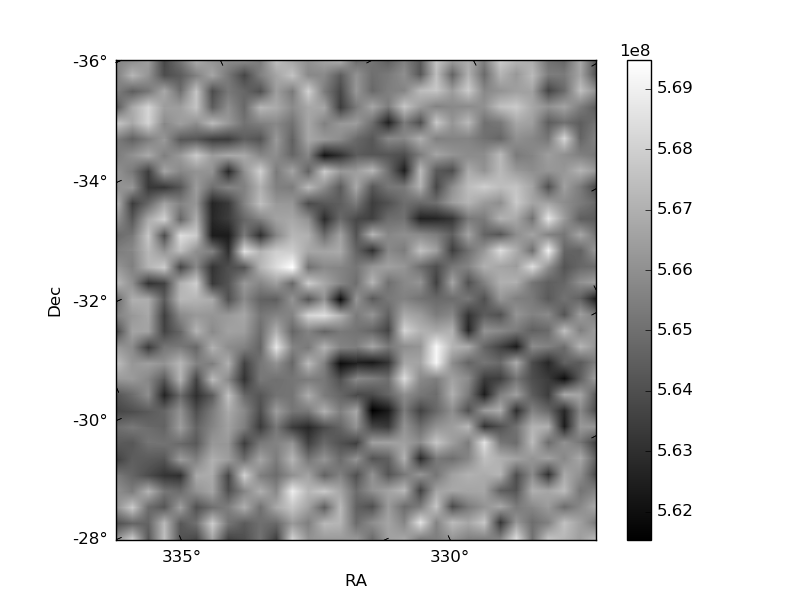
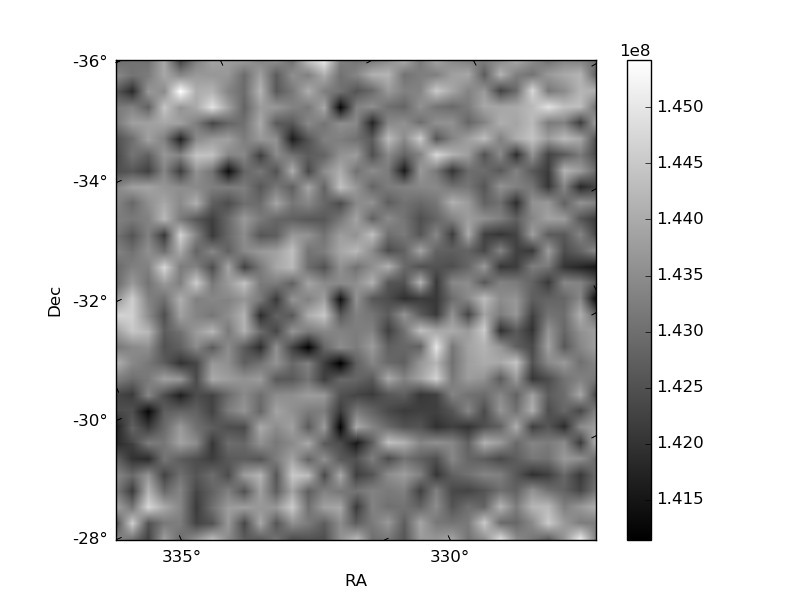
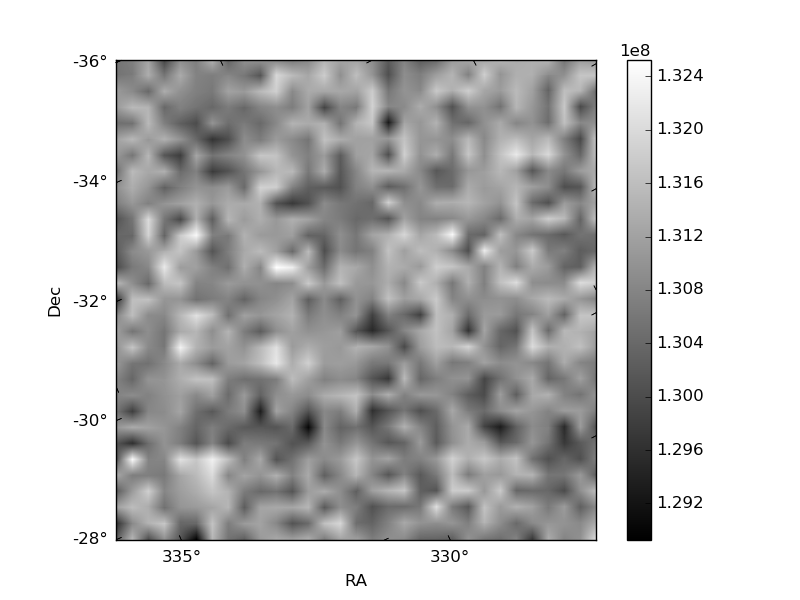
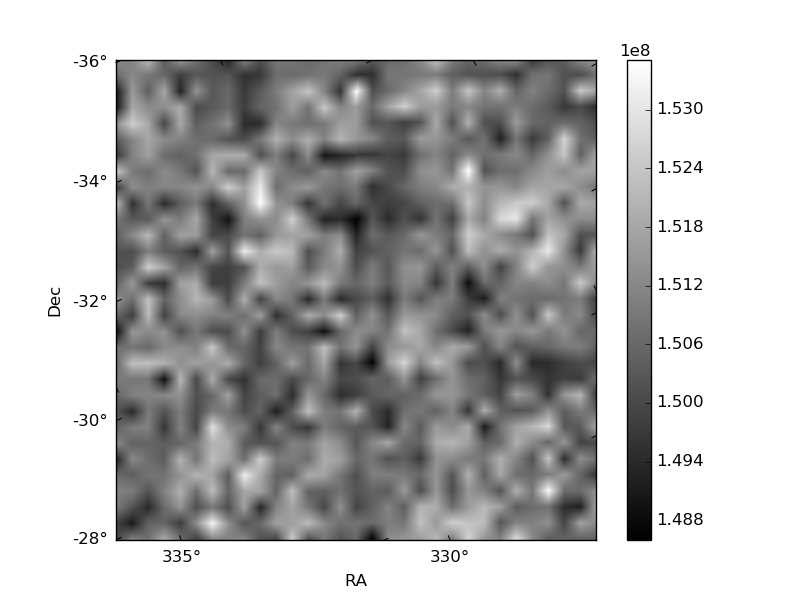
Histogram calculated using DETX and DETY for each event in the final _common_clean file
| Quadrant A | 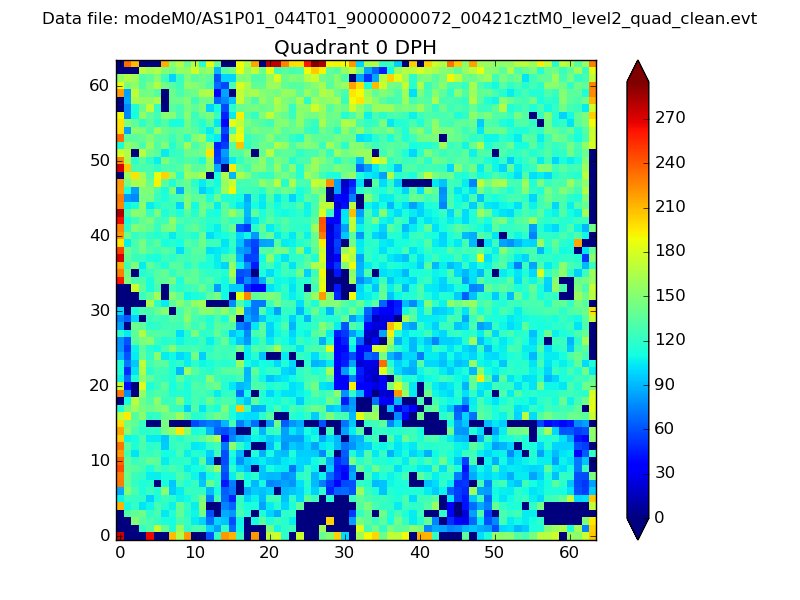 |
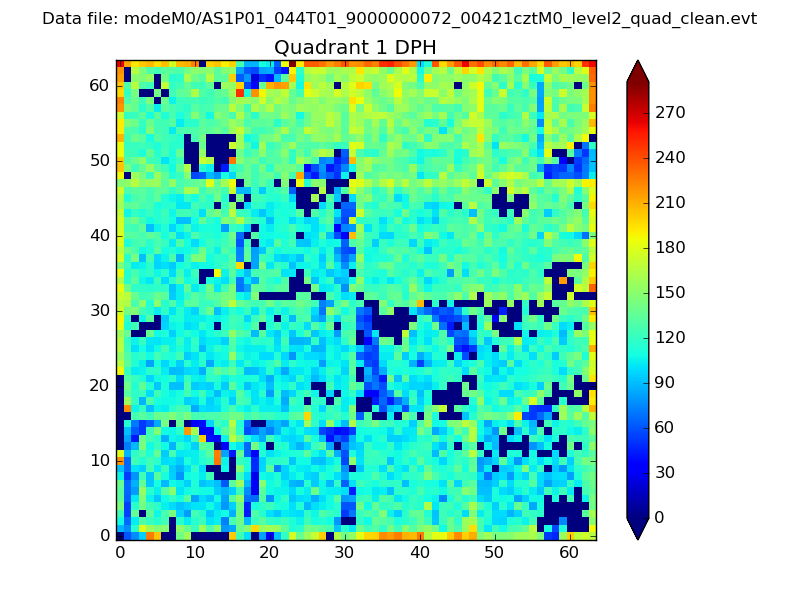 |
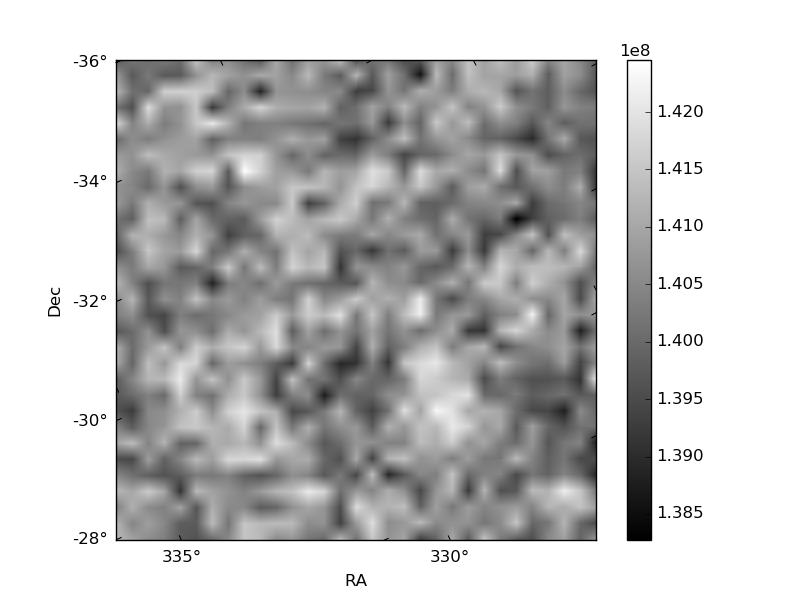
Quadrant B |
|---|---|---|---|
| Quadrant D | 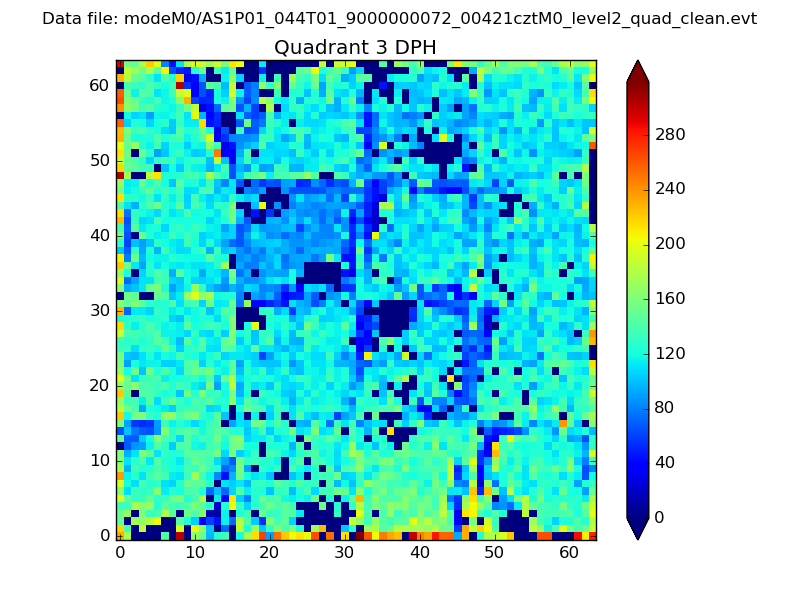 |
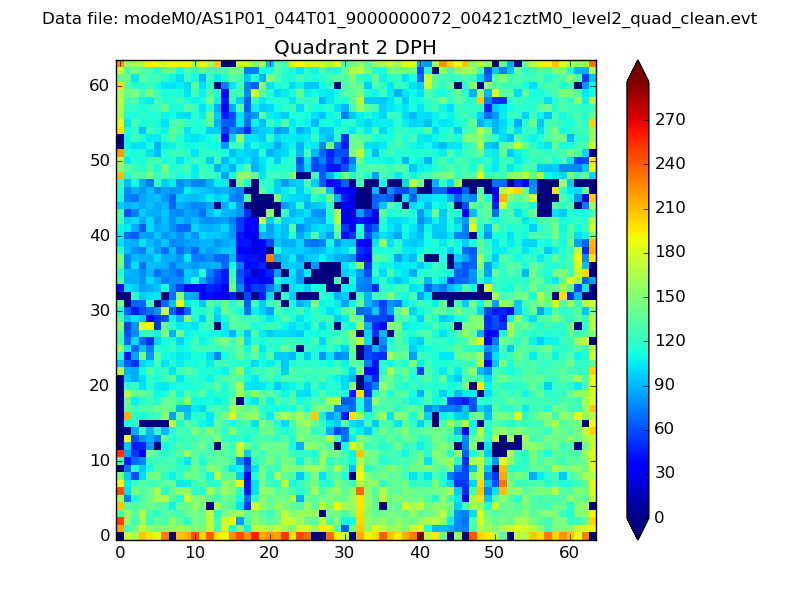 |
Quadrant C |
| Plot type | Count rate plots | Images |
|---|---|---|
| Comparison with Poisson distribution Blue bars denote a histogram of data divided into 1 sec bins. Red curve is a Poisson curve with rate = median count rate of data. |
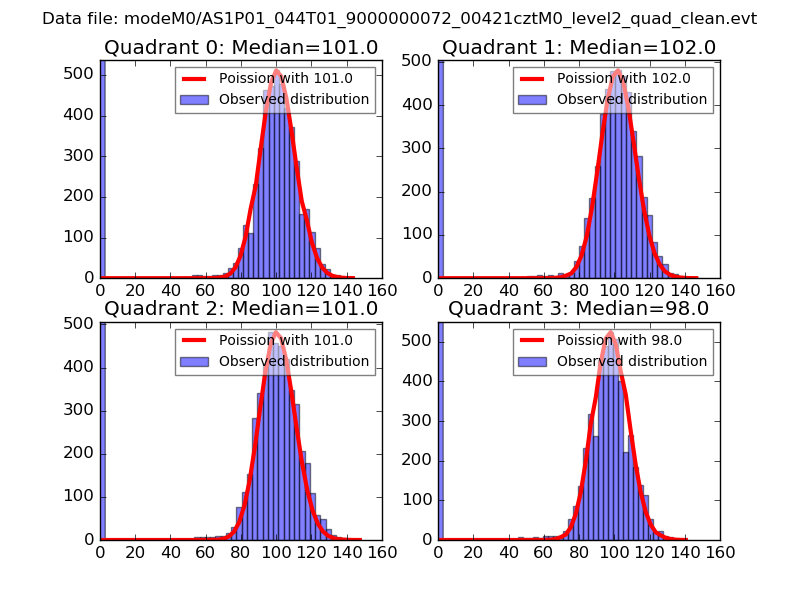 |
 |
| Quadrant-wise count rates Data is divided into 100 sec bins |
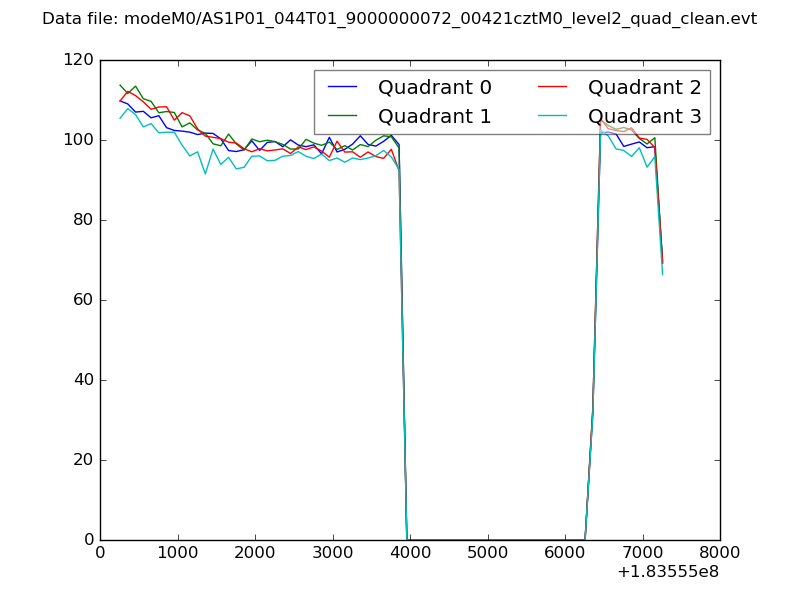 |
|
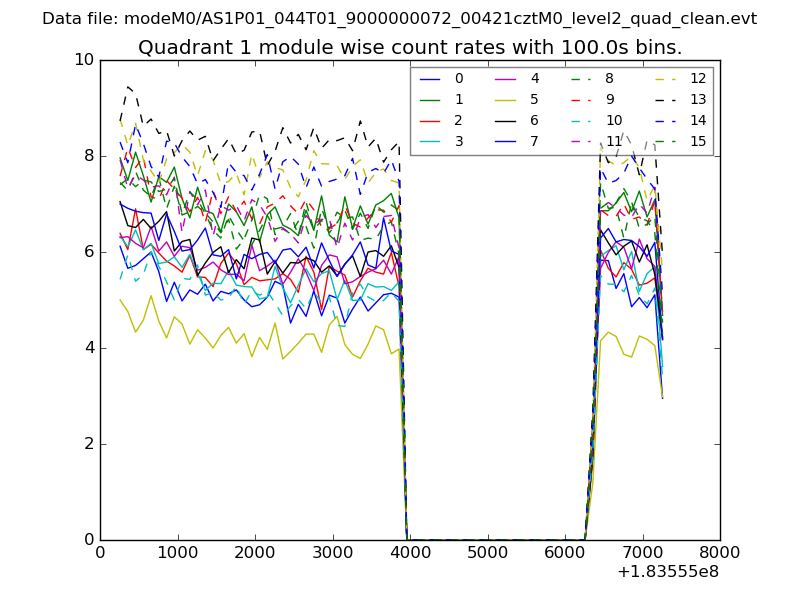
| Module-wise count rates for Quadrant A Data is divided into 100 sec bins |
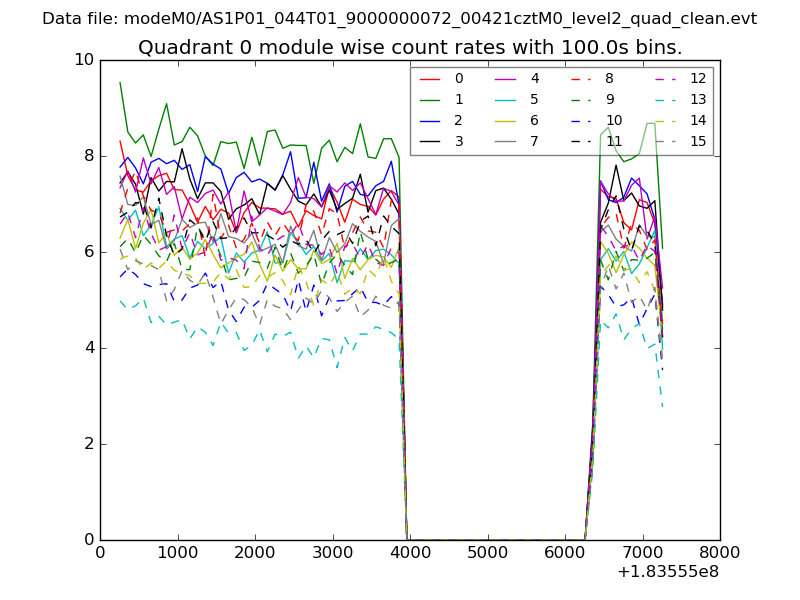 |
 |
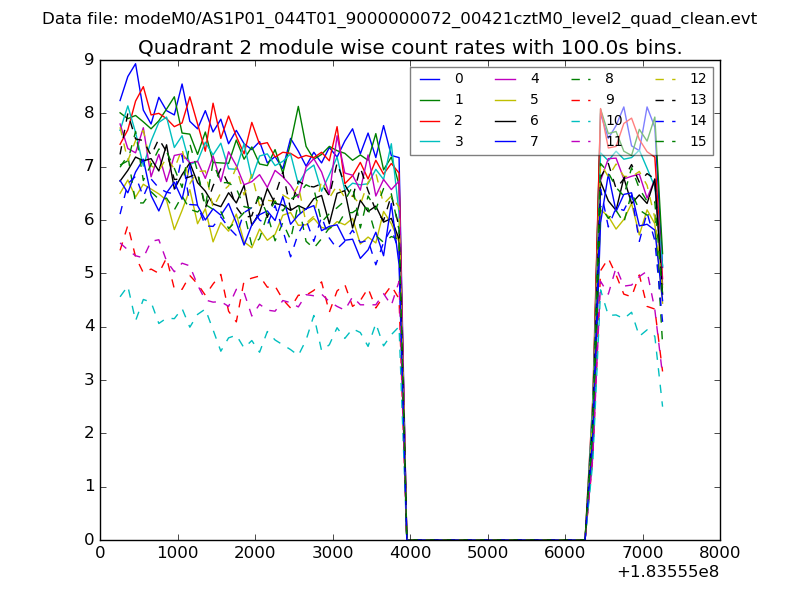
| Module-wise count rates for Quadrant B Data is divided into 100 sec bins |
 |
 |
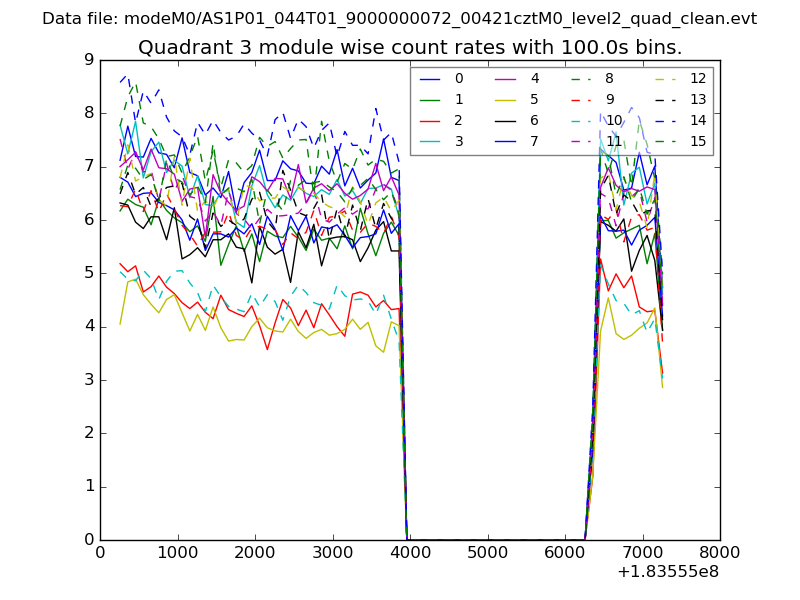
| Module-wise count rates for Quadrant C Data is divided into 100 sec bins |
 |
 |
| Module-wise count rates for Quadrant D Data is divided into 100 sec bins |
 |
 |
| Parameter | Plot |
|---|---|
| CZT HV Monitor | 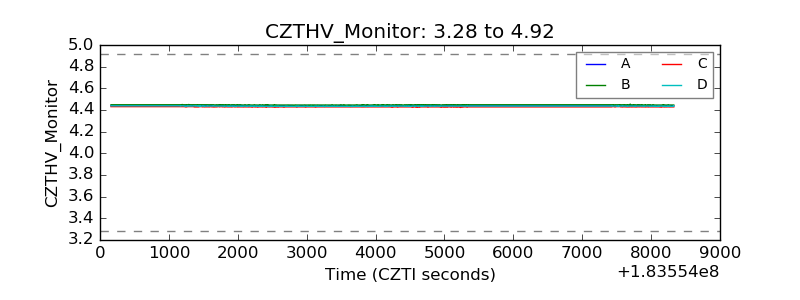 |
| D_VDD | 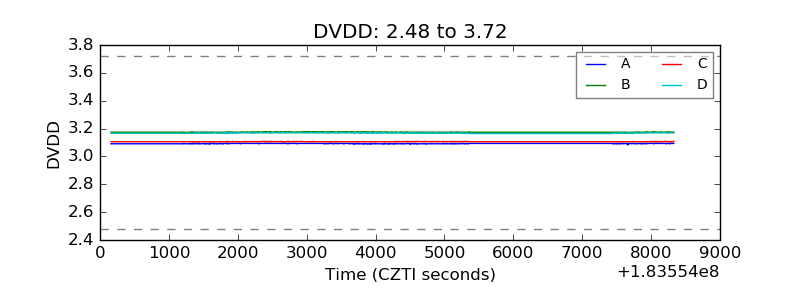 |
| Temperature 1 | 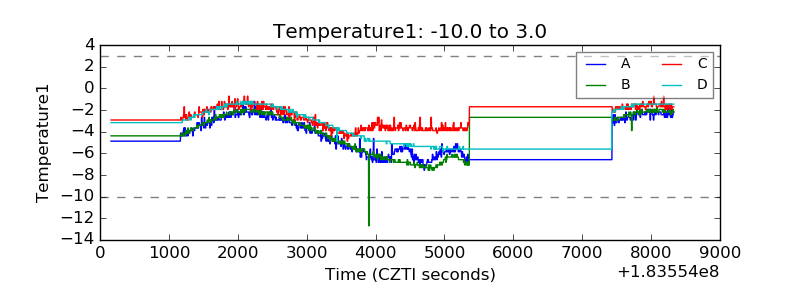 |
| Veto HV Monitor | 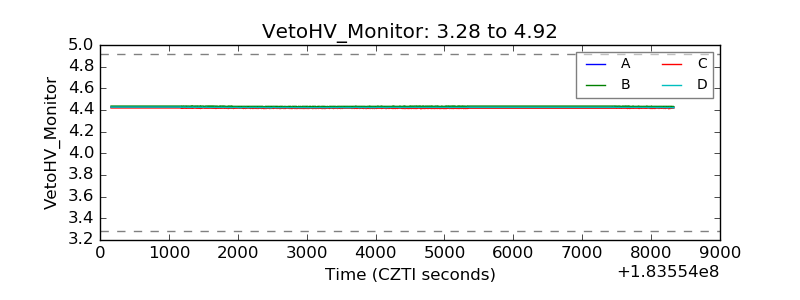 |
| Veto LLD | 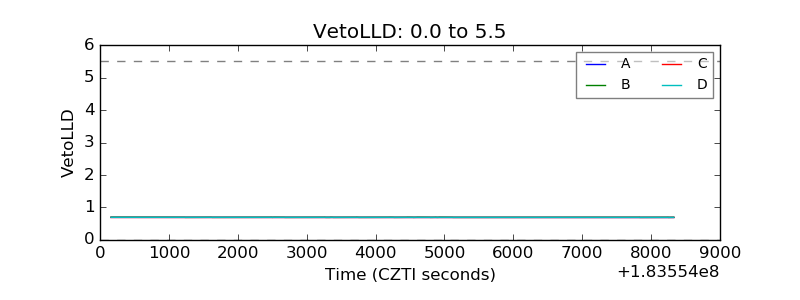 |
| Alpha Counter | 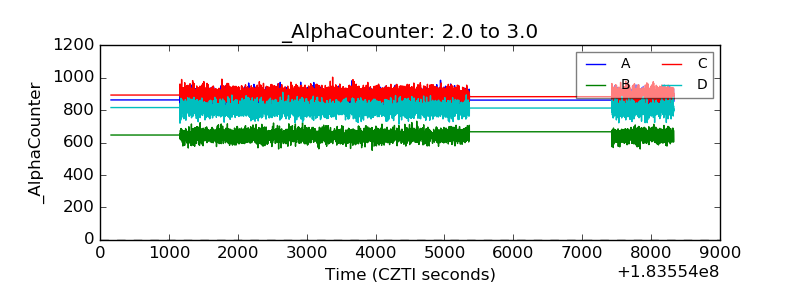 |
| _CPM_Rate | 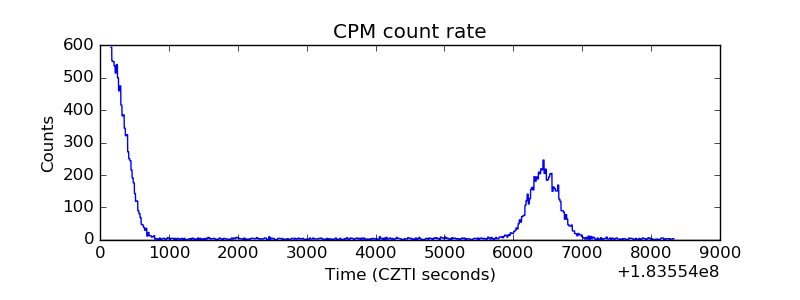 |
| CZT Counter | 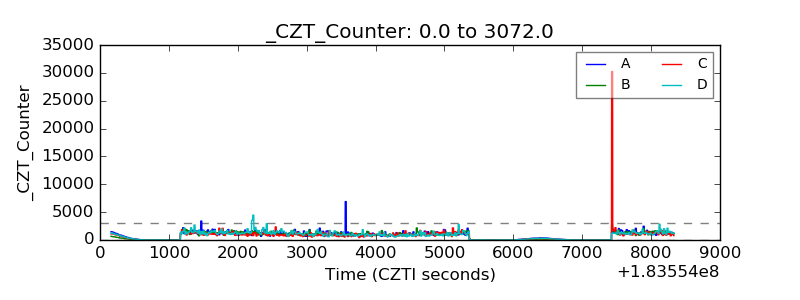 |
| +2.5 Volts monitor |  |
| +5 Volts monitor |  |
| _ROLL_ROT | 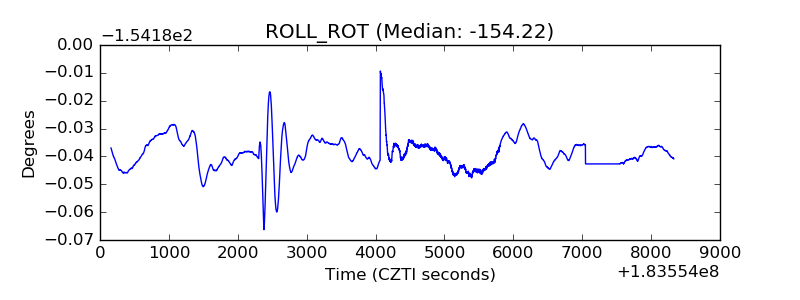 |
| _Roll_DEC | 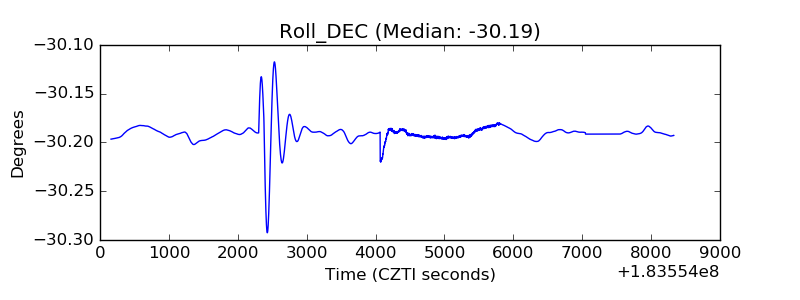 |
| _Roll_RA | 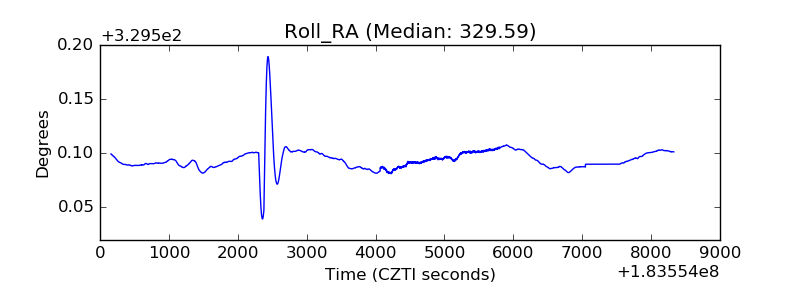 |
| Veto Counter | 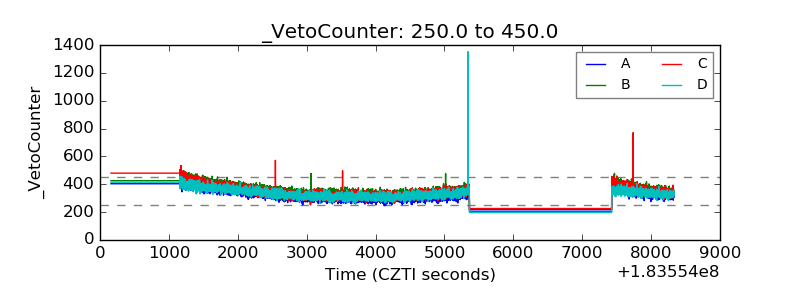 |