| Param | Original file | Final file |
|---|---|---|
| Filename | modeM0/AS1P01_044T01_9000000072_00422cztM0_level2.evt | modeM0/AS1P01_044T01_9000000072_00422cztM0_level2_quad_clean.evt |
| Size (bytes) | 564,448,320 | 50,120,640 |
| Size | 538.3 MB | 47.8 MB |
| Events in quadrant A | 4,411,494 | 313,430 |
| Events in quadrant B | 4,405,617 | 315,369 |
| Events in quadrant C | 3,857,128 | 311,757 |
| Events in quadrant D | 4,161,341 | 304,054 |
| Mode M0 | |||
|---|---|---|---|
| Quadrant | BADHDUFLAG | Total packets | Discarded packets |
| A | 0 | 15897 | 0 |
| B | 0 | 15864 | 0 |
| C | 0 | 14215 | 0 |
| D | 0 | 15129 | 0 |
| Mode SS | |||
|---|---|---|---|
| Quadrant | BADHDUFLAG | Total packets | Discarded packets |
| A | 0 | 78 | 0 |
| B | 0 | 78 | 0 |
| C | 0 | 78 | 0 |
| D | 0 | 78 | 0 |
| Quadrant | Total seconds | Saturated seconds | Saturation percentage |
|---|---|---|---|
| A | 3859 | 5 | 0.129567% |
| B | 3859 | 2 | 0.051827% |
| C | 3859 | 1 | 0.025913% |
| D | 3859 | 6 | 0.155481% |
Noise dominated data is calculated using 1-second bins in cleaned event files. If a bin has >2000 counts, and if more than 50% of those come from <1% of pixels, then it is considered to be noise-dominated and hence unusable.
| Quadrant | # 1 sec bins | Bins with >0 counts | Bins with >2000 counts | High rate bins dominated by noise | Noise dominated (total time) | Noise dominated (detector-on time) | Marked lightcurve |
|---|---|---|---|---|---|---|---|
| A | 3859 | 3859 | 82 | 82 | 2.12% | 2.12% | 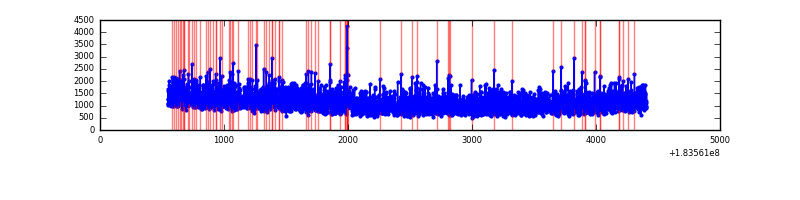 |
| B | 3859 | 3859 | 41 | 41 | 1.06% | 1.06% | 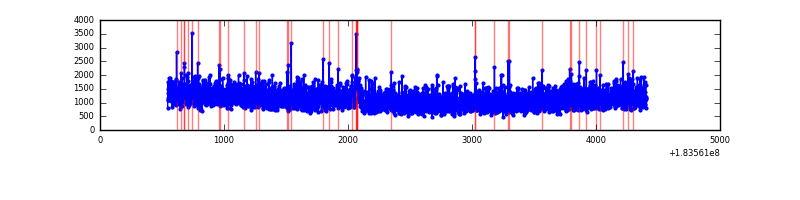 |
| C | 3859 | 3859 | 13 | 13 | 0.34% | 0.34% | 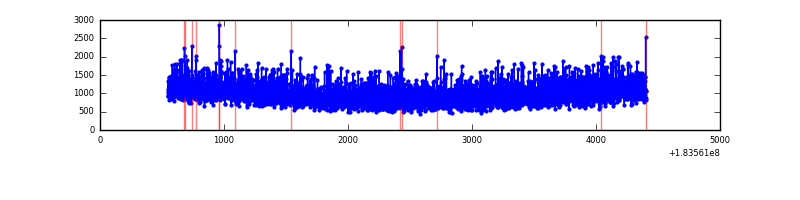 |
| D | 3859 | 3859 | 62 | 62 | 1.61% | 1.61% | 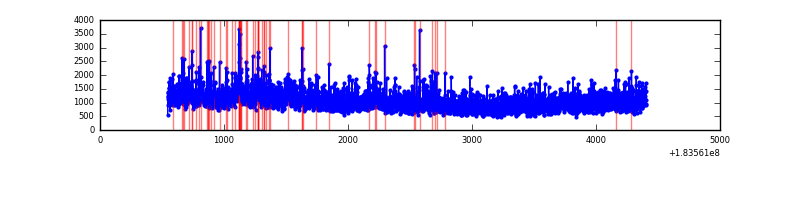 |
Top three noisy pixels from each quadrant. If the there are fewer than three noisy pixels in the level2.evt file, extra rows are filled as -1
| Pixel properties | Quadrant properties | ||||||
|---|---|---|---|---|---|---|---|
| Quadrant | DetID | PixID | Counts | Sigma | Mean | Median | Sigma |
| A | 0 | 238 | 81600 | 328.34 | 1097 | 1090 | 245.2 |
| A | 12 | 243 | 67887 | 272.42 | 1097 | 1090 | 245.2 |
| A | 13 | 17 | 8452 | 30.02 | 1097 | 1090 | 245.2 |
| B | 15 | 80 | 97553 | 369.01 | 1105 | 1114 | 261.3 |
| B | 7 | 221 | 16238 | 57.87 | 1105 | 1114 | 261.3 |
| B | 0 | 230 | 13281 | 46.56 | 1105 | 1114 | 261.3 |
| C | 1 | 1 | 13641 | 46.76 | 967 | 1002 | 270.3 |
| C | 9 | 206 | 12230 | 41.54 | 967 | 1002 | 270.3 |
| C | 10 | 19 | 9851 | 32.74 | 967 | 1002 | 270.3 |
| D | 13 | 7 | 183644 | 630.05 | 928 | 965 | 289.9 |
| D | 1 | 4 | 125144 | 428.28 | 928 | 965 | 289.9 |
| D | 13 | 221 | 52645 | 178.24 | 928 | 965 | 289.9 |
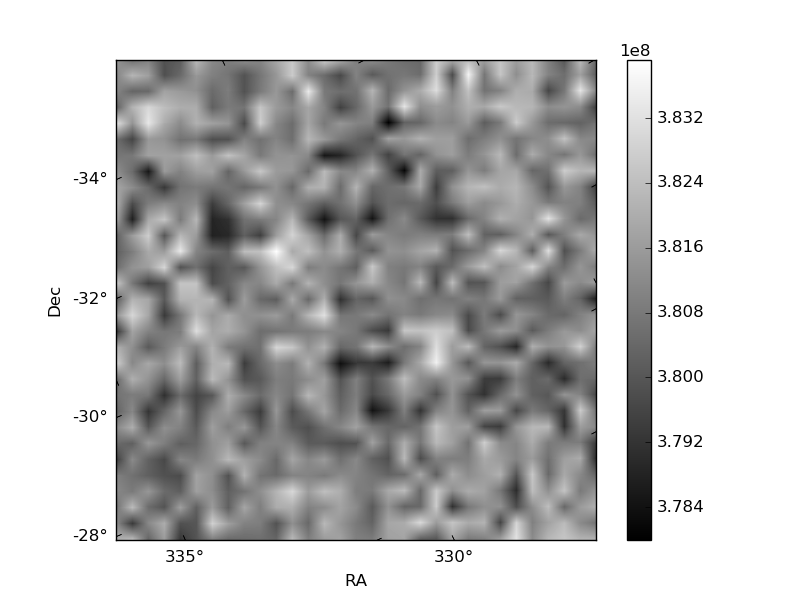
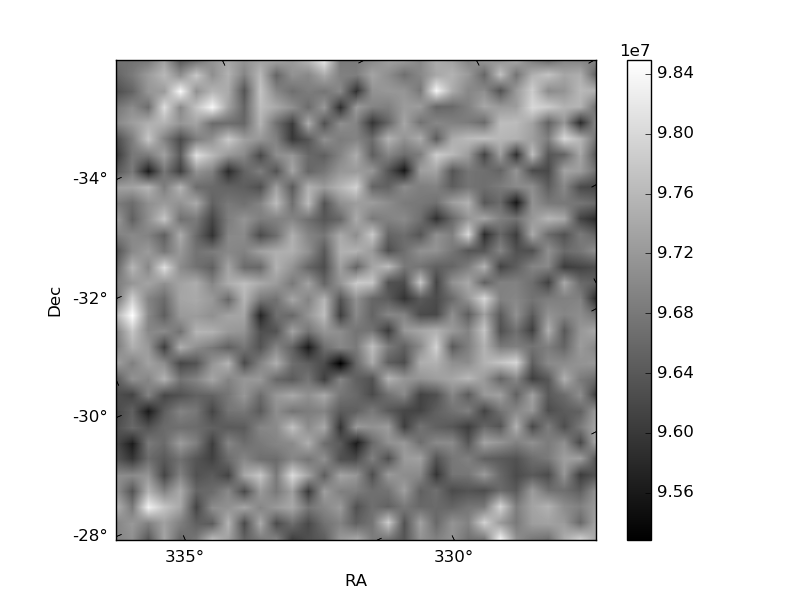
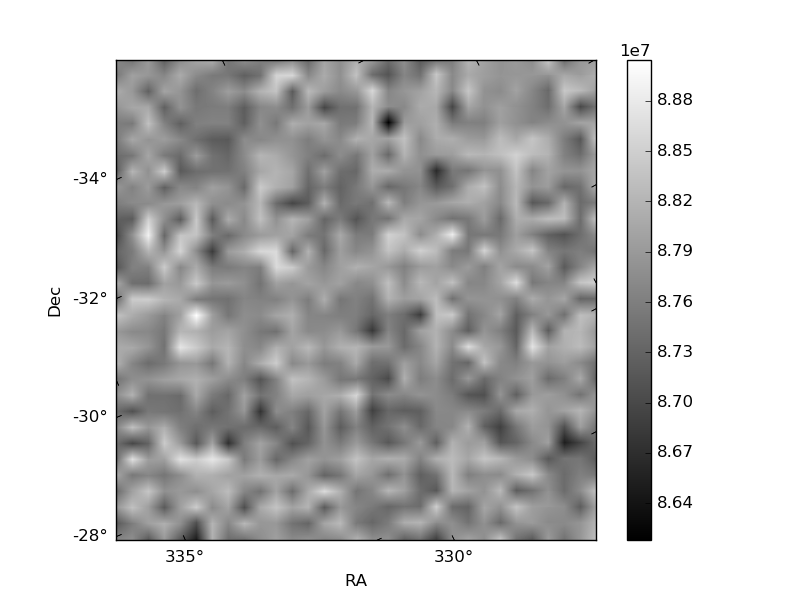
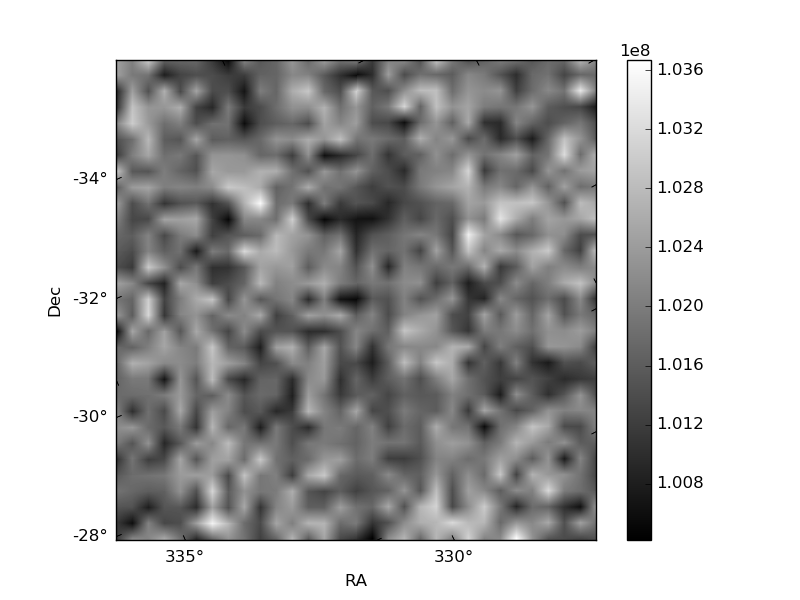
Histogram calculated using DETX and DETY for each event in the final _common_clean file
| Quadrant A | 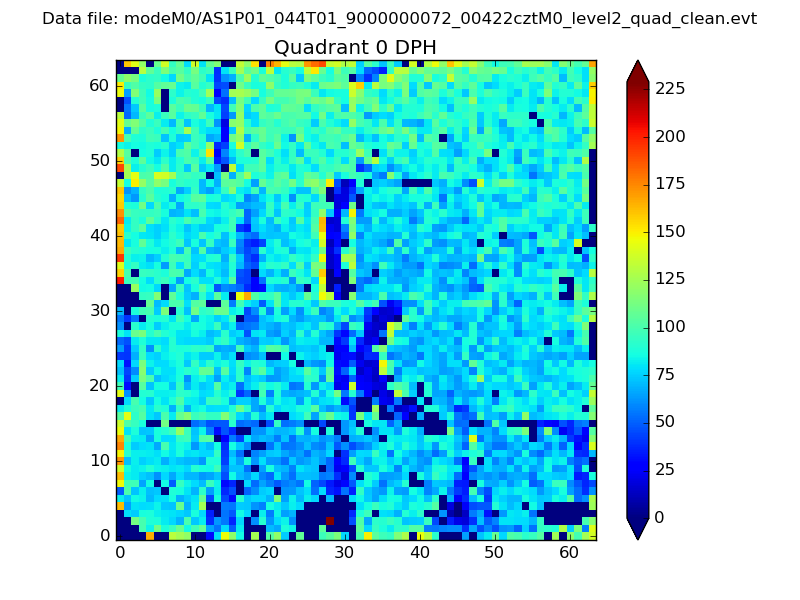 |
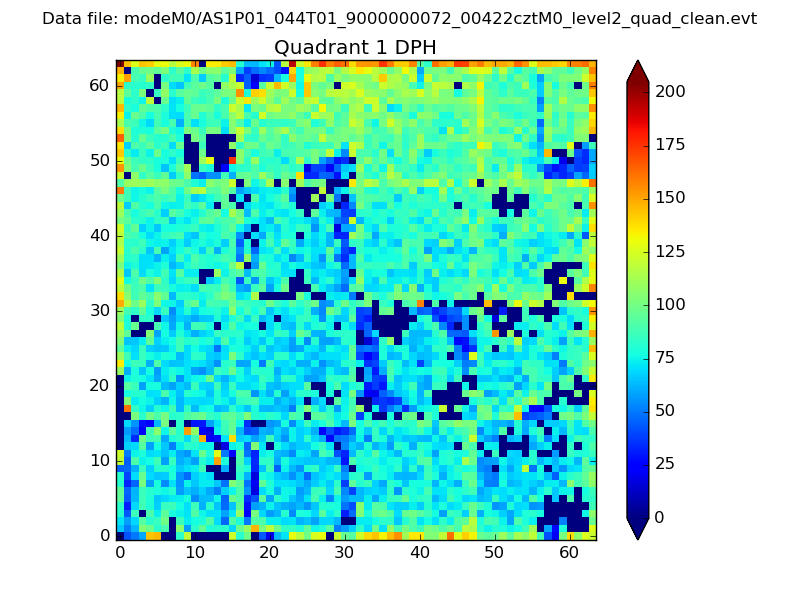 |
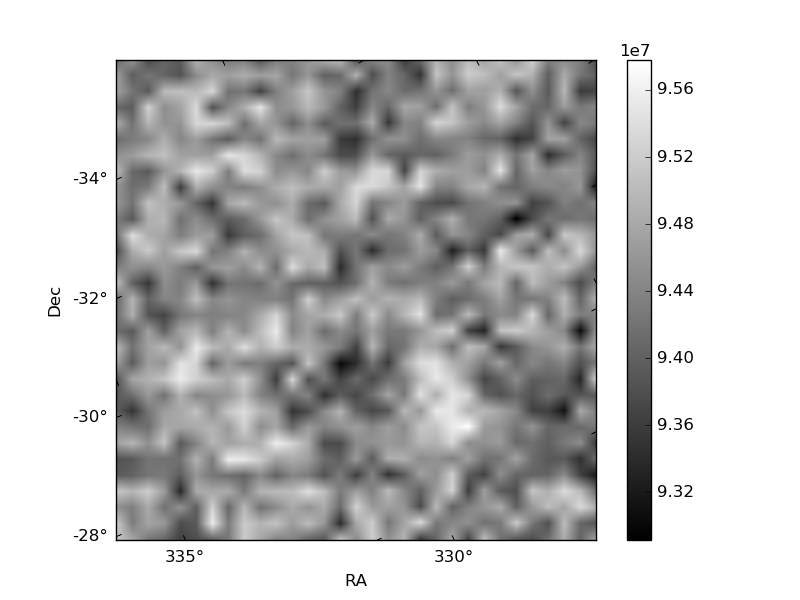
Quadrant B |
|---|---|---|---|
| Quadrant D | 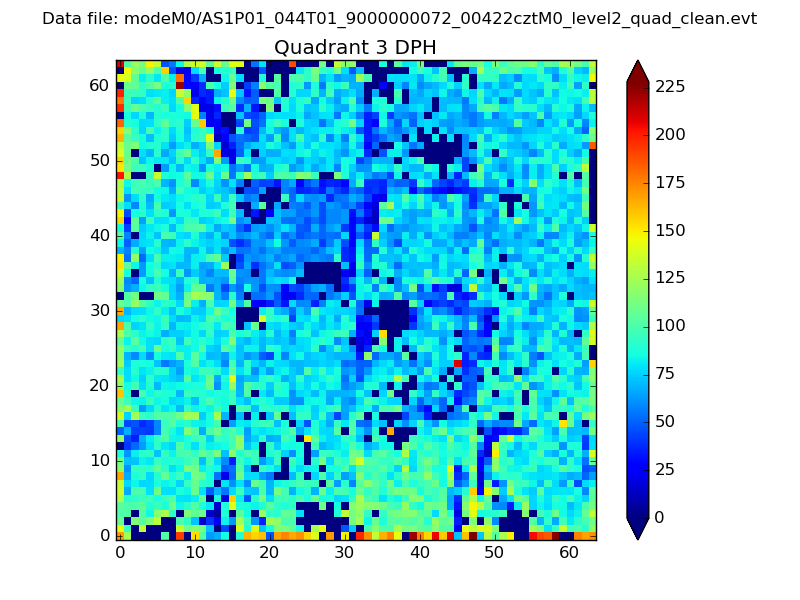 |
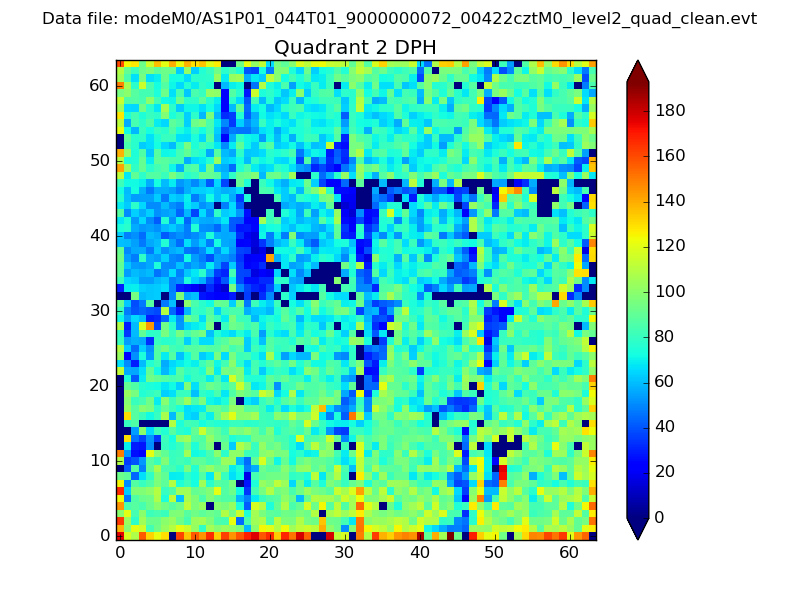 |
Quadrant C |
| Plot type | Count rate plots | Images |
|---|---|---|
| Comparison with Poisson distribution Blue bars denote a histogram of data divided into 1 sec bins. Red curve is a Poisson curve with rate = median count rate of data. |
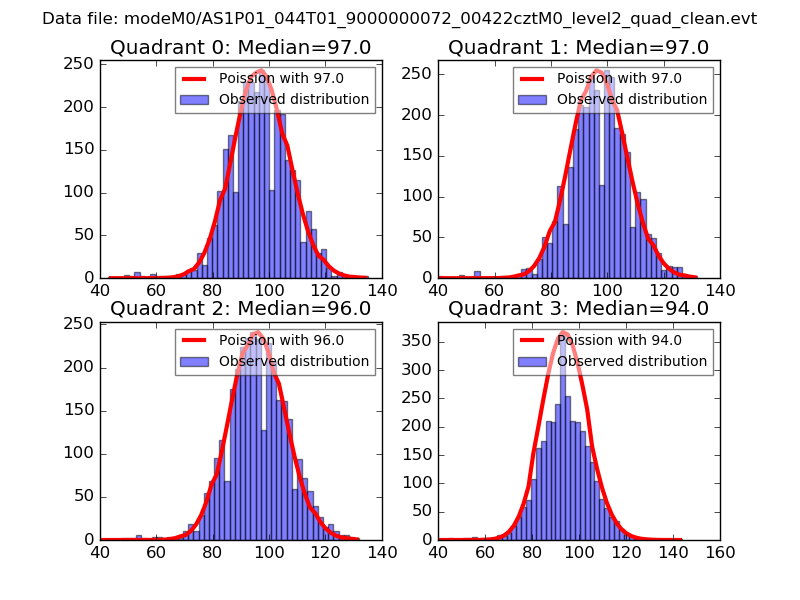 |
 |
| Quadrant-wise count rates Data is divided into 100 sec bins |
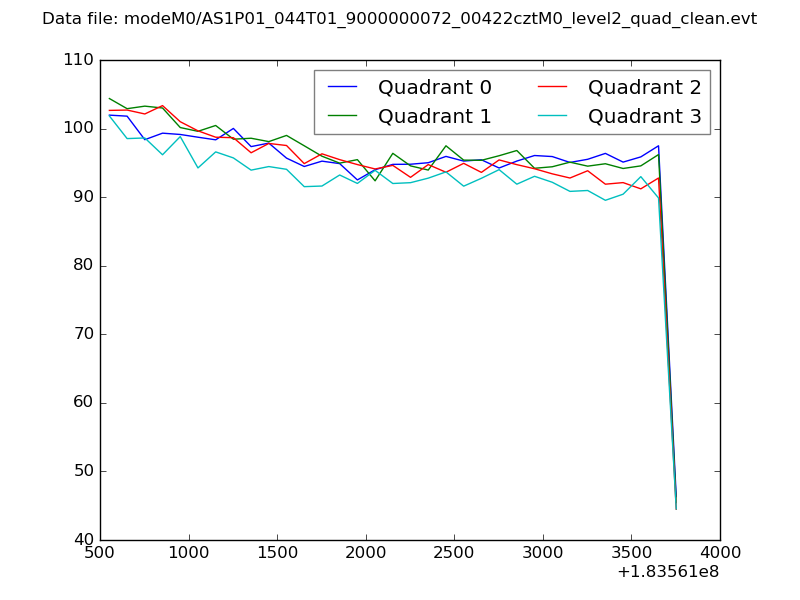 |
|
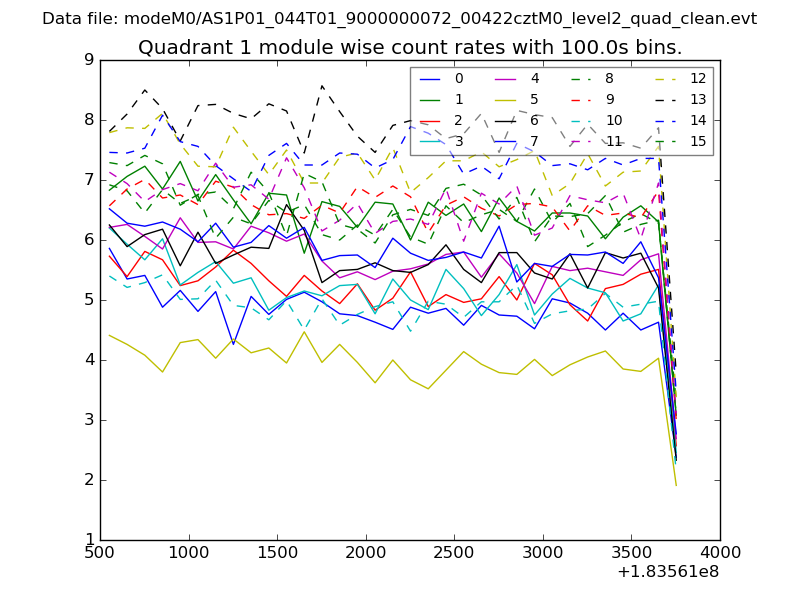
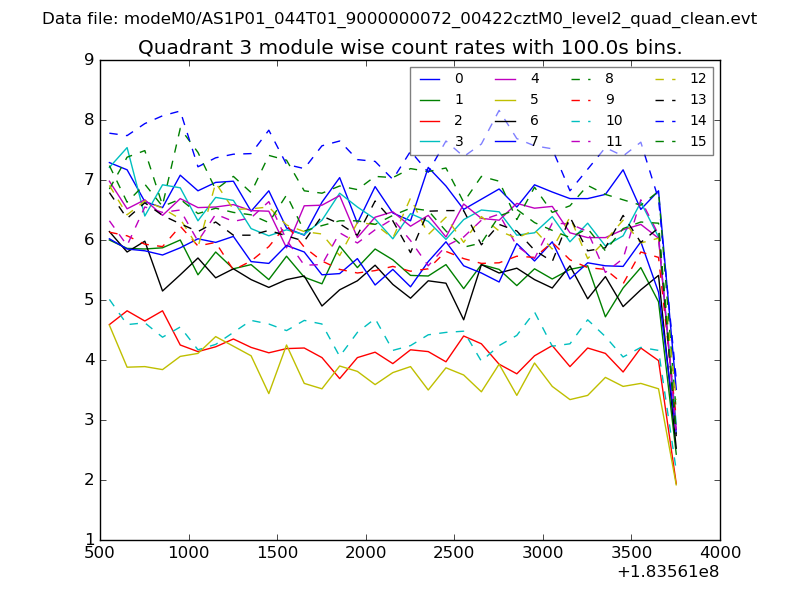
| Module-wise count rates for Quadrant A Data is divided into 100 sec bins |
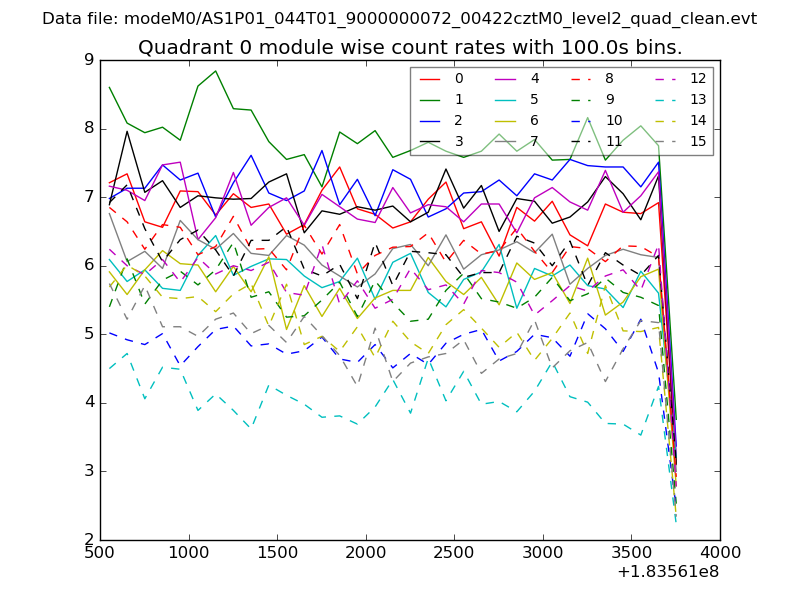 |
 |
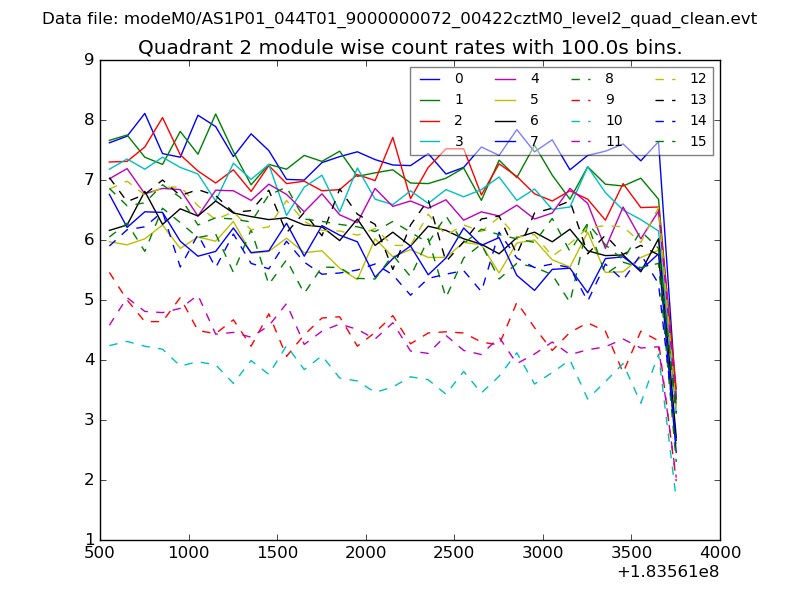
| Module-wise count rates for Quadrant B Data is divided into 100 sec bins |
 |
 |
| Module-wise count rates for Quadrant C Data is divided into 100 sec bins |
 |
 |
| Module-wise count rates for Quadrant D Data is divided into 100 sec bins |
 |
 |
| Parameter | Plot |
|---|---|
| CZT HV Monitor | 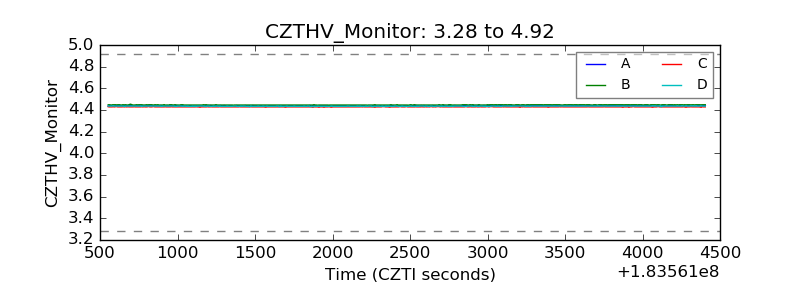 |
| D_VDD | 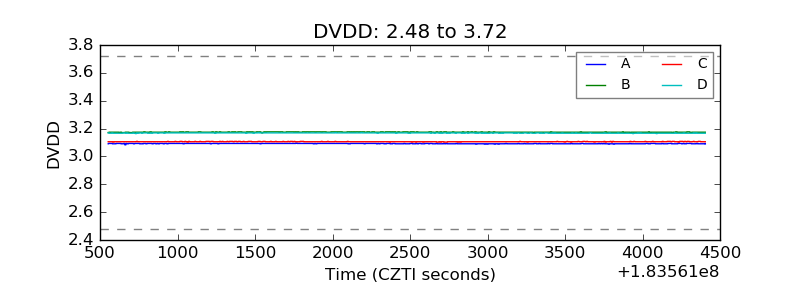 |
| Temperature 1 | 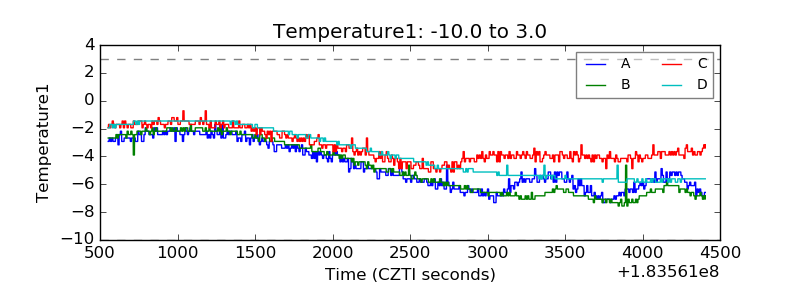 |
| Veto HV Monitor | 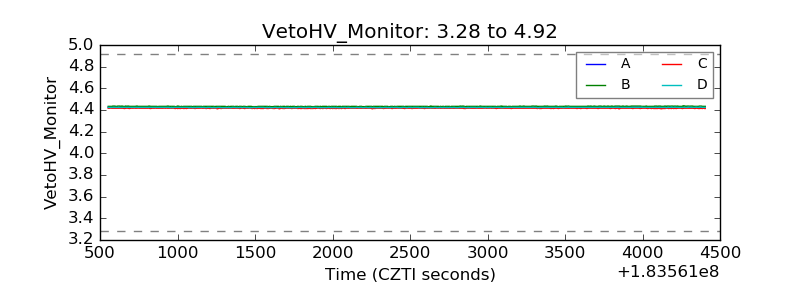 |
| Veto LLD | 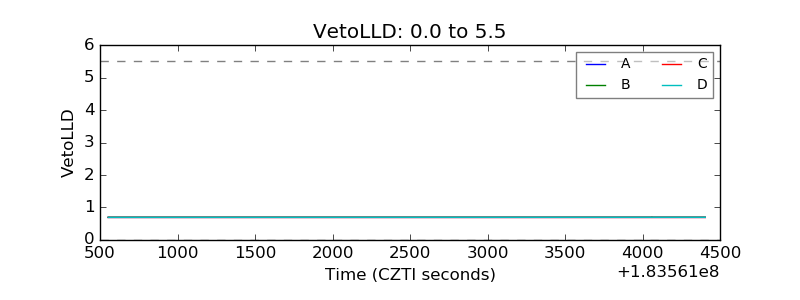 |
| Alpha Counter | 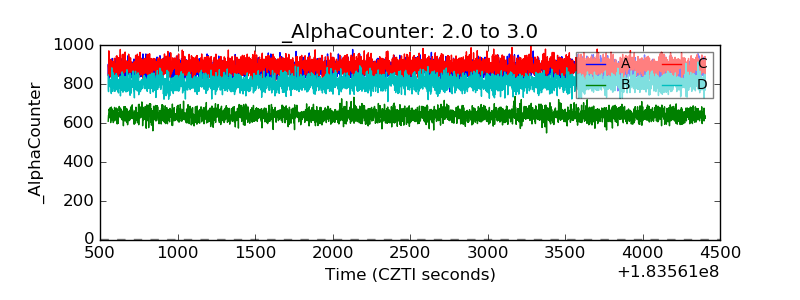 |
| _CPM_Rate | 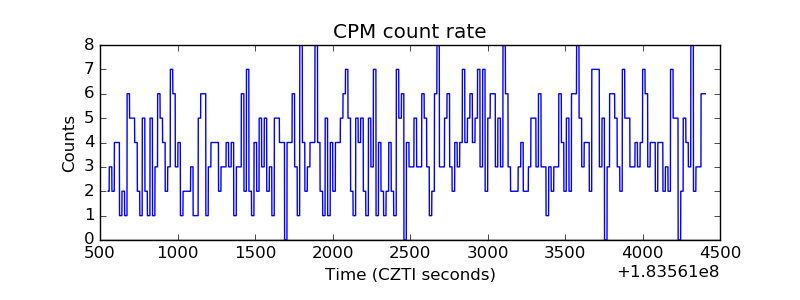 |
| CZT Counter | 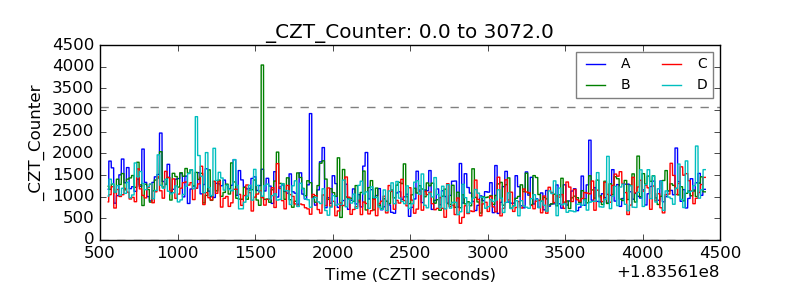 |
| +2.5 Volts monitor | 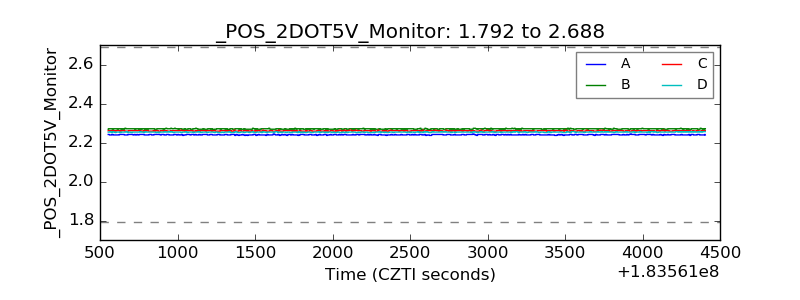 |
| +5 Volts monitor |  |
| _ROLL_ROT | 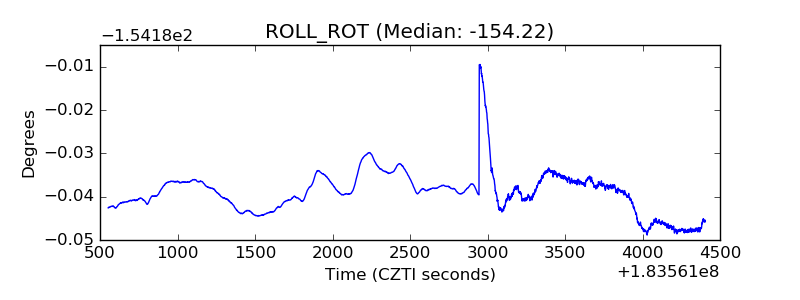 |
| _Roll_DEC | 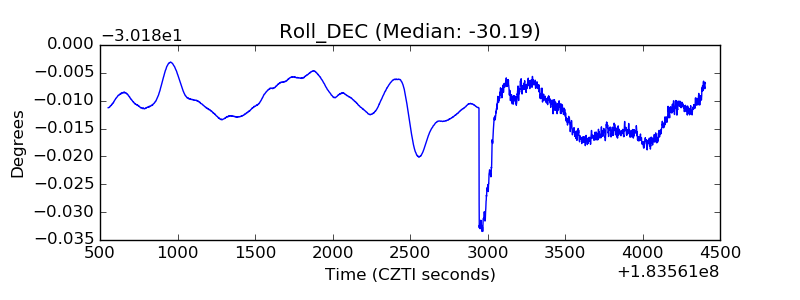 |
| _Roll_RA | 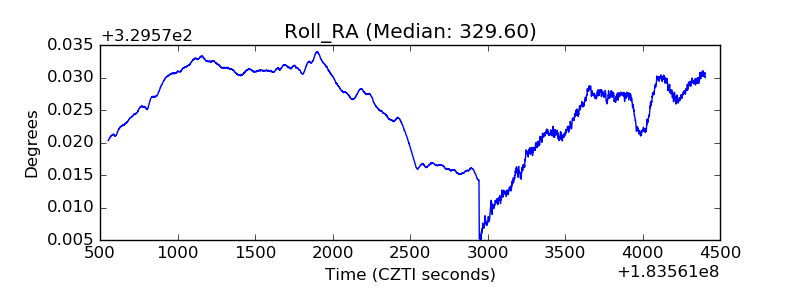 |
| Veto Counter | 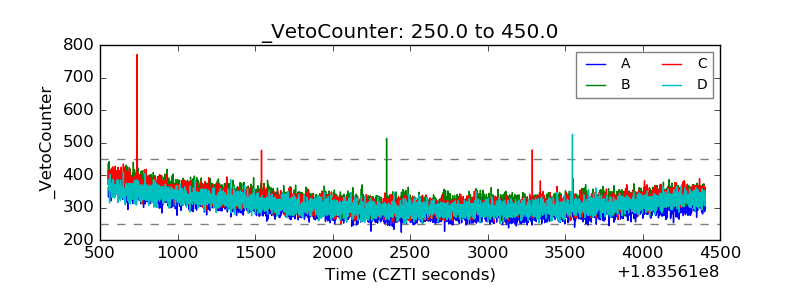 |