| Param | Original file | Final file |
|---|---|---|
| Filename | modeM0/AS1P01_044T01_9000000072_00430cztM0_level2.evt | modeM0/AS1P01_044T01_9000000072_00430cztM0_level2_quad_clean.evt |
| Size (bytes) | 862,344,000 | 38,039,040 |
| Size | 822.4 MB | 36.3 MB |
| Events in quadrant A | 7,273,016 | 190,841 |
| Events in quadrant B | 6,351,758 | 203,413 |
| Events in quadrant C | 5,898,220 | 205,563 |
| Events in quadrant D | 6,257,468 | 196,369 |
| Mode M9 | |||
|---|---|---|---|
| Quadrant | BADHDUFLAG | Total packets | Discarded packets |
| A | 0 | 29 | 0 |
| B | 0 | 29 | 0 |
| C | 0 | 29 | 0 |
| D | 0 | 30 | 0 |
| Mode M0 | |||
|---|---|---|---|
| Quadrant | BADHDUFLAG | Total packets | Discarded packets |
| A | 0 | 25178 | 3 |
| B | 0 | 22498 | 2 |
| C | 0 | 21128 | 2 |
| D | 0 | 22199 | 2 |
| Mode SS | |||
|---|---|---|---|
| Quadrant | BADHDUFLAG | Total packets | Discarded packets |
| A | 0 | 104 | 0 |
| B | 0 | 104 | 0 |
| C | 0 | 104 | 0 |
| D | 0 | 104 | 0 |
| Quadrant | Total seconds | Saturated seconds | Saturation percentage |
|---|---|---|---|
| A | 5059 | 192 | 3.795216% |
| B | 5059 | 14 | 0.276735% |
| C | 5059 | 16 | 0.316268% |
| D | 5059 | 66 | 1.304606% |
Noise dominated data is calculated using 1-second bins in cleaned event files. If a bin has >2000 counts, and if more than 50% of those come from <1% of pixels, then it is considered to be noise-dominated and hence unusable.
| Quadrant | # 1 sec bins | Bins with >0 counts | Bins with >2000 counts | High rate bins dominated by noise | Noise dominated (total time) | Noise dominated (detector-on time) | Marked lightcurve |
|---|---|---|---|---|---|---|---|
| A | 7214 | 5060 | 586 | 586 | 8.12% | 11.58% | 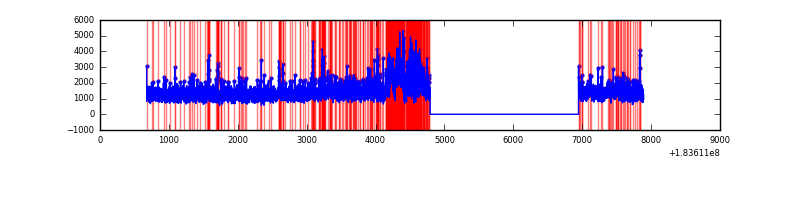 |
| B | 7214 | 5060 | 146 | 146 | 2.02% | 2.89% | 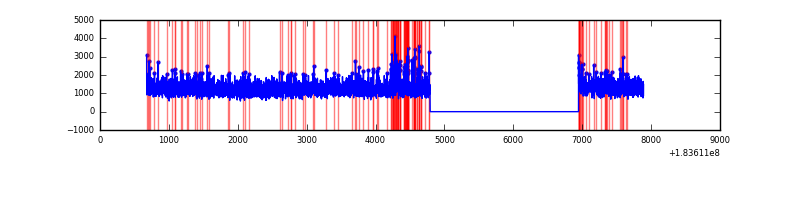 |
| C | 7214 | 5060 | 87 | 87 | 1.21% | 1.72% | 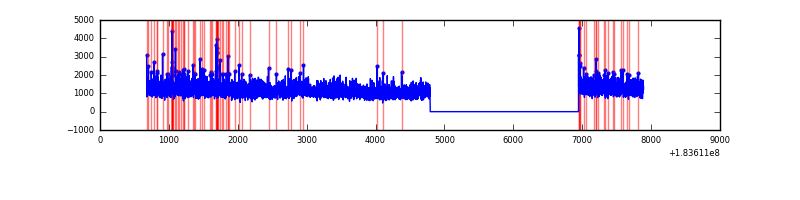 |
| D | 7214 | 5060 | 190 | 190 | 2.63% | 3.75% | 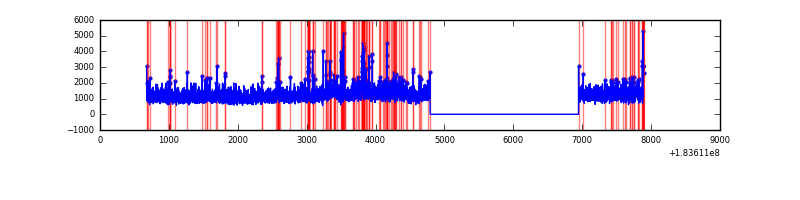 |
Top three noisy pixels from each quadrant. If the there are fewer than three noisy pixels in the level2.evt file, extra rows are filled as -1
| Pixel properties | Quadrant properties | ||||||
|---|---|---|---|---|---|---|---|
| Quadrant | DetID | PixID | Counts | Sigma | Mean | Median | Sigma |
| A | 11 | 191 | 965459 | 2719.39 | 1586 | 1569 | 354.5 |
| A | 0 | 238 | 80657 | 223.13 | 1586 | 1569 | 354.5 |
| A | 5 | 244 | 65896 | 181.48 | 1586 | 1569 | 354.5 |
| B | 5 | 31 | 151785 | 401.05 | 1592 | 1601 | 374.5 |
| B | 0 | 197 | 29770 | 75.22 | 1592 | 1601 | 374.5 |
| B | 15 | 238 | 22850 | 56.74 | 1592 | 1601 | 374.5 |
| C | 9 | 206 | 103968 | 255.03 | 1448 | 1499 | 401.8 |
| C | 1 | 1 | 82867 | 202.51 | 1448 | 1499 | 401.8 |
| C | 14 | 238 | 12608 | 27.65 | 1448 | 1499 | 401.8 |
| D | 1 | 4 | 176231 | 421.5 | 1437 | 1470 | 414.6 |
| D | 11 | 177 | 161287 | 385.46 | 1437 | 1470 | 414.6 |
| D | 1 | 5 | 145852 | 348.23 | 1437 | 1470 | 414.6 |
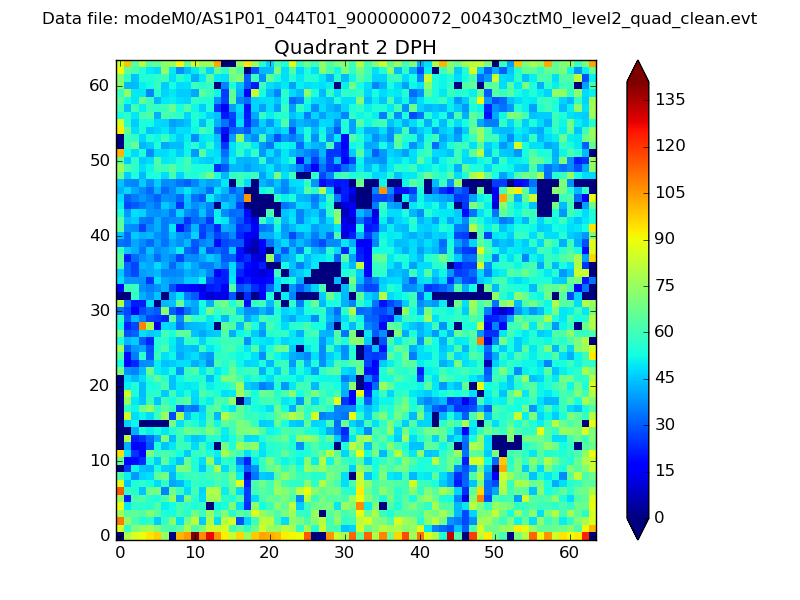
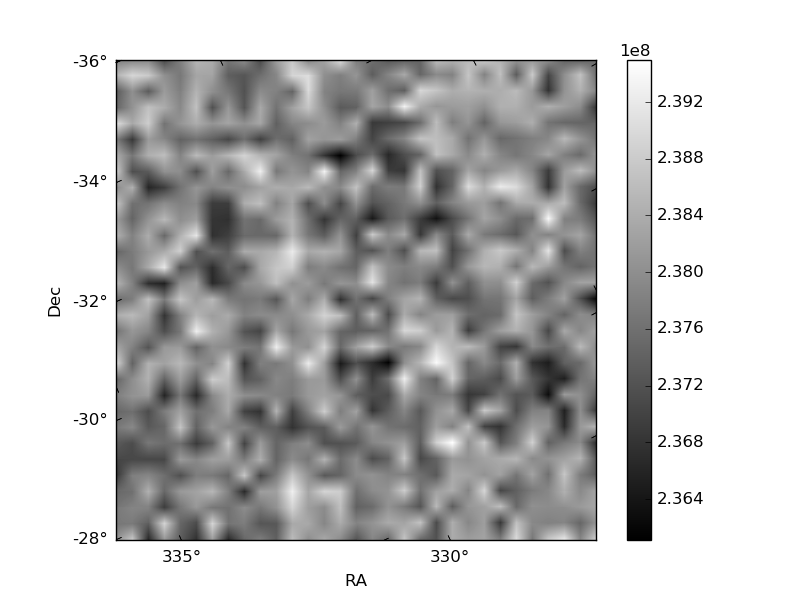
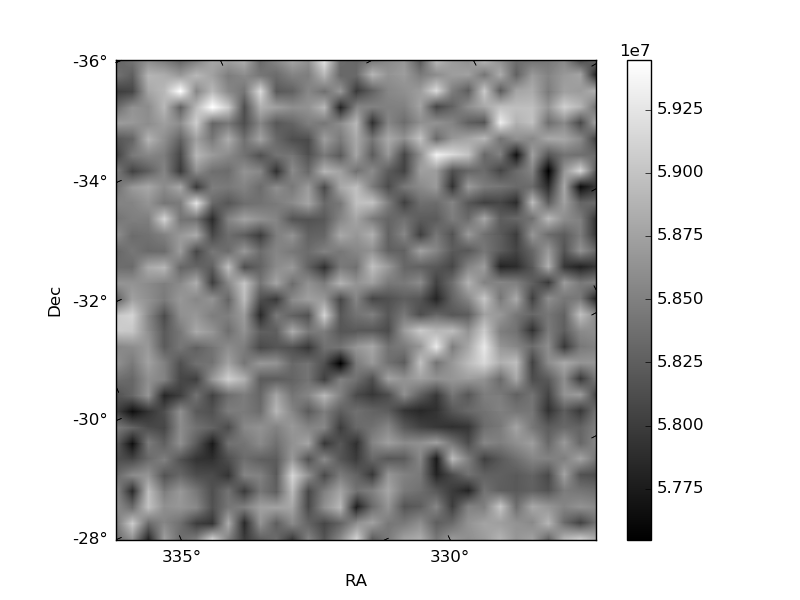
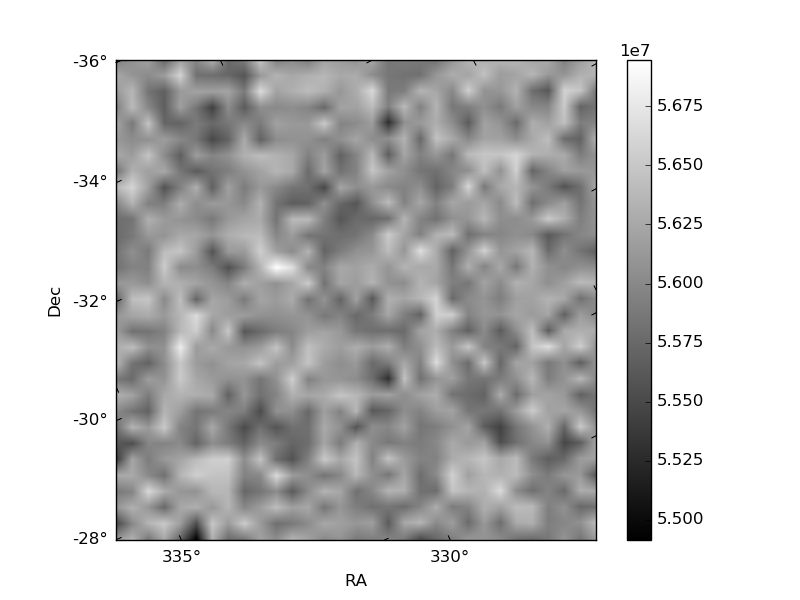
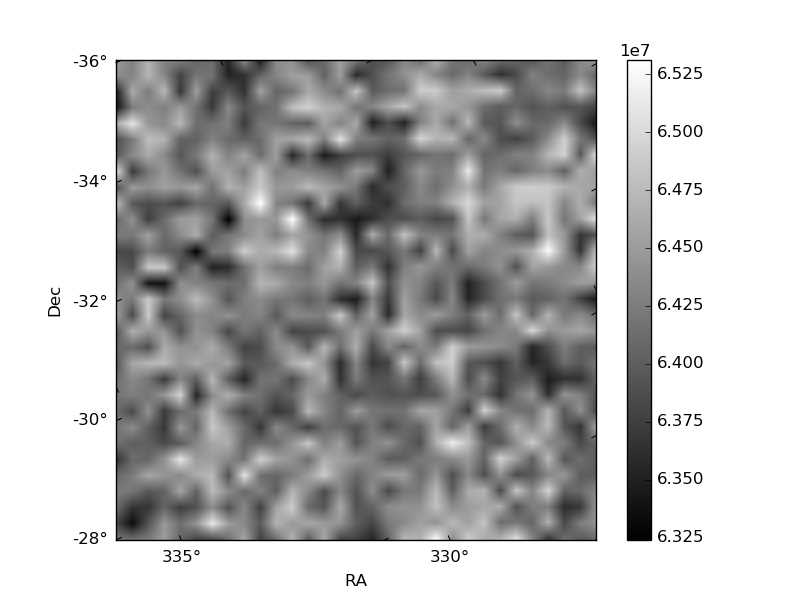
Histogram calculated using DETX and DETY for each event in the final _common_clean file
| Quadrant A | 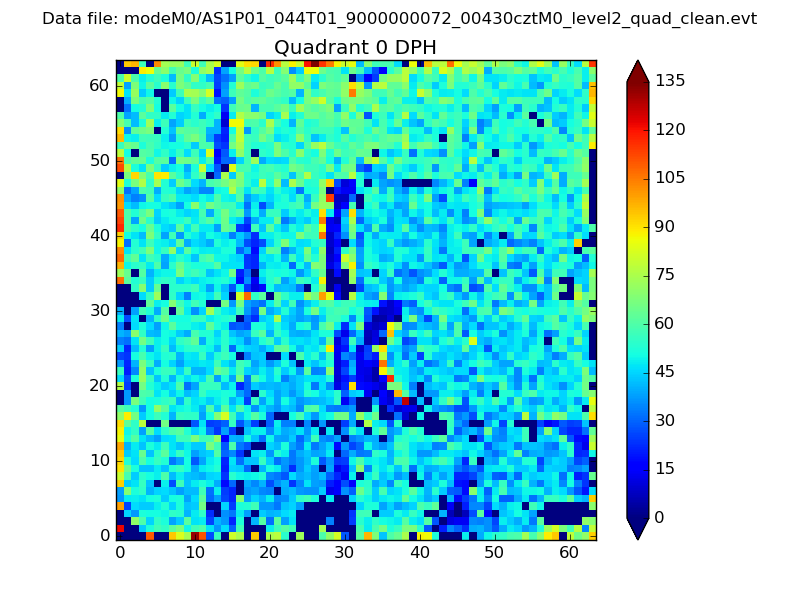 |
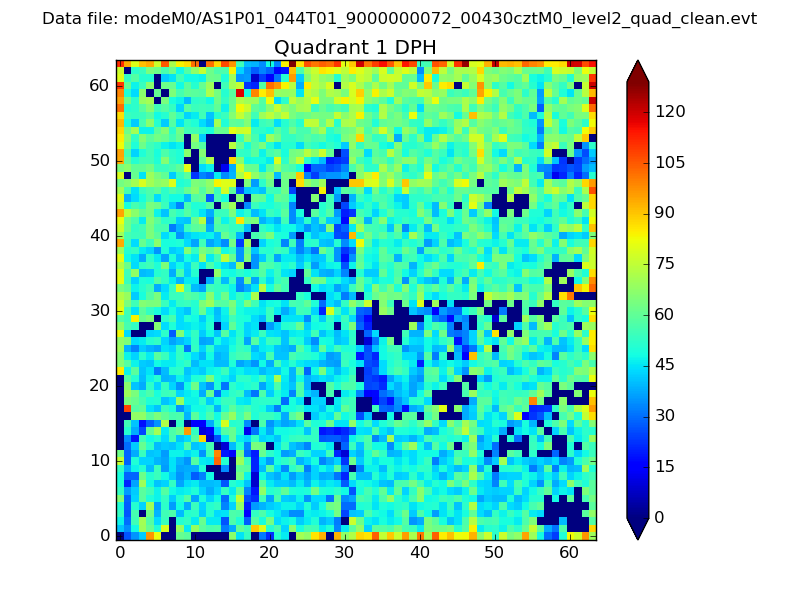 |
Quadrant B |
|---|---|---|---|
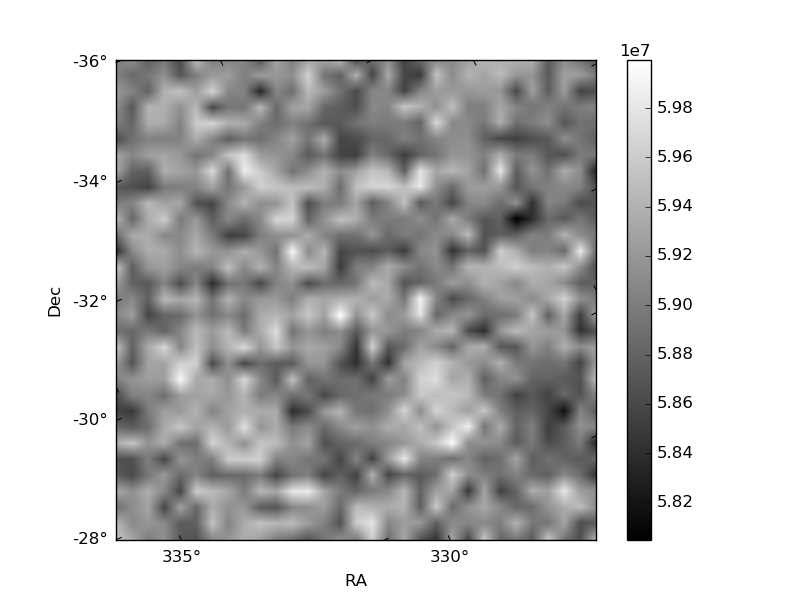
| Quadrant D | 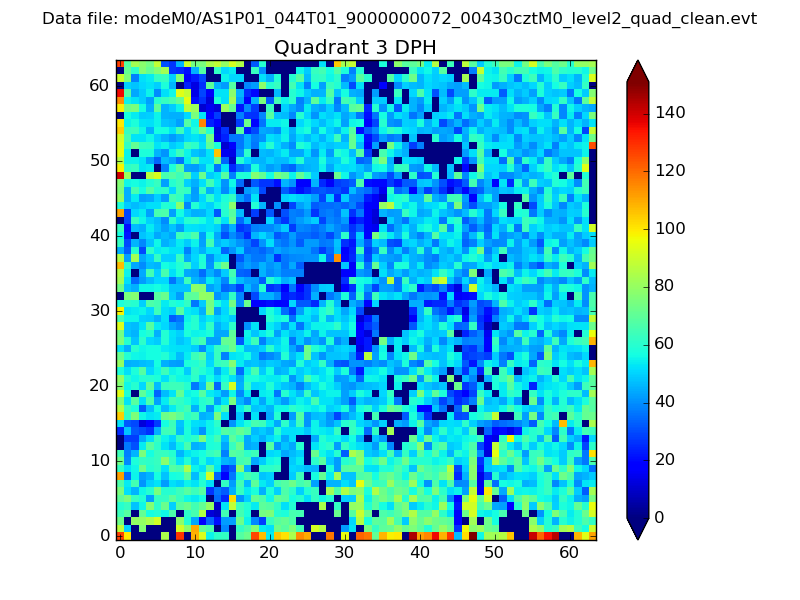 |
 |
Quadrant C |
| Plot type | Count rate plots | Images |
|---|---|---|
| Comparison with Poisson distribution Blue bars denote a histogram of data divided into 1 sec bins. Red curve is a Poisson curve with rate = median count rate of data. |
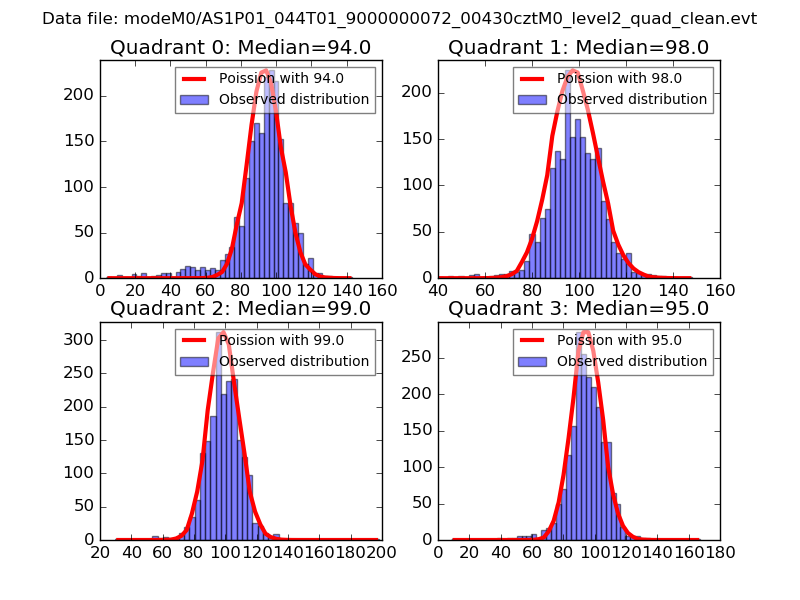 |
 |
| Quadrant-wise count rates Data is divided into 100 sec bins |
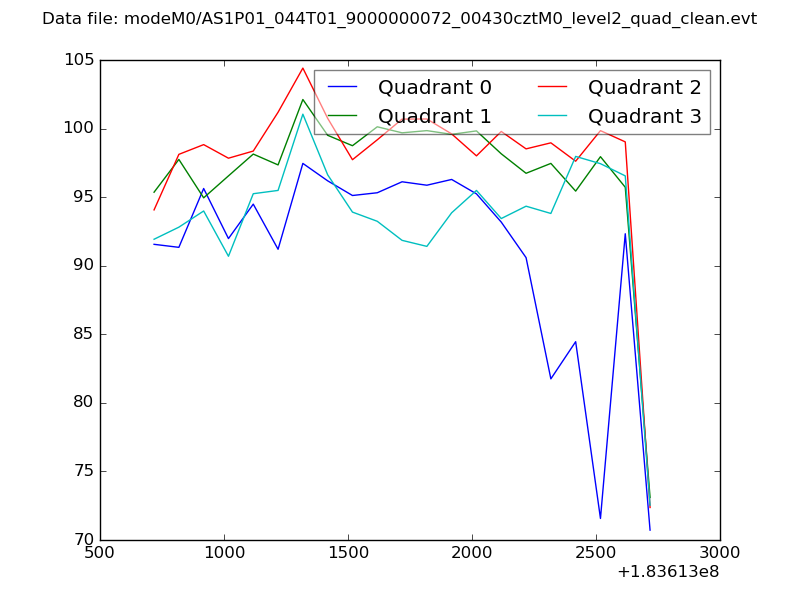 |
|
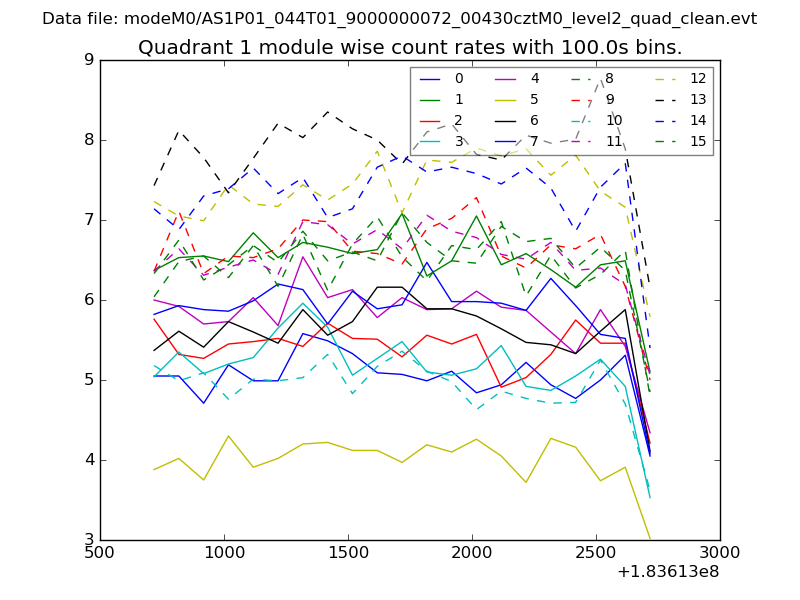
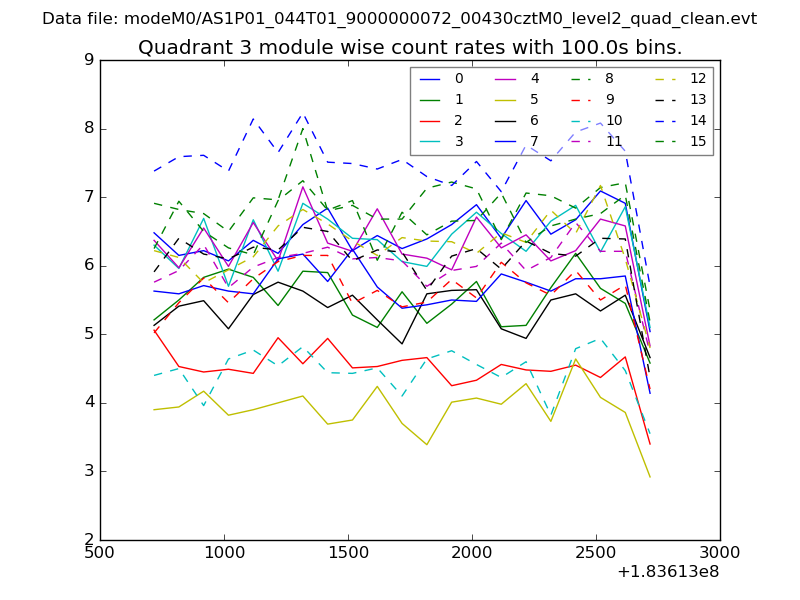
| Module-wise count rates for Quadrant A Data is divided into 100 sec bins |
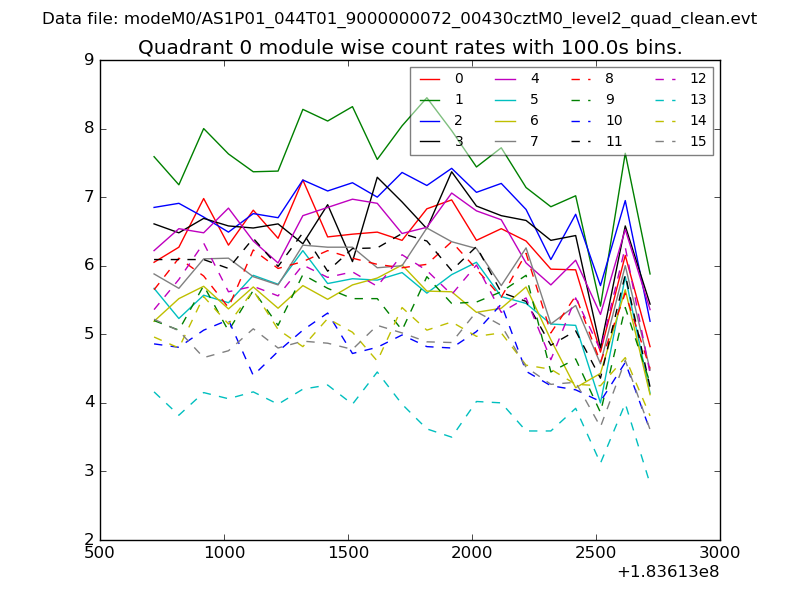 |
 |
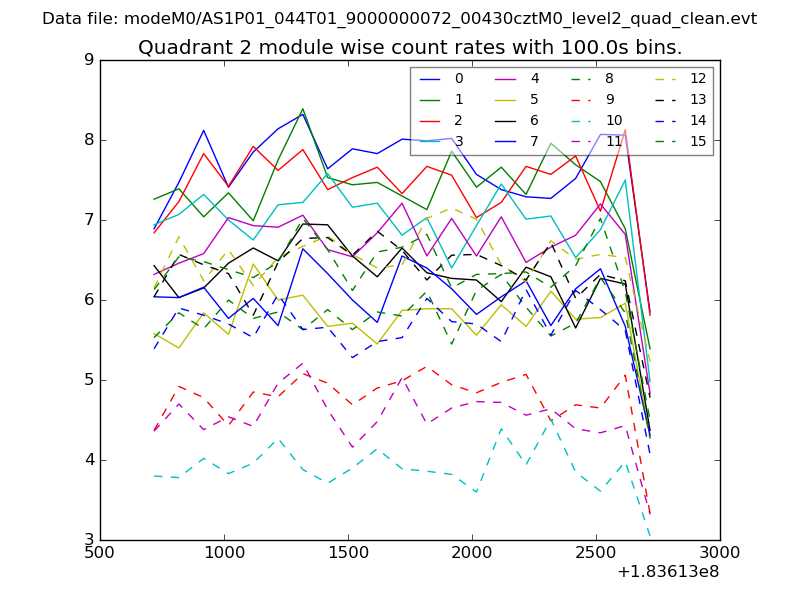
| Module-wise count rates for Quadrant B Data is divided into 100 sec bins |
 |
 |
| Module-wise count rates for Quadrant C Data is divided into 100 sec bins |
 |
 |
| Module-wise count rates for Quadrant D Data is divided into 100 sec bins |
 |
 |
| Parameter | Plot |
|---|---|
| CZT HV Monitor | 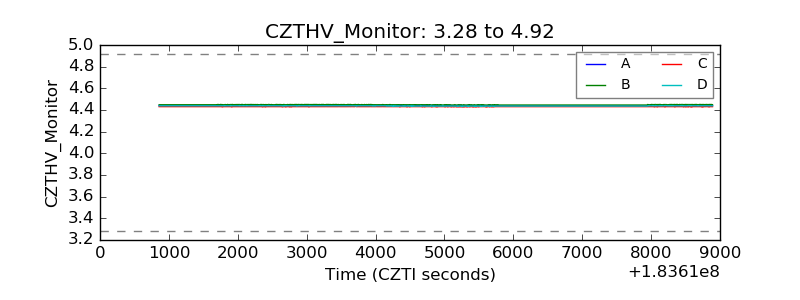 |
| D_VDD | 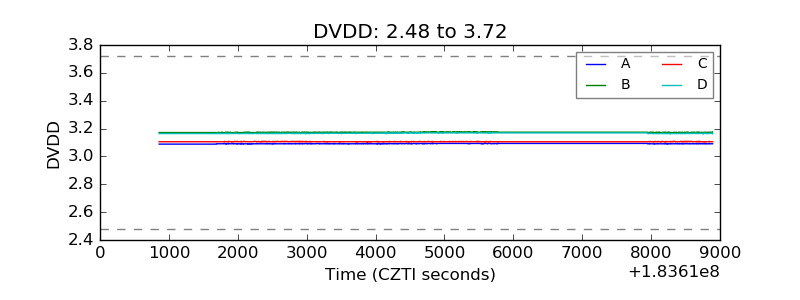 |
| Temperature 1 | 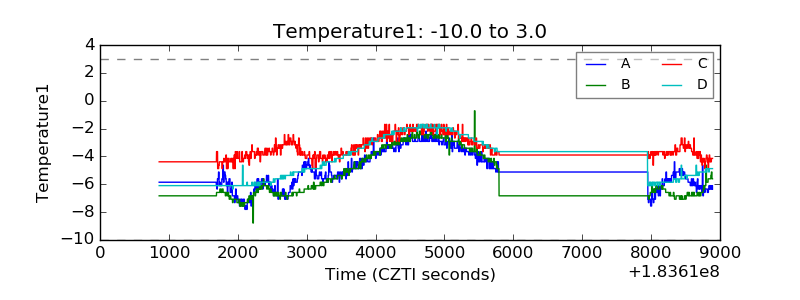 |
| Veto HV Monitor | 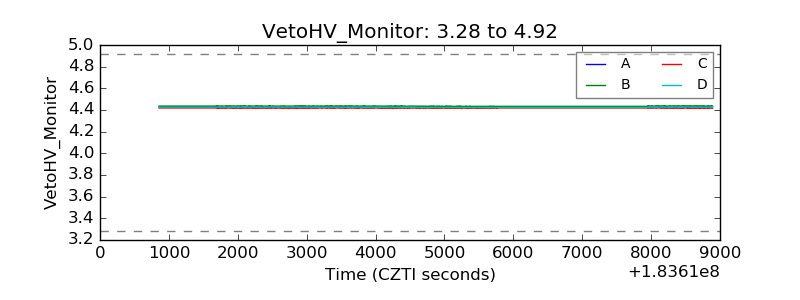 |
| Veto LLD | 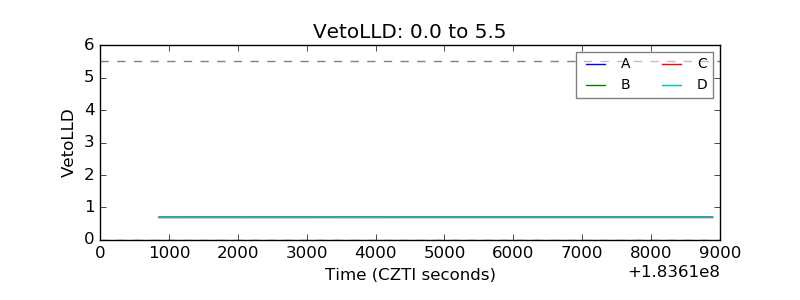 |
| Alpha Counter | 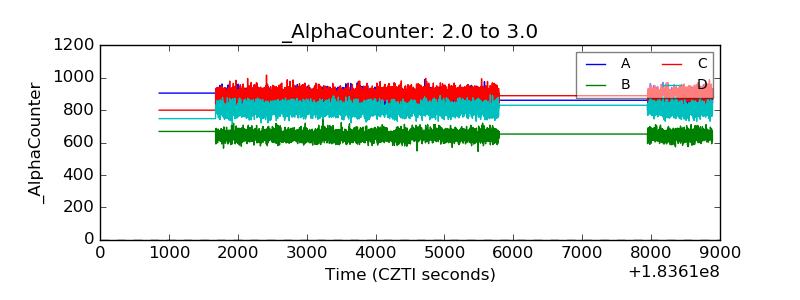 |
| _CPM_Rate | 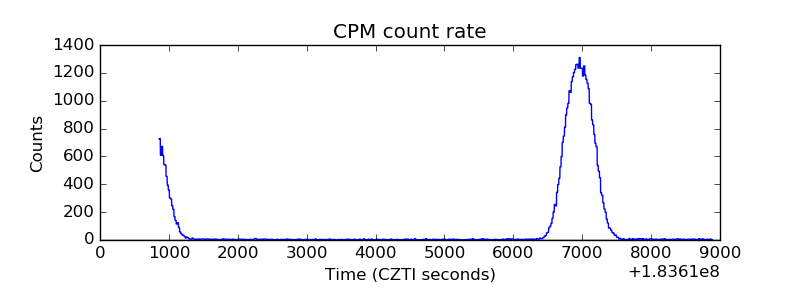 |
| CZT Counter | 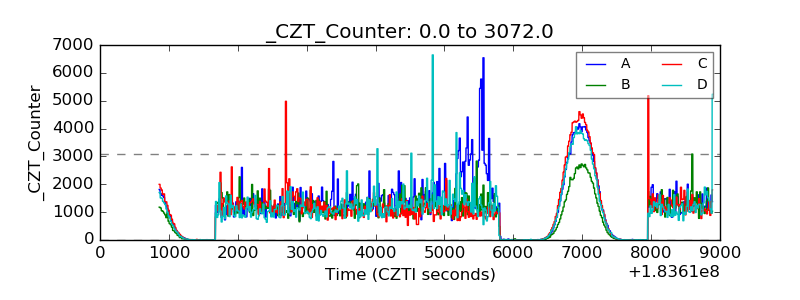 |
| +2.5 Volts monitor | 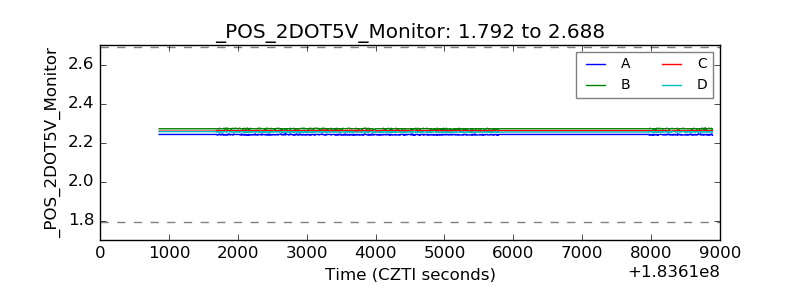 |
| +5 Volts monitor | 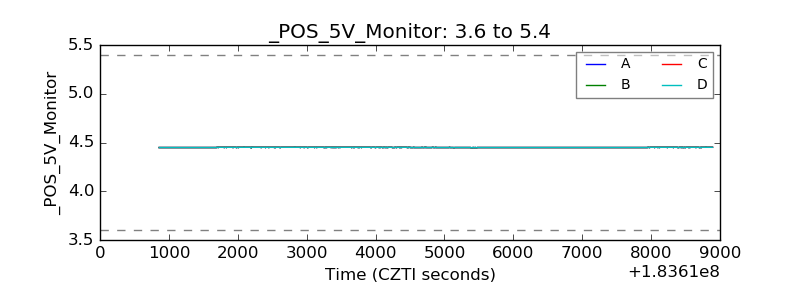 |
| _ROLL_ROT | 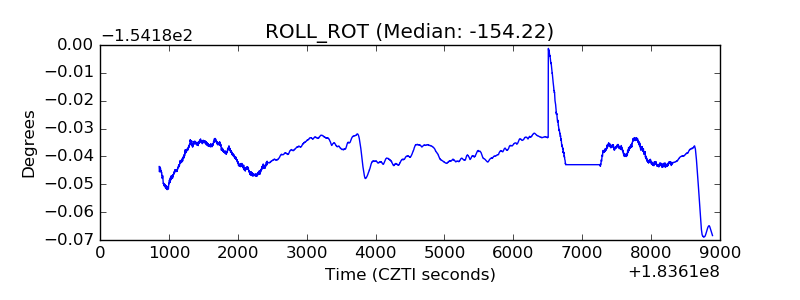 |
| _Roll_DEC | 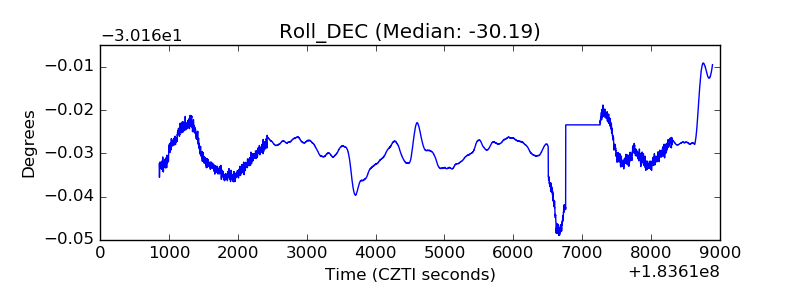 |
| _Roll_RA | 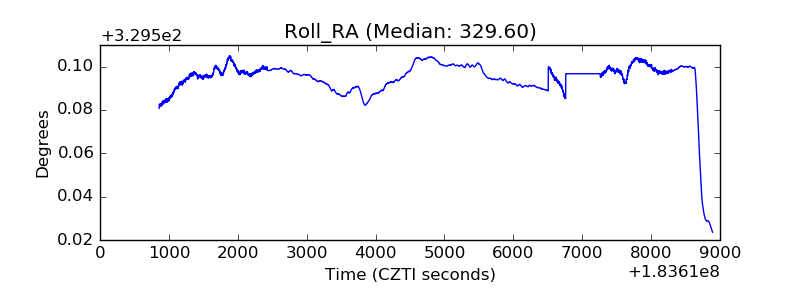 |
| Veto Counter | 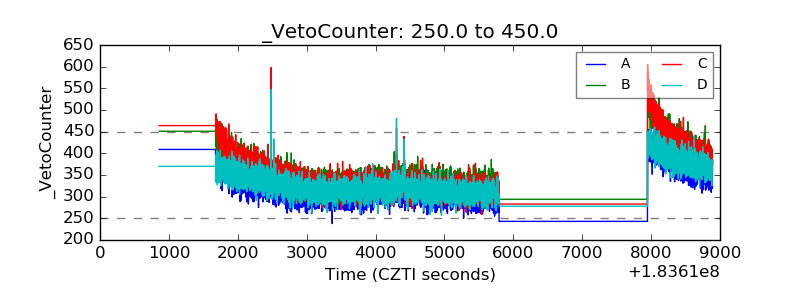 |