| Param | Original file | Final file |
|---|---|---|
| Filename | modeM0/AS1P01_044T01_9000000072_00441cztM0_level2.evt | modeM0/AS1P01_044T01_9000000072_00441cztM0_level2_quad_clean.evt |
| Size (bytes) | 756,933,120 | 45,959,040 |
| Size | 721.9 MB | 43.8 MB |
| Events in quadrant A | 5,943,162 | 262,181 |
| Events in quadrant B | 5,845,513 | 263,490 |
| Events in quadrant C | 5,461,048 | 257,965 |
| Events in quadrant D | 5,338,122 | 254,001 |
| Mode M9 | |||
|---|---|---|---|
| Quadrant | BADHDUFLAG | Total packets | Discarded packets |
| A | 0 | 21 | 0 |
| B | 0 | 21 | 0 |
| C | 0 | 21 | 0 |
| D | 0 | 21 | 0 |
| Mode M0 | |||
|---|---|---|---|
| Quadrant | BADHDUFLAG | Total packets | Discarded packets |
| A | 0 | 21284 | 46 |
| B | 0 | 20973 | 34 |
| C | 0 | 19841 | 12 |
| D | 0 | 19499 | 17 |
| Mode SS | |||
|---|---|---|---|
| Quadrant | BADHDUFLAG | Total packets | Discarded packets |
| A | 0 | 104 | 0 |
| B | 0 | 104 | 0 |
| C | 0 | 104 | 0 |
| D | 0 | 104 | 0 |
| Quadrant | Total seconds | Saturated seconds | Saturation percentage |
|---|---|---|---|
| A | 5033 | 11 | 0.218558% |
| B | 5035 | 1 | 0.019861% |
| C | 5042 | 1 | 0.019833% |
| D | 5039 | 34 | 0.674737% |
Noise dominated data is calculated using 1-second bins in cleaned event files. If a bin has >2000 counts, and if more than 50% of those come from <1% of pixels, then it is considered to be noise-dominated and hence unusable.
| Quadrant | # 1 sec bins | Bins with >0 counts | Bins with >2000 counts | High rate bins dominated by noise | Noise dominated (total time) | Noise dominated (detector-on time) | Marked lightcurve |
|---|---|---|---|---|---|---|---|
| A | 7201 | 5042 | 138 | 138 | 1.92% | 2.74% | 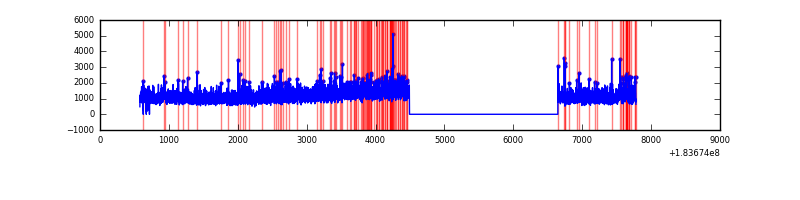 |
| B | 7201 | 5043 | 62 | 62 | 0.86% | 1.23% | 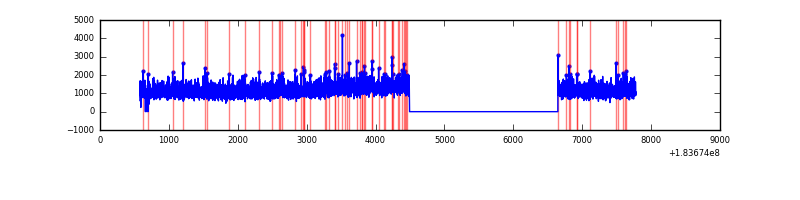 |
| C | 7201 | 5046 | 40 | 40 | 0.56% | 0.79% | 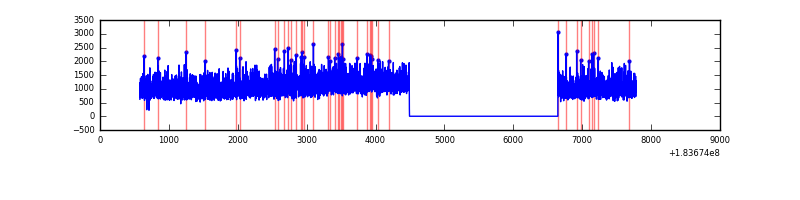 |
| D | 7201 | 5046 | 115 | 115 | 1.60% | 2.28% | 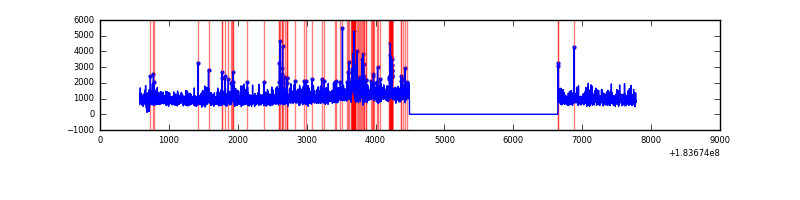 |
Top three noisy pixels from each quadrant. If the there are fewer than three noisy pixels in the level2.evt file, extra rows are filled as -1
| Pixel properties | Quadrant properties | ||||||
|---|---|---|---|---|---|---|---|
| Quadrant | DetID | PixID | Counts | Sigma | Mean | Median | Sigma |
| A | 0 | 69 | 88326 | 265.77 | 1474 | 1459 | 326.9 |
| A | 0 | 238 | 84608 | 254.39 | 1474 | 1459 | 326.9 |
| A | 8 | 192 | 47671 | 141.38 | 1474 | 1459 | 326.9 |
| B | 11 | 51 | 27044 | 72.72 | 1504 | 1511 | 351.1 |
| B | 0 | 220 | 18425 | 48.17 | 1504 | 1511 | 351.1 |
| B | 0 | 23 | 12286 | 30.69 | 1504 | 1511 | 351.1 |
| C | 10 | 38 | 30207 | 74.62 | 1379 | 1431 | 385.6 |
| C | 9 | 206 | 4969 | 9.17 | 1379 | 1431 | 385.6 |
| C | 9 | 241 | 4967 | 9.17 | 1379 | 1431 | 385.6 |
| D | 3 | 13 | 119011 | 304.53 | 1305 | 1345 | 386.4 |
| D | 4 | 114 | 59560 | 150.67 | 1305 | 1345 | 386.4 |
| D | 13 | 117 | 51352 | 129.42 | 1305 | 1345 | 386.4 |
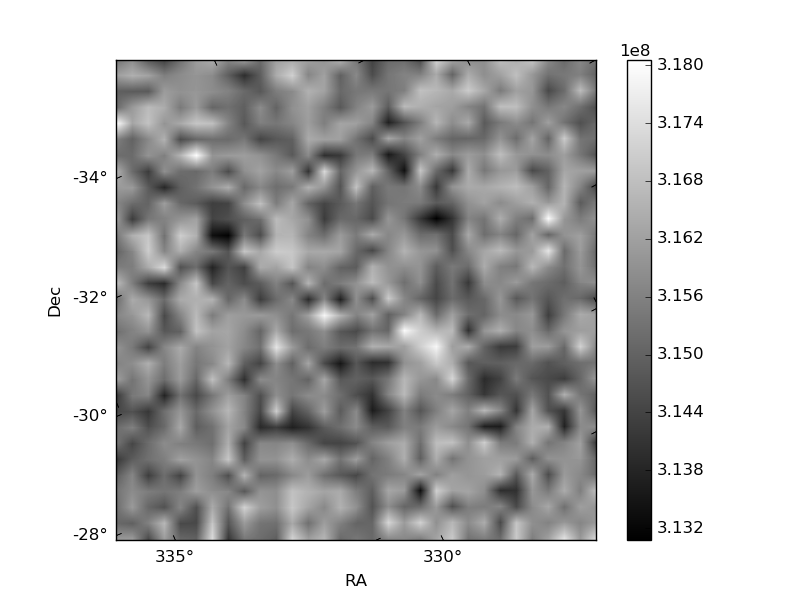
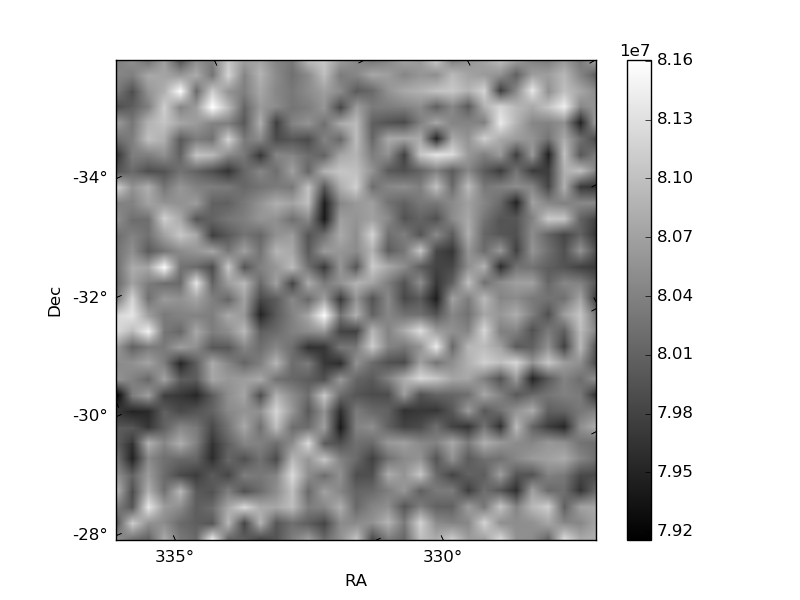
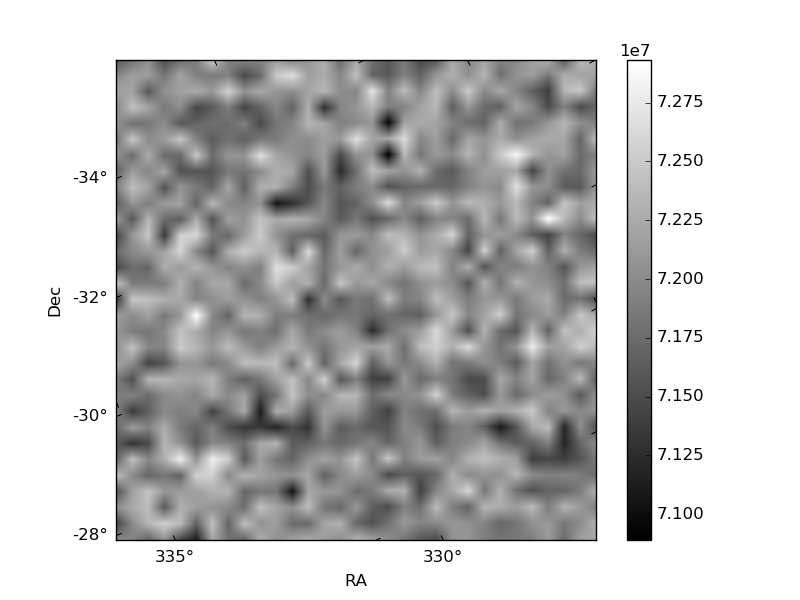
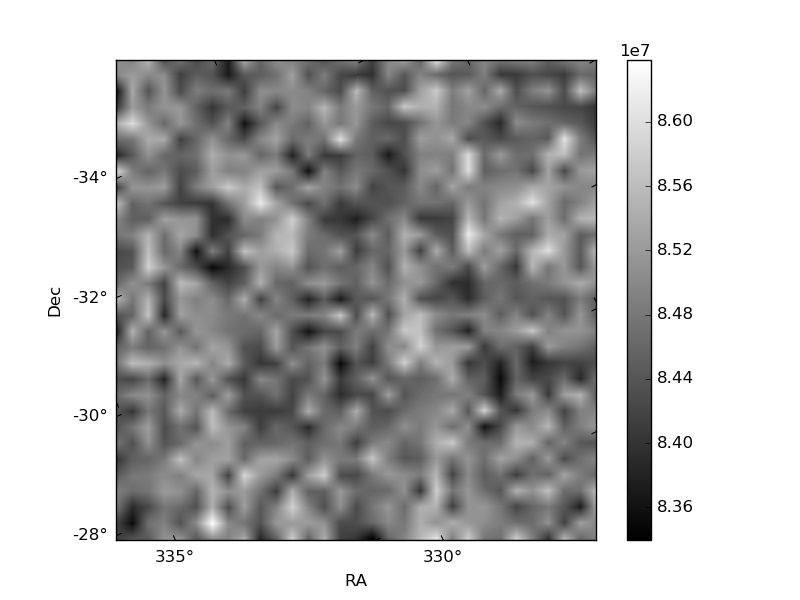
Histogram calculated using DETX and DETY for each event in the final _common_clean file
| Quadrant A | 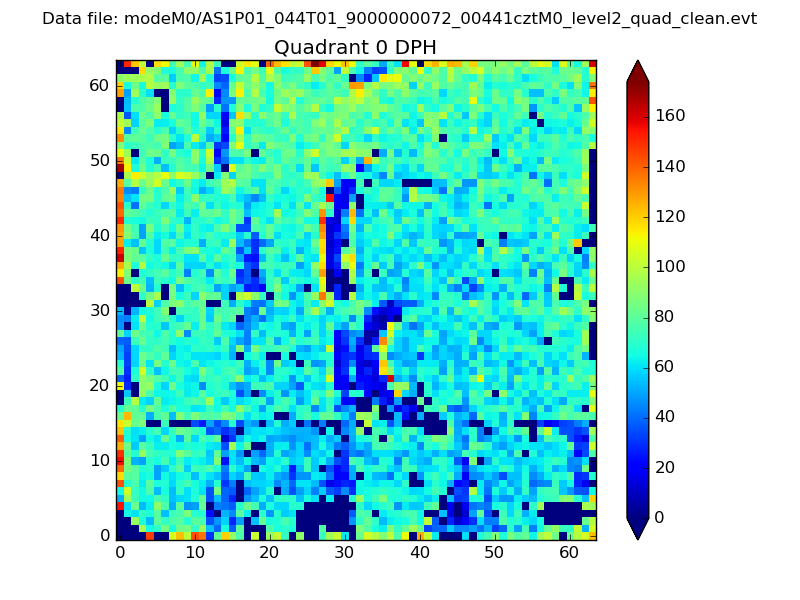 |
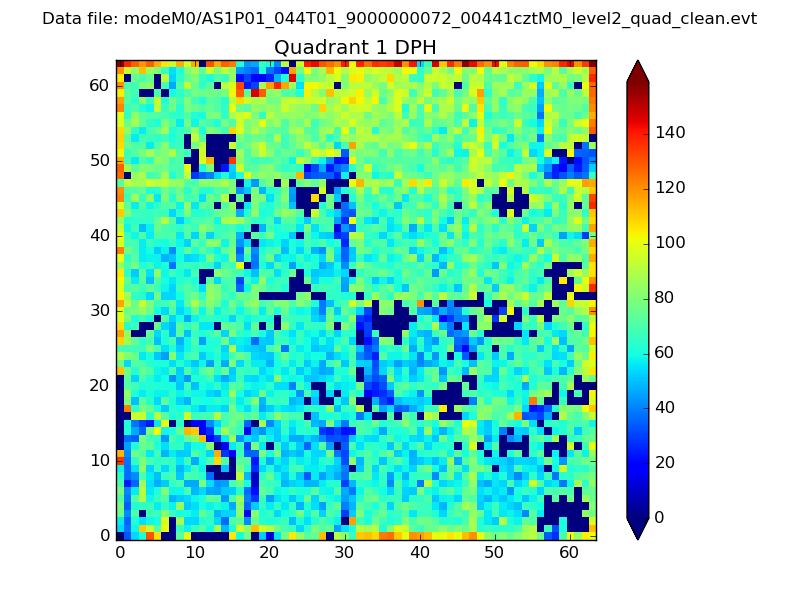 |
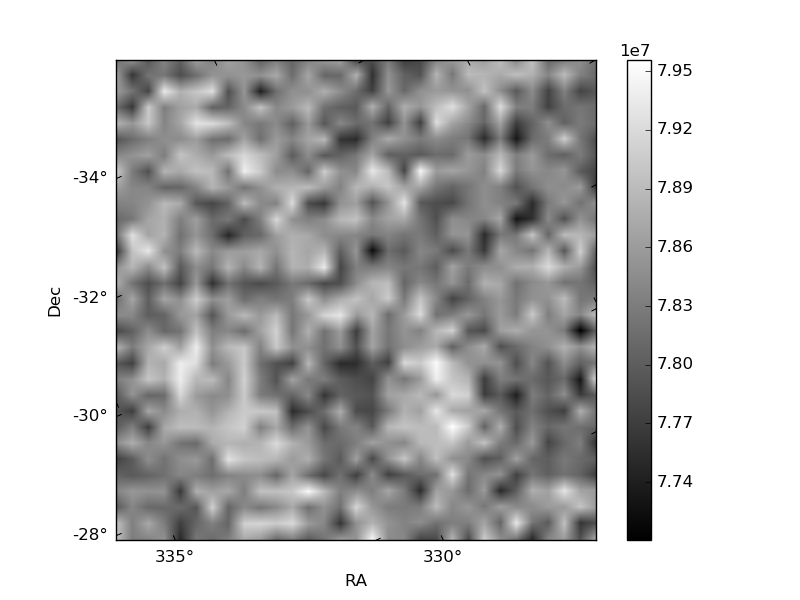
Quadrant B |
|---|---|---|---|
| Quadrant D | 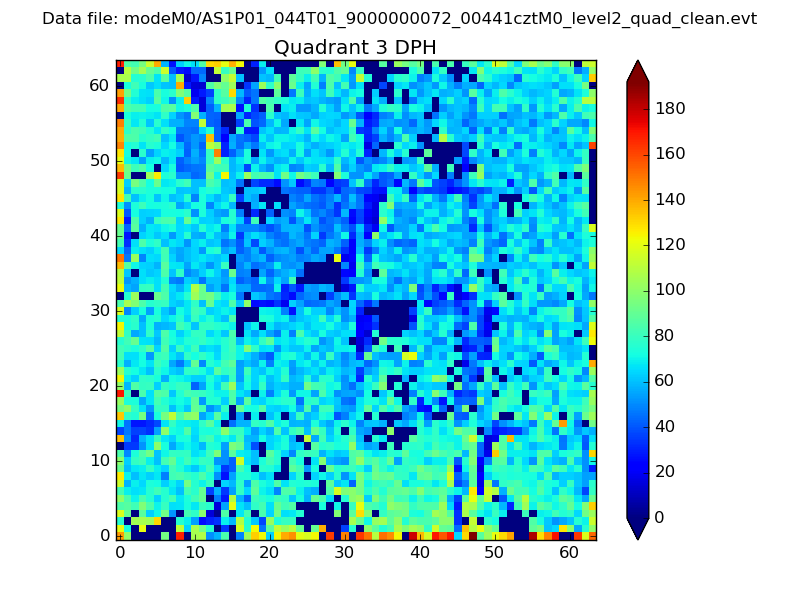 |
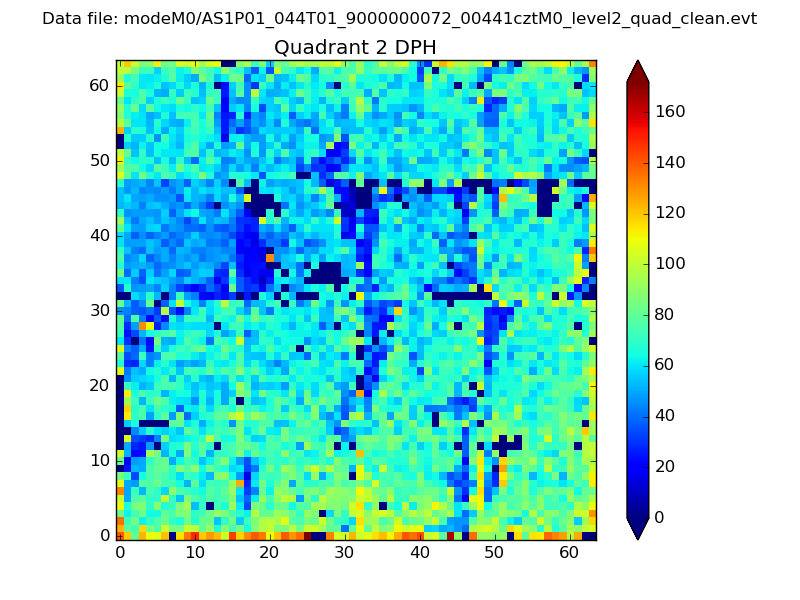 |
Quadrant C |
| Plot type | Count rate plots | Images |
|---|---|---|
| Comparison with Poisson distribution Blue bars denote a histogram of data divided into 1 sec bins. Red curve is a Poisson curve with rate = median count rate of data. |
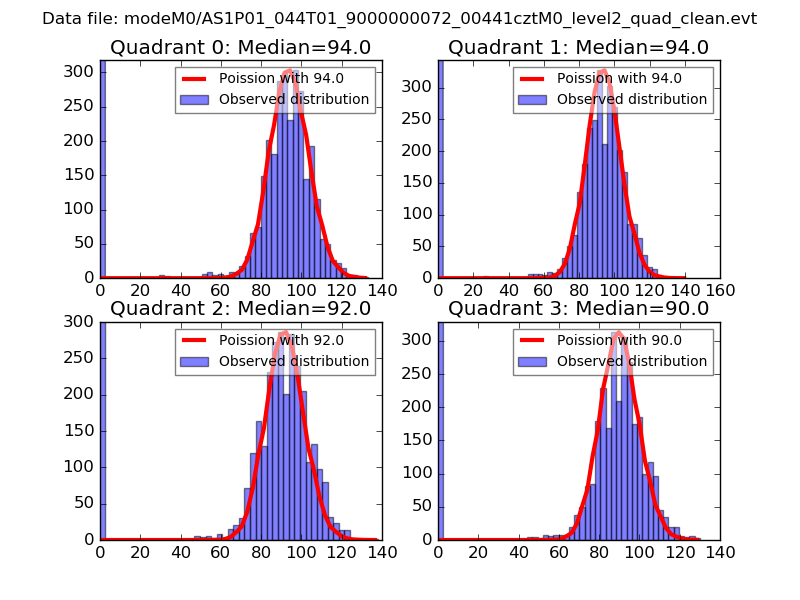 |
 |
| Quadrant-wise count rates Data is divided into 100 sec bins |
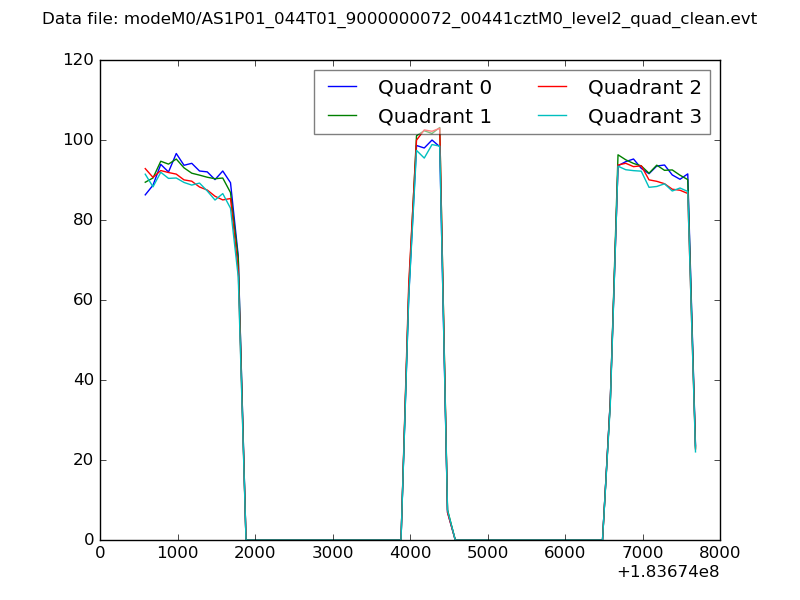 |
|
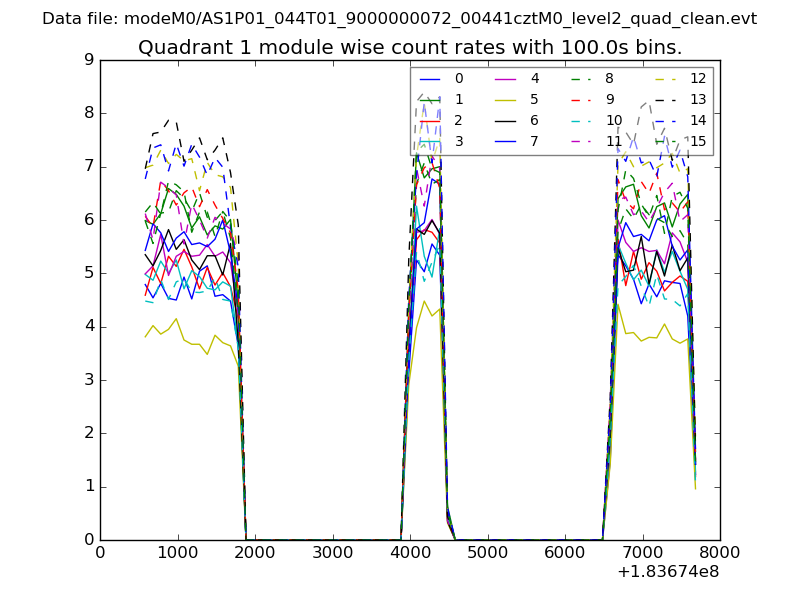
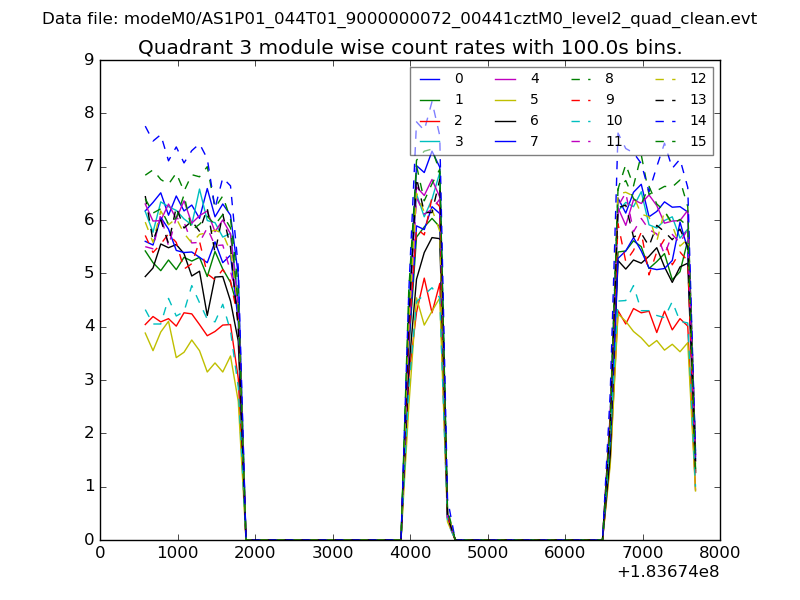
| Module-wise count rates for Quadrant A Data is divided into 100 sec bins |
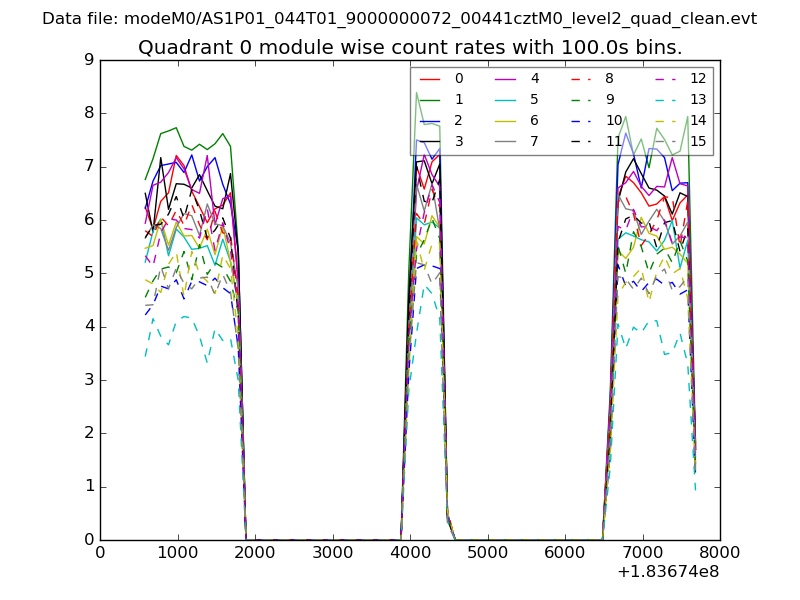 |
 |
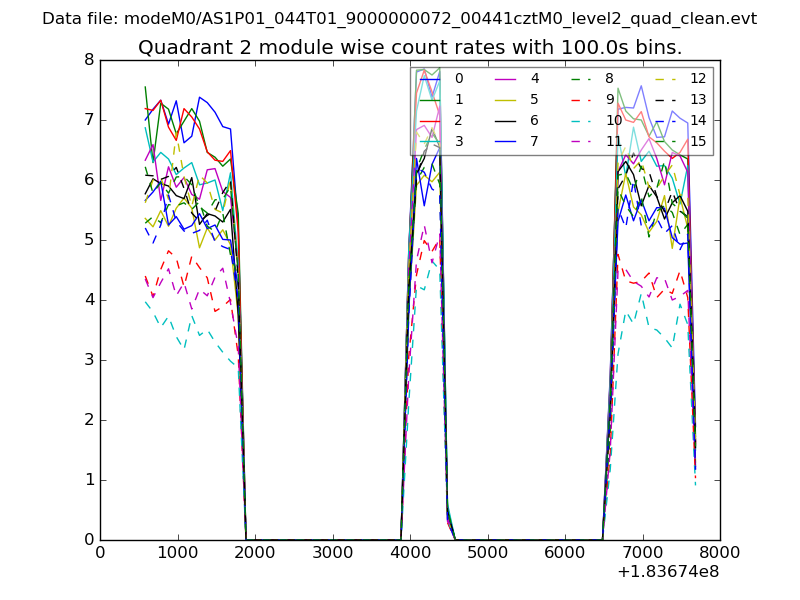
| Module-wise count rates for Quadrant B Data is divided into 100 sec bins |
 |
 |
| Module-wise count rates for Quadrant C Data is divided into 100 sec bins |
 |
 |
| Module-wise count rates for Quadrant D Data is divided into 100 sec bins |
 |
 |
| Parameter | Plot |
|---|---|
| CZT HV Monitor | 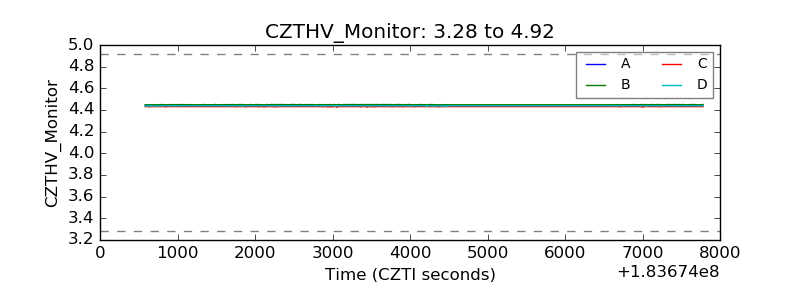 |
| D_VDD | 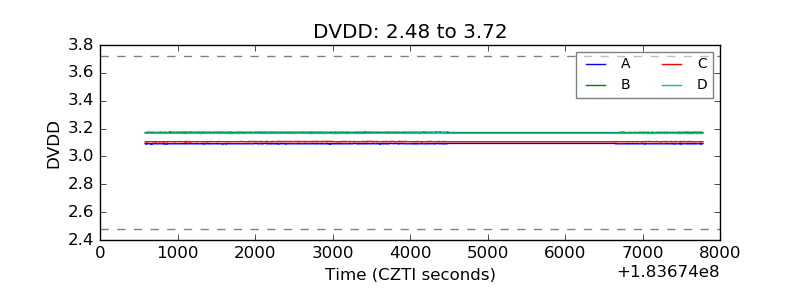 |
| Temperature 1 | 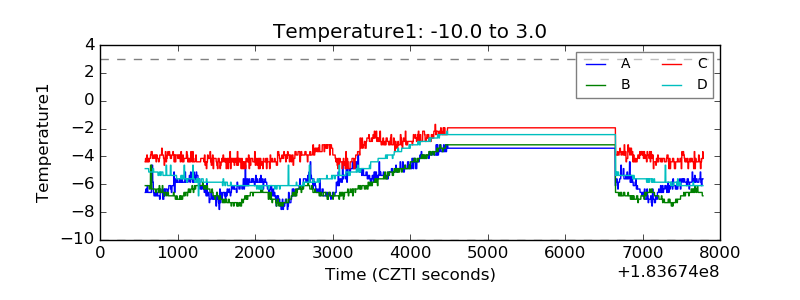 |
| Veto HV Monitor | 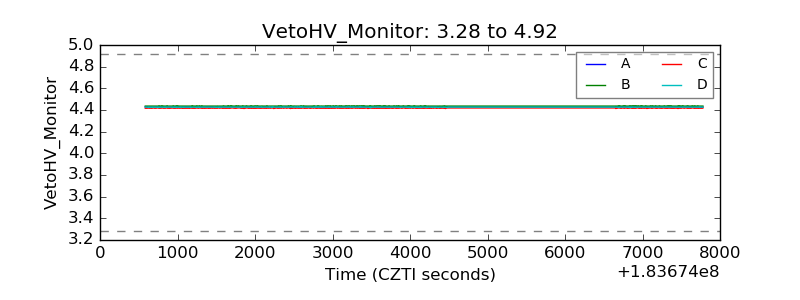 |
| Veto LLD | 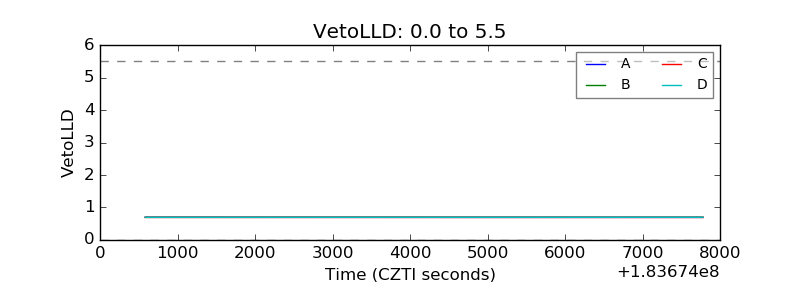 |
| Alpha Counter | 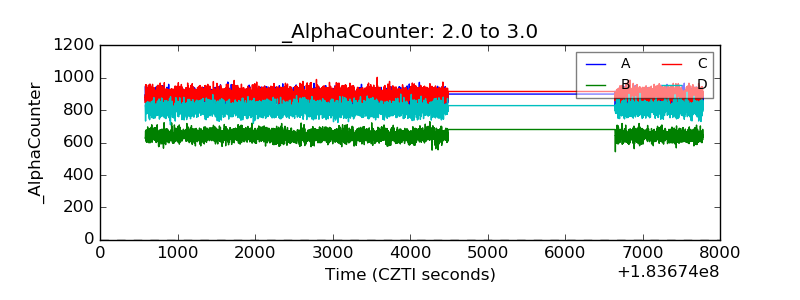 |
| _CPM_Rate | 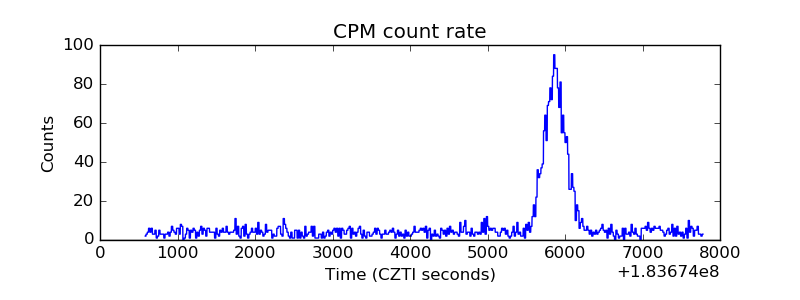 |
| CZT Counter | 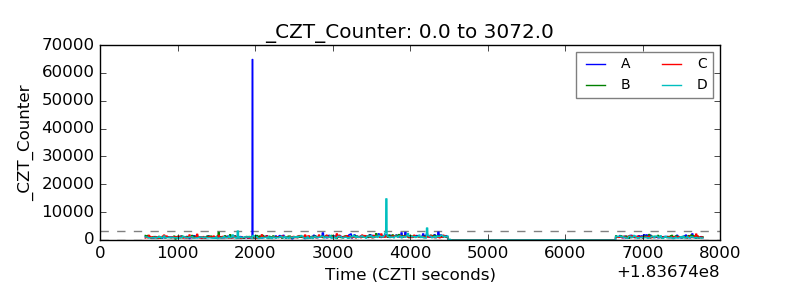 |
| +2.5 Volts monitor |  |
| +5 Volts monitor | 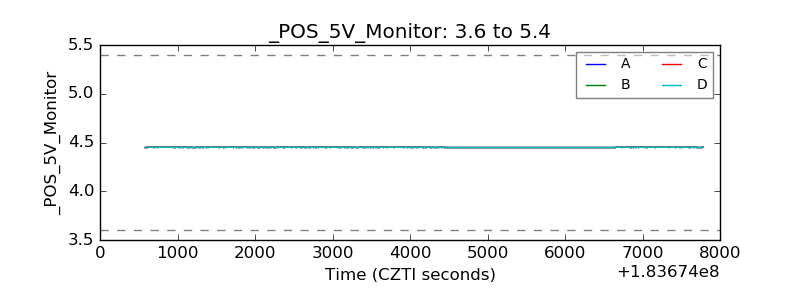 |
| _ROLL_ROT |  |
| _Roll_DEC | 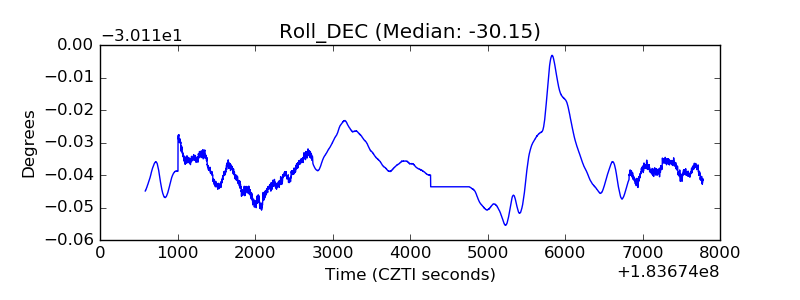 |
| _Roll_RA | 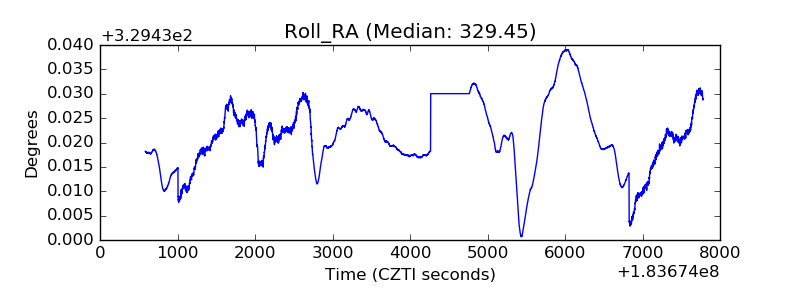 |
| Veto Counter | 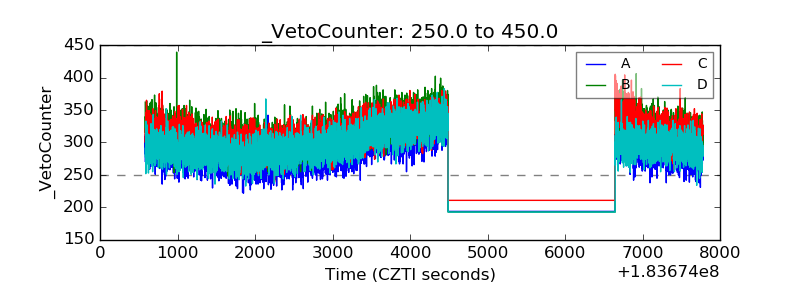 |