| Param | Original file | Final file |
|---|---|---|
| Filename | modeM0/AS1P01_044T01_9000000072_00549cztM0_level2.fits | modeM0/AS1P01_044T01_9000000072_00549cztM0_level2_quad_clean.evt |
| Size (bytes) | 572,947,200 | 71,519,040 |
| Size | 546.4 MB | 68.2 MB |
| Events in quadrant A | 5,263,715 | 479,527 |
| Events in quadrant B | 5,194,210 | 498,066 |
| Events in quadrant C | 5,016,753 | 467,293 |
| Events in quadrant D | 5,416,558 | 428,632 |
| Mode M9 | |||
|---|---|---|---|
| Quadrant | BADHDUFLAG | Total packets | Discarded packets |
| A | 0 | 27 | 0 |
| B | 0 | 27 | 0 |
| C | 0 | 27 | 0 |
| D | 0 | 28 | 0 |
| Mode M0 | |||
|---|---|---|---|
| Quadrant | BADHDUFLAG | Total packets | Discarded packets |
| A | 0 | 18561 | 1 |
| B | 0 | 18347 | 1 |
| C | 0 | 17822 | 1 |
| D | 0 | 19054 | 1 |
| Mode SS | |||
|---|---|---|---|
| Quadrant | BADHDUFLAG | Total packets | Discarded packets |
| A | 0 | 86 | 0 |
| B | 0 | 86 | 0 |
| C | 0 | 86 | 0 |
| D | 0 | 86 | 0 |
| Quadrant | Total seconds | Saturated seconds | Saturation percentage |
|---|---|---|---|
| A | 4146 | 2 | 0.048239% |
| B | 4146 | 3 | 0.072359% |
| C | 4146 | 41 | 0.988905% |
| D | 4146 | 65 | 1.567776% |
Noise dominated data is calculated using 1-second bins in cleaned event files. If a bin has >2000 counts, and if more than 50% of those come from <1% of pixels, then it is considered to be noise-dominated and hence unusable.
| Quadrant | # 1 sec bins | Bins with >0 counts | Bins with >2000 counts | High rate bins dominated by noise | Noise dominated (total time) | Noise dominated (detector-on time) | Marked lightcurve |
|---|---|---|---|---|---|---|---|
| A | 4146 | 4146 | 118 | 118 | 2.85% | 2.85% | 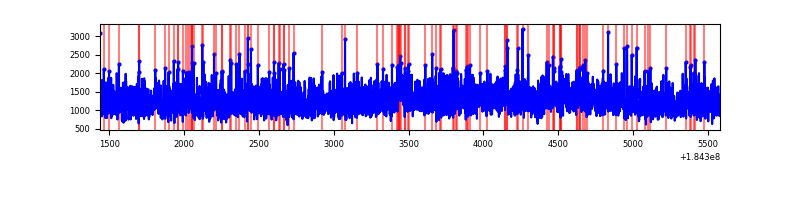 |
| B | 4146 | 4146 | 79 | 79 | 1.91% | 1.91% | 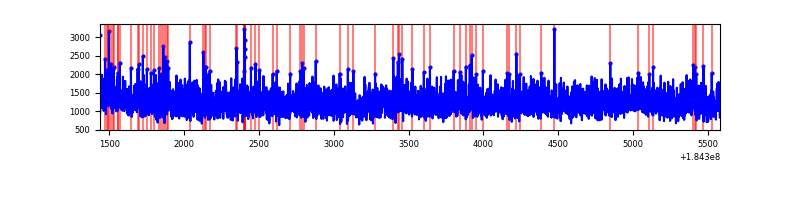 |
| C | 4146 | 4146 | 136 | 136 | 3.28% | 3.28% | 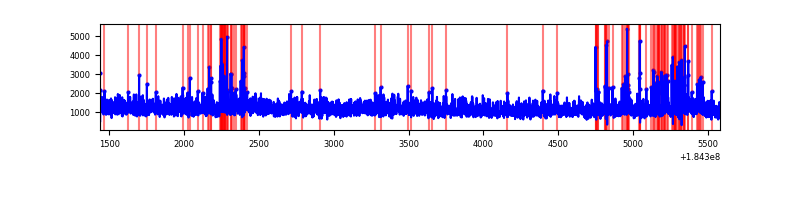 |
| D | 4146 | 4146 | 194 | 194 | 4.68% | 4.68% | 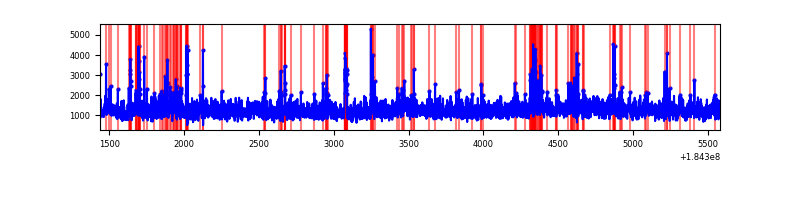 |
Top three noisy pixels from each quadrant. If the there are fewer than three noisy pixels in the level2.evt file, extra rows are filled as -1
| Pixel properties | Quadrant properties | ||||||
|---|---|---|---|---|---|---|---|
| Quadrant | DetID | PixID | Counts | Sigma | Mean | Median | Sigma |
| A | 0 | 238 | 72670 | 243.46 | 1334 | 1318 | 293.1 |
| A | 14 | 79 | 15920 | 49.82 | 1334 | 1318 | 293.1 |
| A | 13 | 160 | 12305 | 37.49 | 1334 | 1318 | 293.1 |
| B | 0 | 220 | 27686 | 84.77 | 1322 | 1330 | 310.9 |
| B | 4 | 206 | 23702 | 71.96 | 1322 | 1330 | 310.9 |
| B | 5 | 249 | 23036 | 69.81 | 1322 | 1330 | 310.9 |
| C | 3 | 159 | 314513 | 933.37 | 1191 | 1234 | 335.6 |
| C | 15 | 241 | 12761 | 34.34 | 1191 | 1234 | 335.6 |
| C | 10 | 38 | 12571 | 33.78 | 1191 | 1234 | 335.6 |
| D | 1 | 4 | 413185 | 1146.3 | 1166 | 1213 | 359.4 |
| D | 13 | 221 | 141926 | 391.53 | 1166 | 1213 | 359.4 |
| D | 1 | 5 | 122502 | 337.48 | 1166 | 1213 | 359.4 |
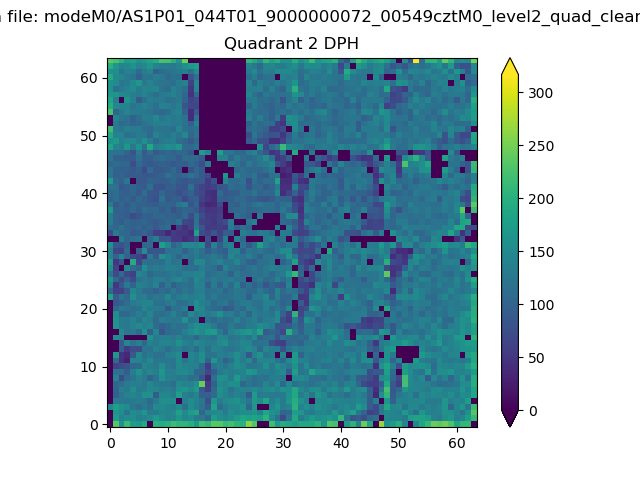
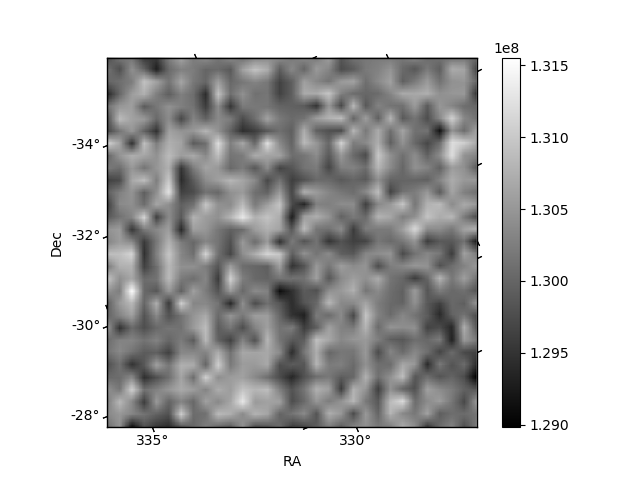
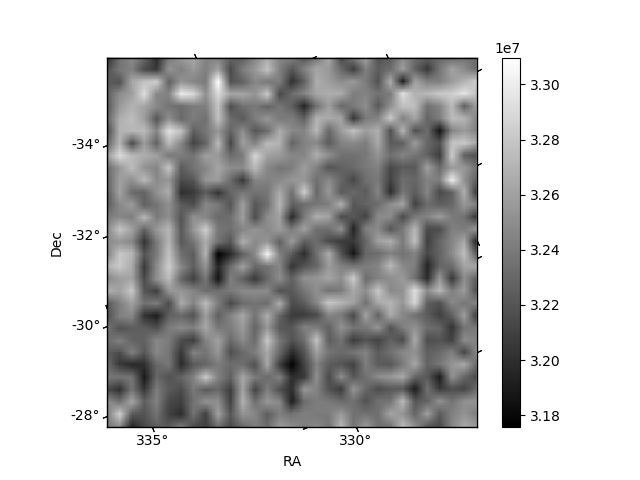
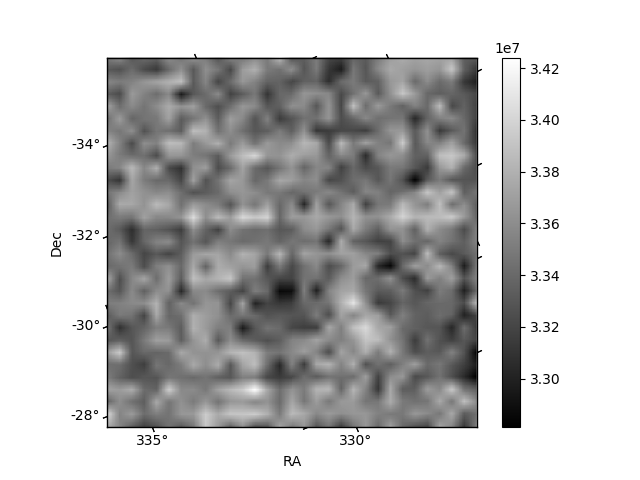
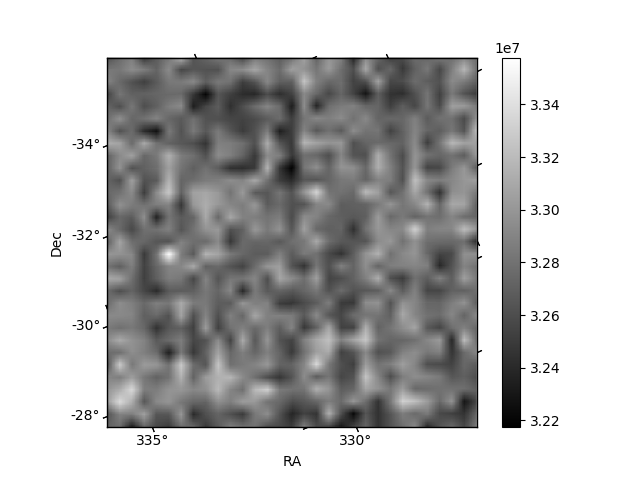
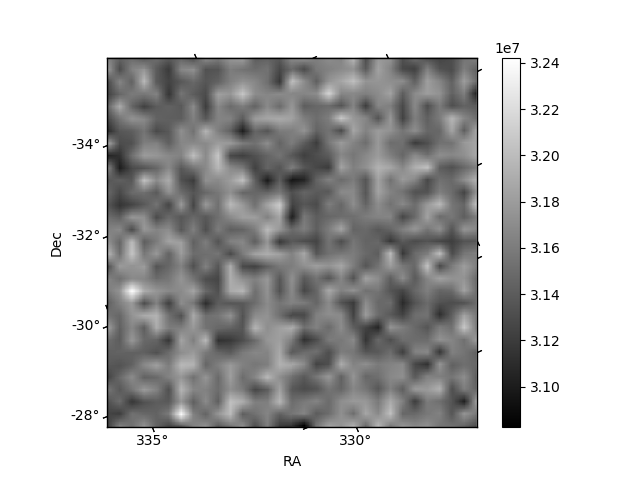
Histogram calculated using DETX and DETY for each event in the final _common_clean file
| Quadrant A | 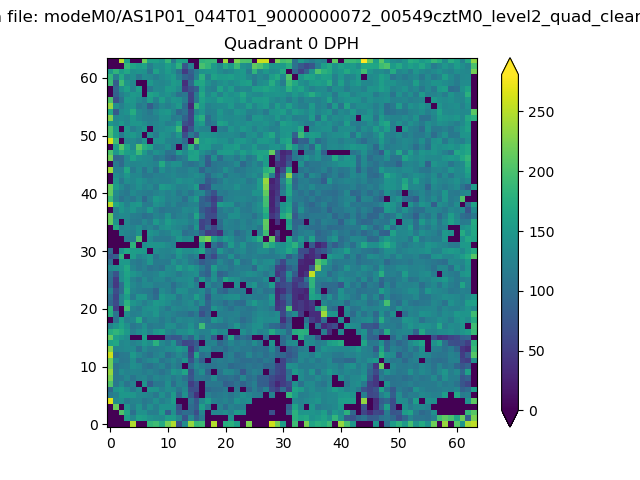 |
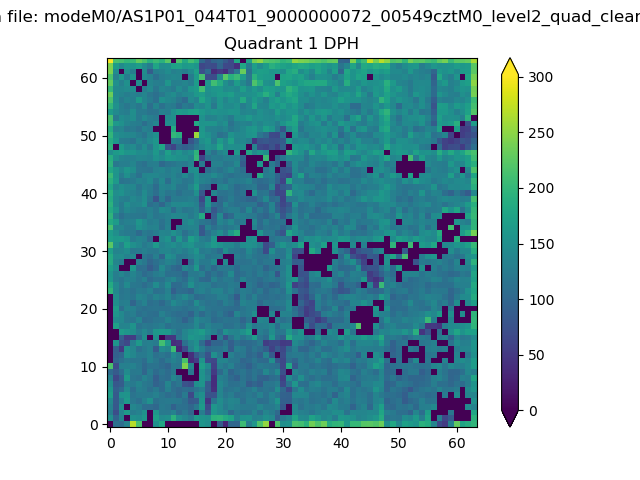 |
Quadrant B |
|---|---|---|---|
| Quadrant D | 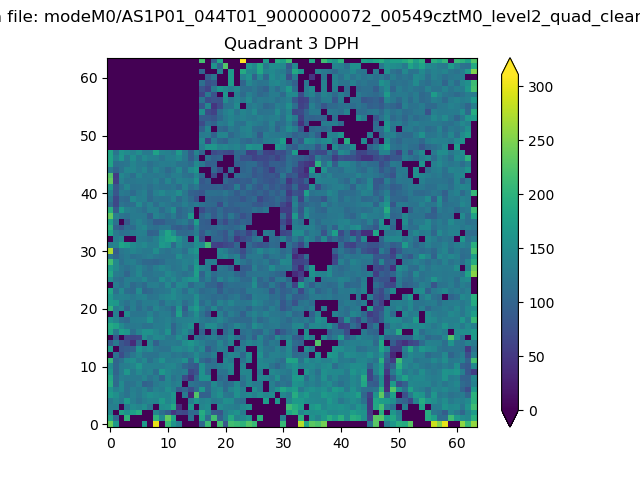 |
 |
Quadrant C |
| Plot type | Count rate plots | Images |
|---|---|---|
| Comparison with Poisson distribution Blue bars denote a histogram of data divided into 1 sec bins. Red curve is a Poisson curve with rate = median count rate of data. |
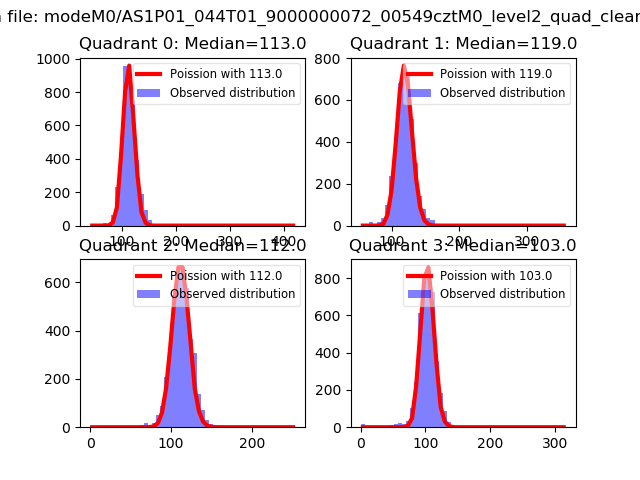 |
 |
| Quadrant-wise count rates Data is divided into 100 sec bins |
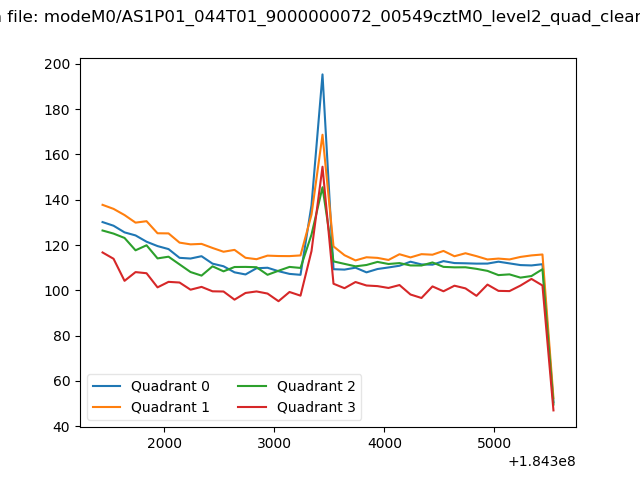 |
|
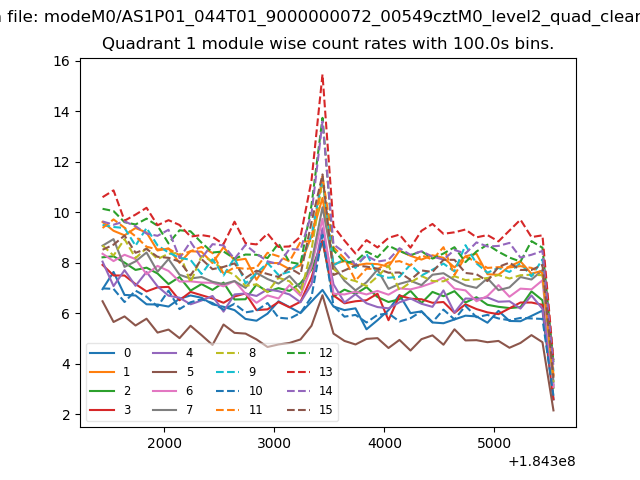
| Module-wise count rates for Quadrant A Data is divided into 100 sec bins |
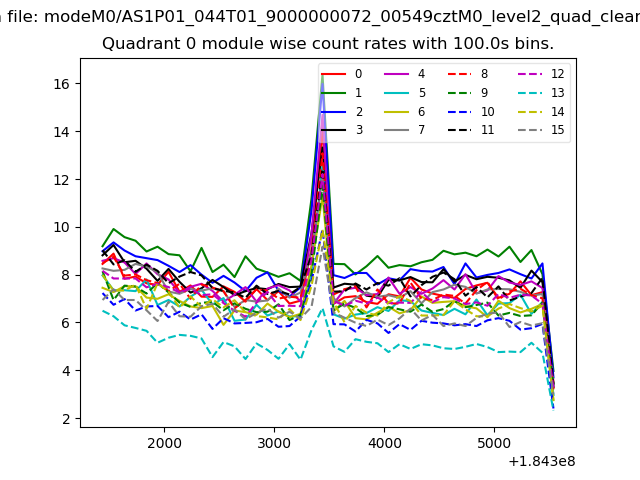 |
 |
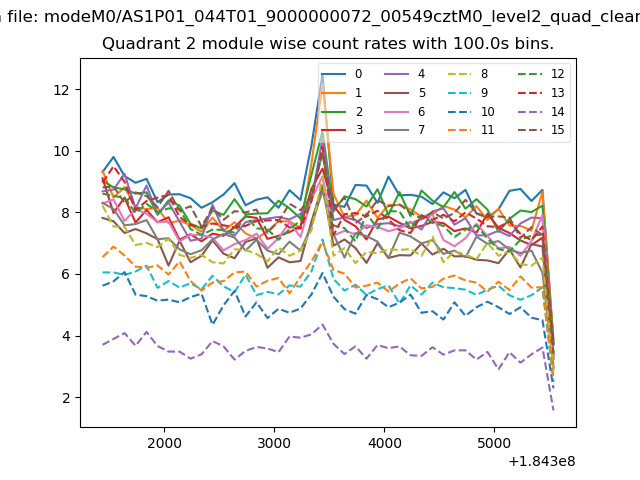
| Module-wise count rates for Quadrant B Data is divided into 100 sec bins |
 |
 |
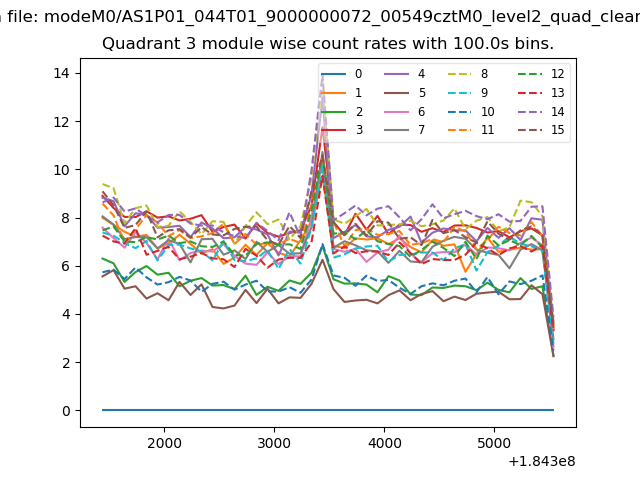
| Module-wise count rates for Quadrant C Data is divided into 100 sec bins |
 |
 |
| Module-wise count rates for Quadrant D Data is divided into 100 sec bins |
 |
 |
| Parameter | Plot |
|---|---|
| CZT HV Monitor | 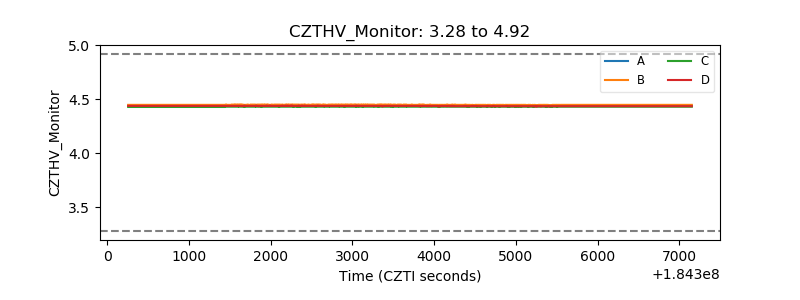 |
| D_VDD | 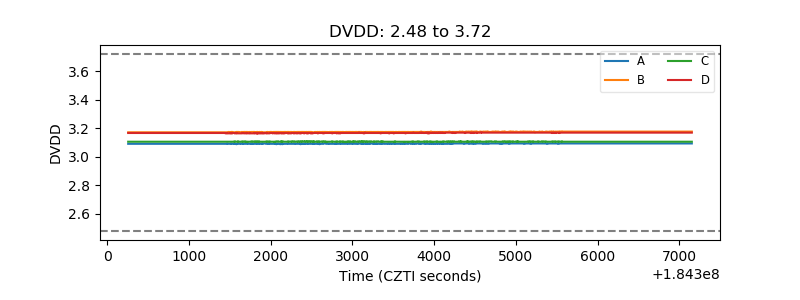 |
| Temperature 1 | 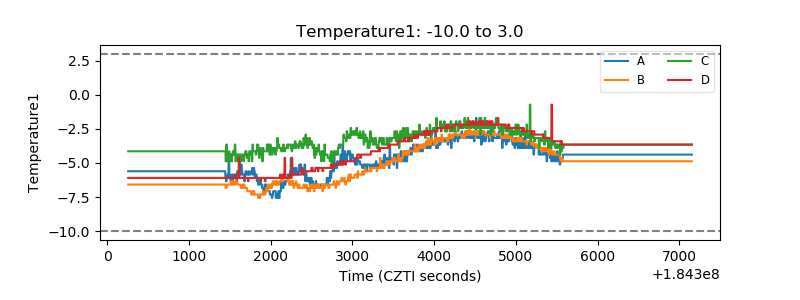 |
| Veto HV Monitor | 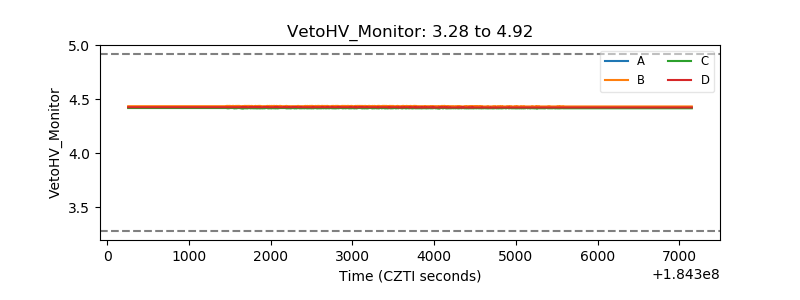 |
| Veto LLD | 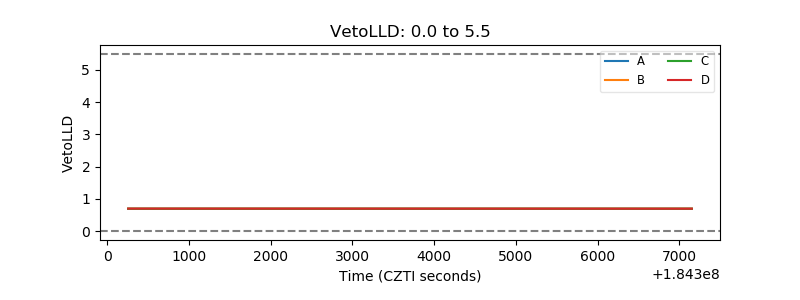 |
| Alpha Counter | 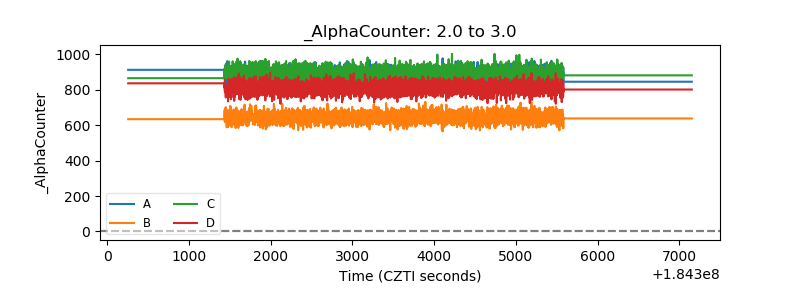 |
| _CPM_Rate | 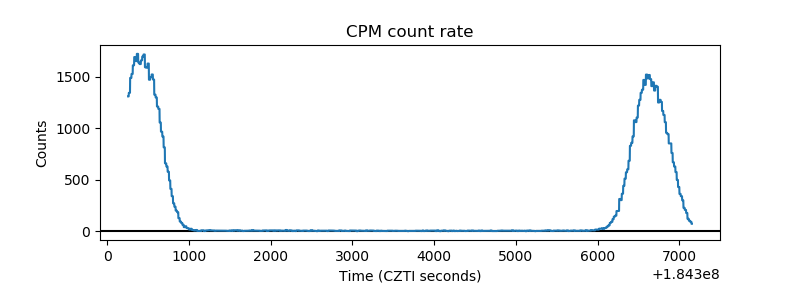 |
| CZT Counter | 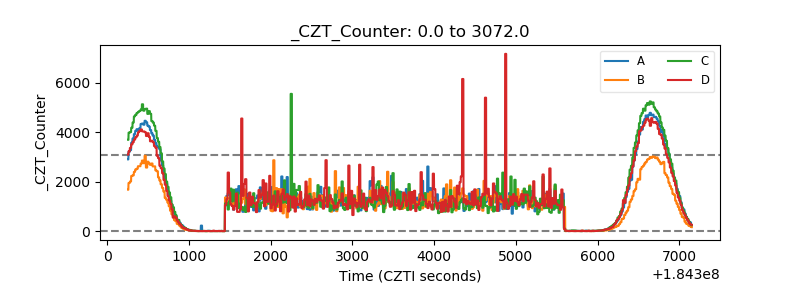 |
| +2.5 Volts monitor |  |
| +5 Volts monitor |  |
| _ROLL_ROT | 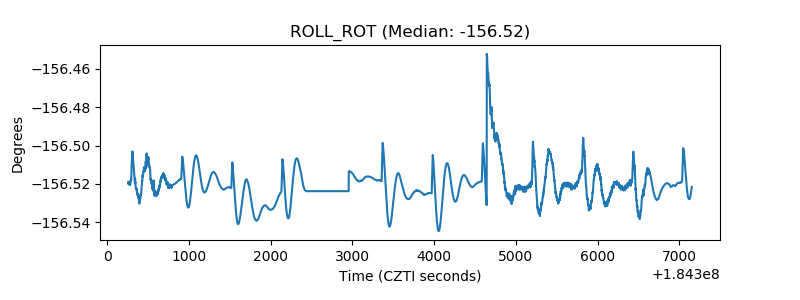 |
| _Roll_DEC | 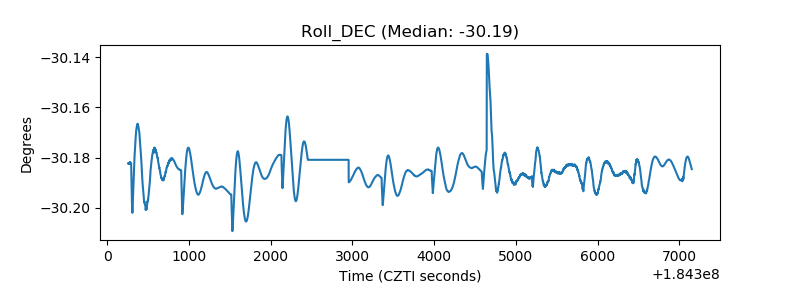 |
| _Roll_RA | 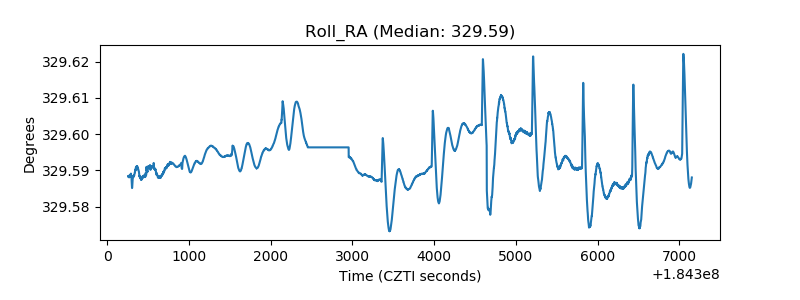 |
| Veto Counter | 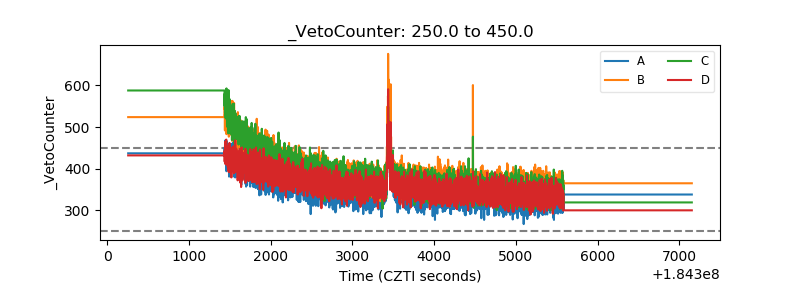 |