| Param | Original file | Final file |
|---|---|---|
| Filename | modeM0/AS1P01_015T01_9000000074cztM0_level2.fits | modeM0/AS1P01_015T01_9000000074cztM0_level2_quad_clean.evt |
| Size (bytes) | 196,505,280 | 187,715,520 |
| Size | 187.4 MB | 179.0 MB |
| Events in quadrant A | 1,123,504 | 1,049,983 |
| Events in quadrant B | 1,128,836 | 1,066,758 |
| Events in quadrant C | 1,121,566 | 1,014,007 |
| Events in quadrant D | 949,646 | 925,720 |
| Mode M9 | |||
|---|---|---|---|
| Quadrant | BADHDUFLAG | Total packets | Discarded packets |
| A | 0 | 128 | 0 |
| B | 0 | 128 | 0 |
| C | 0 | 128 | 0 |
| D | 0 | 128 | 0 |
| Mode M0 | |||
|---|---|---|---|
| Quadrant | BADHDUFLAG | Total packets | Discarded packets |
| A | 0 | 104264 | 0 |
| B | 0 | 102163 | 0 |
| C | 0 | 97023 | 0 |
| D | 0 | 104694 | 0 |
| Mode SS | |||
|---|---|---|---|
| Quadrant | BADHDUFLAG | Total packets | Discarded packets |
| A | 0 | 484 | 0 |
| B | 0 | 484 | 0 |
| C | 0 | 484 | 0 |
| D | 0 | 484 | 0 |
| Quadrant | Total seconds | Saturated seconds | Saturation percentage |
|---|---|---|---|
| A | 23658 | 46 | 0.194437% |
| B | 23658 | 83 | 0.350833% |
| C | 23658 | 83 | 0.350833% |
| D | 23658 | 249 | 1.052498% |
Noise dominated data is calculated using 1-second bins in cleaned event files. If a bin has >2000 counts, and if more than 50% of those come from <1% of pixels, then it is considered to be noise-dominated and hence unusable.
| Quadrant | # 1 sec bins | Bins with >0 counts | Bins with >2000 counts | High rate bins dominated by noise | Noise dominated (total time) | Noise dominated (detector-on time) | Marked lightcurve |
|---|---|---|---|---|---|---|---|
| A | 34432 | 23657 | 0 | 0 | 0.00% | 0.00% |  |
| B | 34432 | 23657 | 0 | 0 | 0.00% | 0.00% |  |
| C | 34432 | 23657 | 0 | 0 | 0.00% | 0.00% |  |
| D | 34432 | 23652 | 0 | 0 | 0.00% | 0.00% |  |
Top three noisy pixels from each quadrant. If the there are fewer than three noisy pixels in the level2.evt file, extra rows are filled as -1
| Pixel properties | Quadrant properties | ||||||
|---|---|---|---|---|---|---|---|
| Quadrant | DetID | PixID | Counts | Sigma | Mean | Median | Sigma |
| A | 7 | 110 | 1102 | 11.88 | 291 | 273 | 69.8 |
| A | 0 | 29 | 990 | 10.27 | 291 | 273 | 69.8 |
| A | 14 | 249 | 805 | 7.62 | 291 | 273 | 69.8 |
| B | 2 | 9 | 993 | 12.91 | 297 | 284 | 54.9 |
| B | 14 | 254 | 792 | 9.25 | 297 | 284 | 54.9 |
| B | 2 | 8 | 728 | 8.08 | 297 | 284 | 54.9 |
| C | 1 | 81 | 768 | 6.69 | 296 | 275 | 73.7 |
| C | 3 | 187 | 744 | 6.36 | 296 | 275 | 73.7 |
| C | 2 | 191 | 744 | 6.36 | 296 | 275 | 73.7 |
| D | 11 | 82 | 732 | 7.3 | 271 | 248 | 66.3 |
| D | 6 | 231 | 729 | 7.25 | 271 | 248 | 66.3 |
| D | 6 | 44 | 695 | 6.74 | 271 | 248 | 66.3 |
Histogram calculated using DETX and DETY for each event in the final _common_clean file
| Quadrant A |  |
 |
Quadrant B |
|---|---|---|---|
| Quadrant D |  |
 |
Quadrant C |
| Plot type | Count rate plots | Images |
|---|---|---|
| Comparison with Poisson distribution Blue bars denote a histogram of data divided into 1 sec bins. Red curve is a Poisson curve with rate = median count rate of data. |
 |
 |
| Quadrant-wise count rates Data is divided into 100 sec bins |
 |
|
| Module-wise count rates for Quadrant A Data is divided into 100 sec bins |
 |
 |
| Module-wise count rates for Quadrant B Data is divided into 100 sec bins |
 |
 |
| Module-wise count rates for Quadrant C Data is divided into 100 sec bins |
 |
 |
| Module-wise count rates for Quadrant D Data is divided into 100 sec bins |
 |
 |
| Parameter | Plot |
|---|---|
| CZT HV Monitor |  |
| D_VDD | 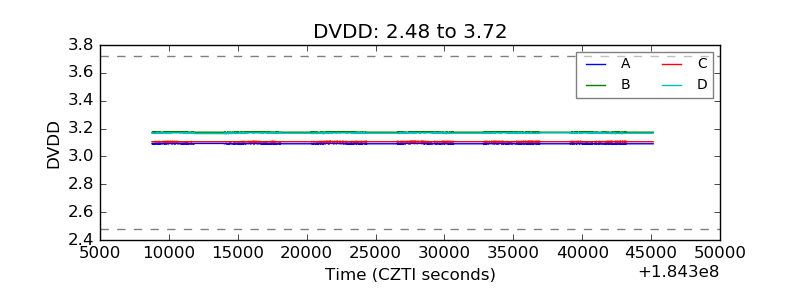 |
| Temperature 1 |  |
| Veto HV Monitor |  |
| Veto LLD |  |
| Alpha Counter |  |
| _CPM_Rate |  |
| CZT Counter |  |
| +2.5 Volts monitor |  |
| +5 Volts monitor |  |
| _ROLL_ROT |  |
| _Roll_DEC |  |
| _Roll_RA |  |
| Veto Counter |  |