| Param | Original file | Final file |
|---|---|---|
| Filename | modeM0/AS1P01_015T01_9000000074_00550cztM0_level2.evt | modeM0/AS1P01_015T01_9000000074_00550cztM0_level2_quad_clean.evt |
| Size (bytes) | 648,809,280 | 31,884,480 |
| Size | 618.8 MB | 30.4 MB |
| Events in quadrant A | 5,109,584 | 173,646 |
| Events in quadrant B | 4,859,413 | 171,153 |
| Events in quadrant C | 4,605,768 | 174,813 |
| Events in quadrant D | 4,810,742 | 165,796 |
| Mode M9 | |||
|---|---|---|---|
| Quadrant | BADHDUFLAG | Total packets | Discarded packets |
| A | 0 | 22 | 0 |
| B | 0 | 22 | 0 |
| C | 0 | 22 | 0 |
| D | 0 | 22 | 0 |
| Mode M0 | |||
|---|---|---|---|
| Quadrant | BADHDUFLAG | Total packets | Discarded packets |
| A | 0 | 18029 | 2 |
| B | 0 | 17225 | 1 |
| C | 0 | 16487 | 1 |
| D | 0 | 17114 | 1 |
| Mode SS | |||
|---|---|---|---|
| Quadrant | BADHDUFLAG | Total packets | Discarded packets |
| A | 0 | 80 | 0 |
| B | 0 | 80 | 0 |
| C | 0 | 80 | 0 |
| D | 0 | 80 | 0 |
| Quadrant | Total seconds | Saturated seconds | Saturation percentage |
|---|---|---|---|
| A | 3961 | 6 | 0.151477% |
| B | 3961 | 2 | 0.050492% |
| C | 3961 | 12 | 0.302954% |
| D | 3961 | 27 | 0.681646% |
Noise dominated data is calculated using 1-second bins in cleaned event files. If a bin has >2000 counts, and if more than 50% of those come from <1% of pixels, then it is considered to be noise-dominated and hence unusable.
| Quadrant | # 1 sec bins | Bins with >0 counts | Bins with >2000 counts | High rate bins dominated by noise | Noise dominated (total time) | Noise dominated (detector-on time) | Marked lightcurve |
|---|---|---|---|---|---|---|---|
| A | 6116 | 3962 | 135 | 135 | 2.21% | 3.41% | 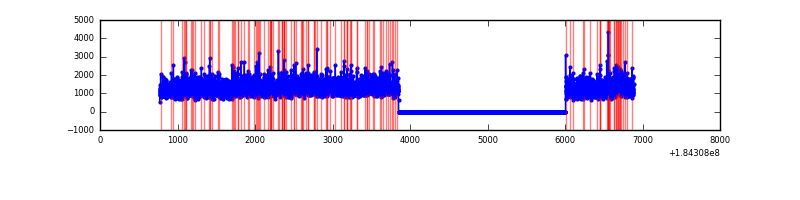 |
| B | 6116 | 3962 | 63 | 63 | 1.03% | 1.59% | 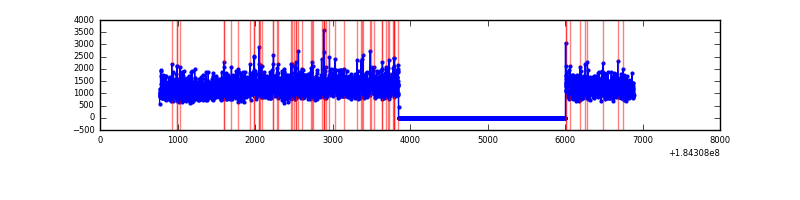 |
| C | 6116 | 3962 | 72 | 72 | 1.18% | 1.82% | 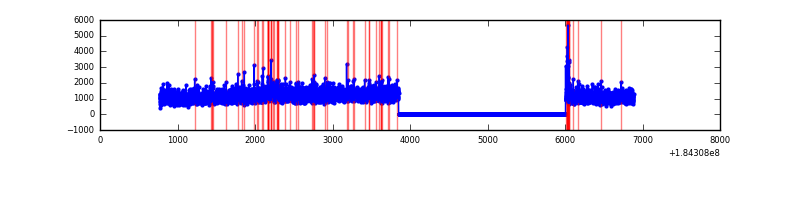 |
| D | 6116 | 3962 | 103 | 103 | 1.68% | 2.60% | 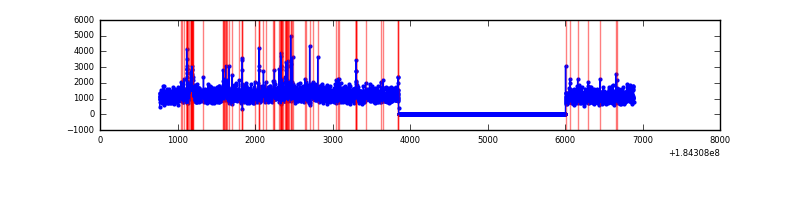 |
Top three noisy pixels from each quadrant. If the there are fewer than three noisy pixels in the level2.evt file, extra rows are filled as -1
| Pixel properties | Quadrant properties | ||||||
|---|---|---|---|---|---|---|---|
| Quadrant | DetID | PixID | Counts | Sigma | Mean | Median | Sigma |
| A | 0 | 238 | 63974 | 220.49 | 1278 | 1263 | 284.4 |
| A | 13 | 160 | 31316 | 105.67 | 1278 | 1263 | 284.4 |
| A | 14 | 79 | 27489 | 92.21 | 1278 | 1263 | 284.4 |
| B | 5 | 46 | 21207 | 68.59 | 1242 | 1250 | 291.0 |
| B | 8 | 4 | 20792 | 67.16 | 1242 | 1250 | 291.0 |
| B | 15 | 185 | 19685 | 63.36 | 1242 | 1250 | 291.0 |
| C | 3 | 159 | 84538 | 261.89 | 1144 | 1187 | 318.3 |
| C | 15 | 241 | 12027 | 34.06 | 1144 | 1187 | 318.3 |
| C | 9 | 206 | 7980 | 21.34 | 1144 | 1187 | 318.3 |
| D | 1 | 4 | 160713 | 457.26 | 1127 | 1168 | 348.9 |
| D | 13 | 221 | 80626 | 227.73 | 1127 | 1168 | 348.9 |
| D | 13 | 216 | 57864 | 162.49 | 1127 | 1168 | 348.9 |
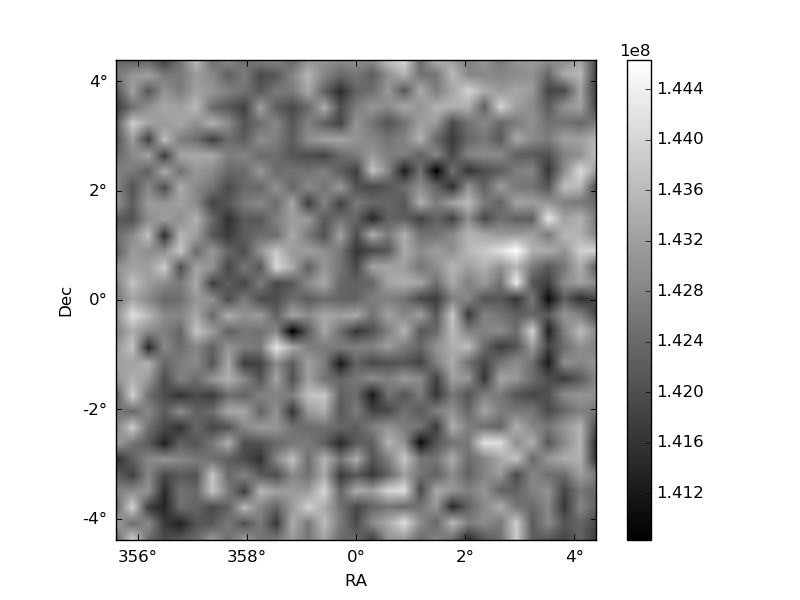
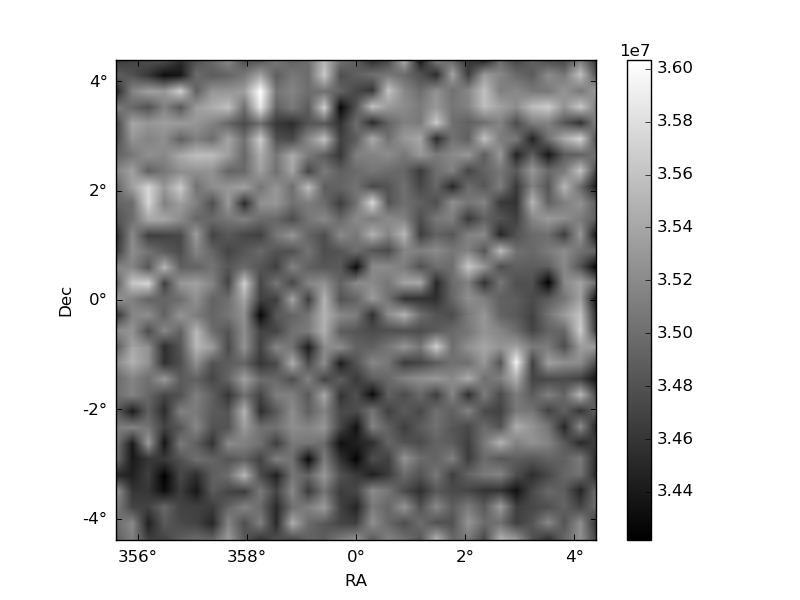
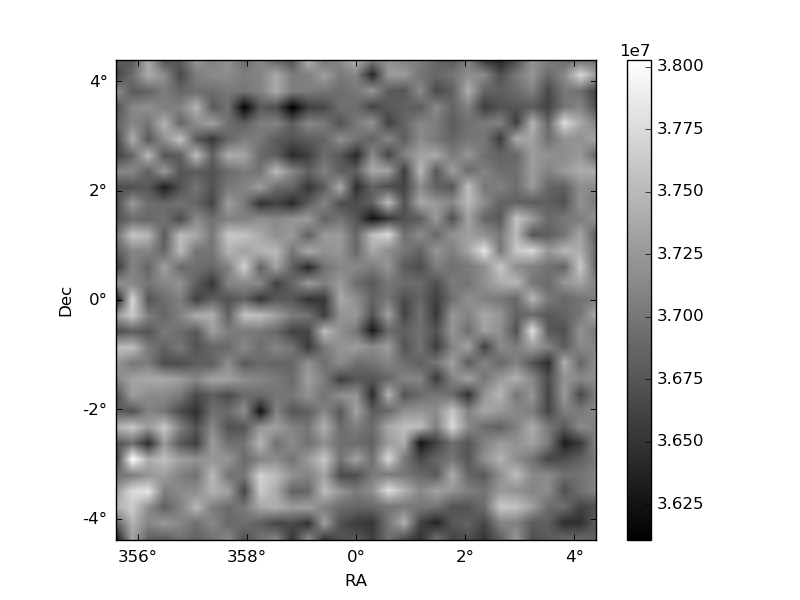
Histogram calculated using DETX and DETY for each event in the final _common_clean file
| Quadrant A | 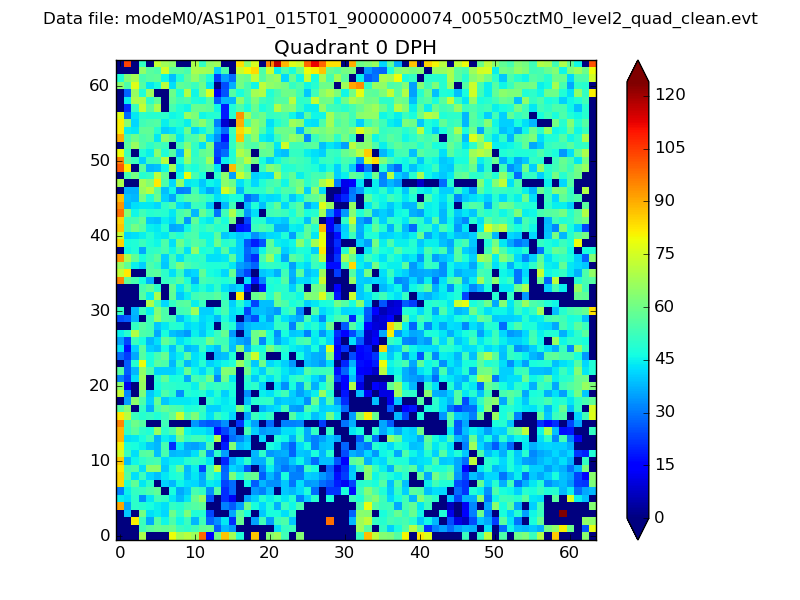 |
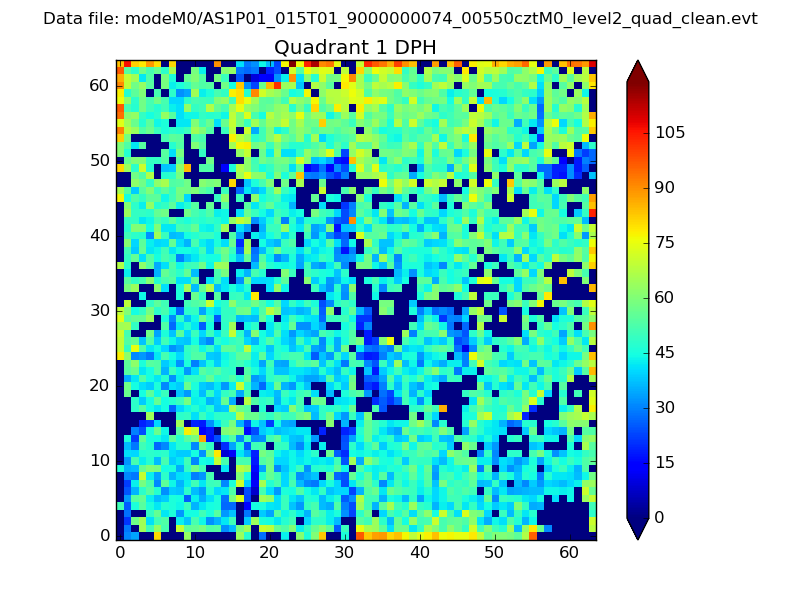 |
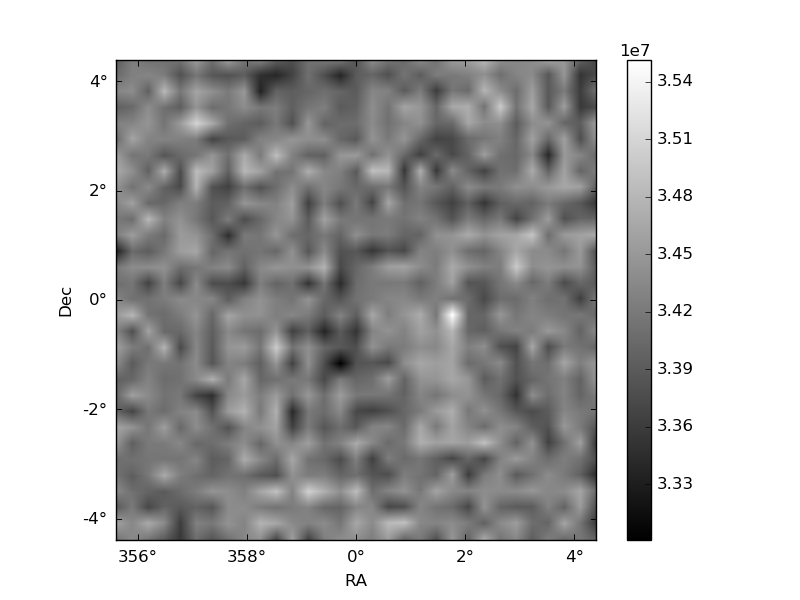
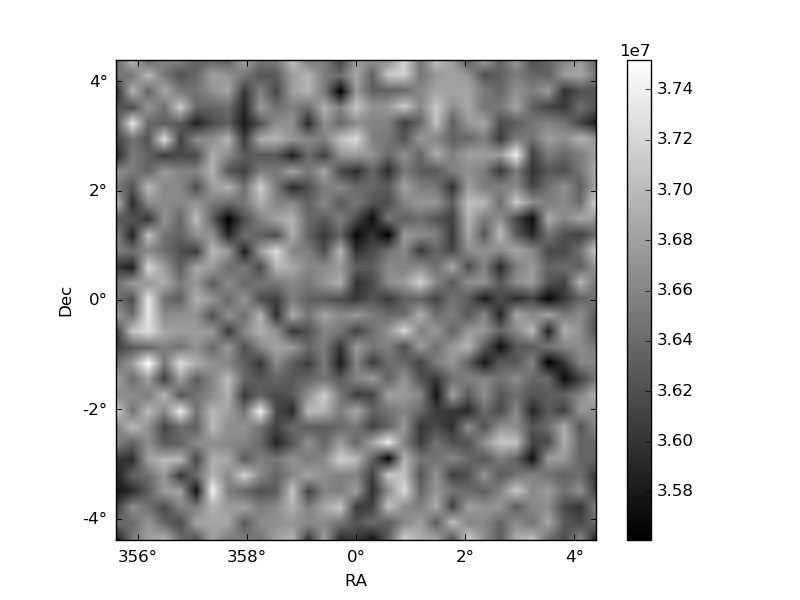
Quadrant B |
|---|---|---|---|
| Quadrant D | 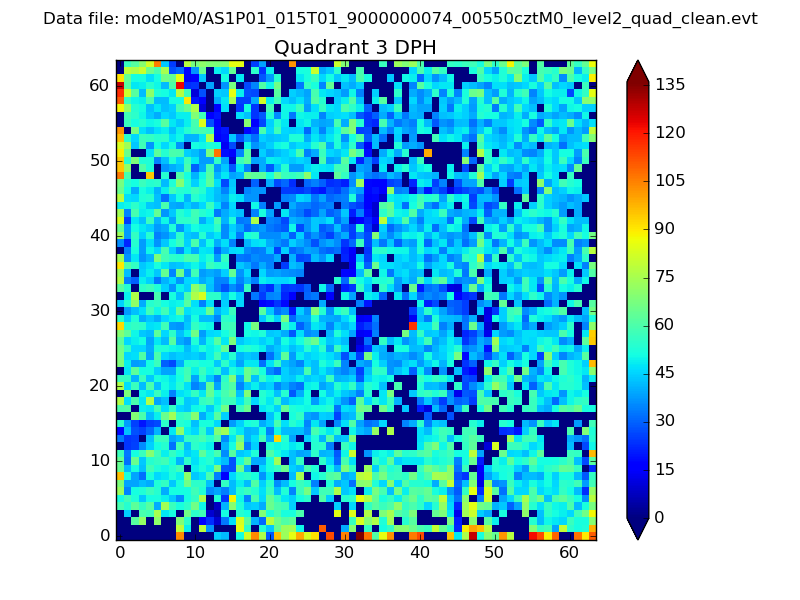 |
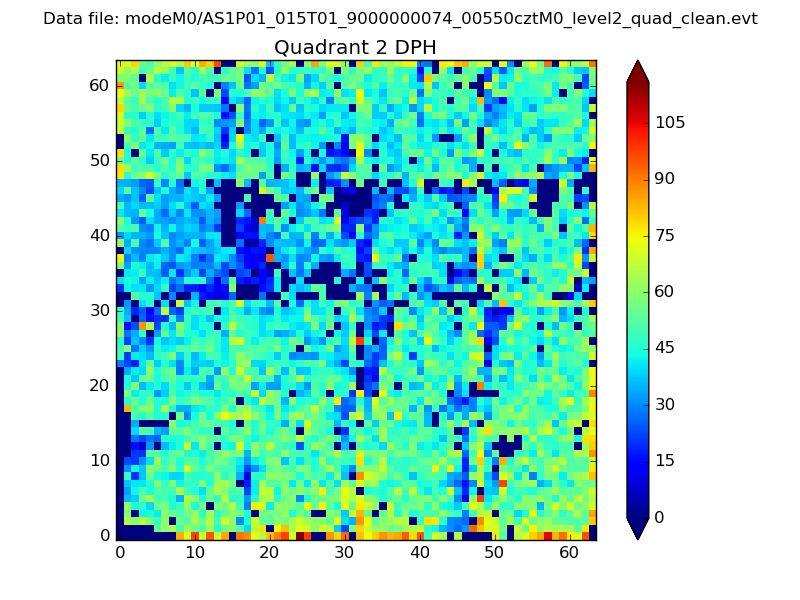 |
Quadrant C |
| Plot type | Count rate plots | Images |
|---|---|---|
| Comparison with Poisson distribution Blue bars denote a histogram of data divided into 1 sec bins. Red curve is a Poisson curve with rate = median count rate of data. |
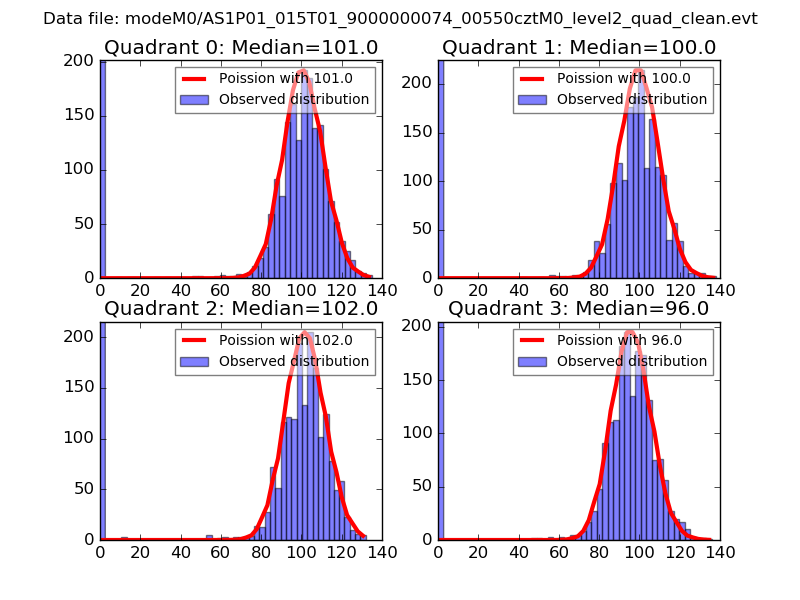 |
 |
| Quadrant-wise count rates Data is divided into 100 sec bins |
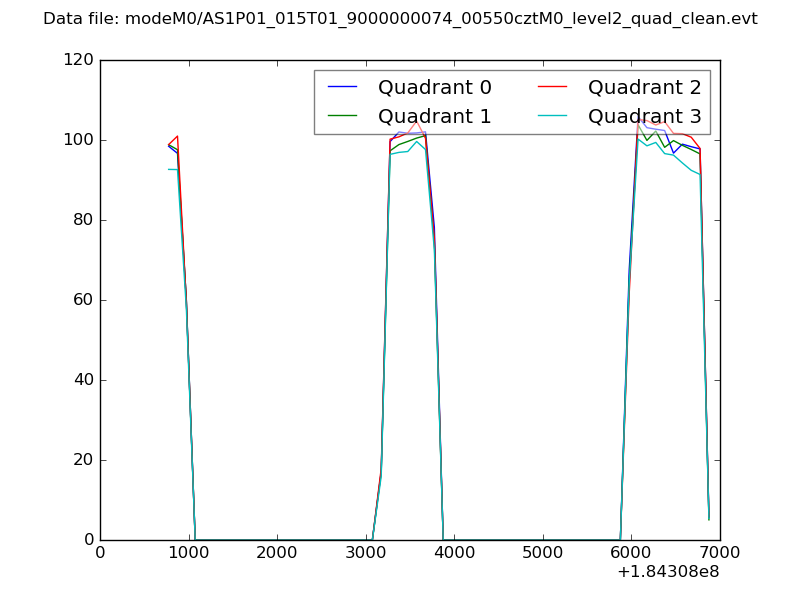 |
|
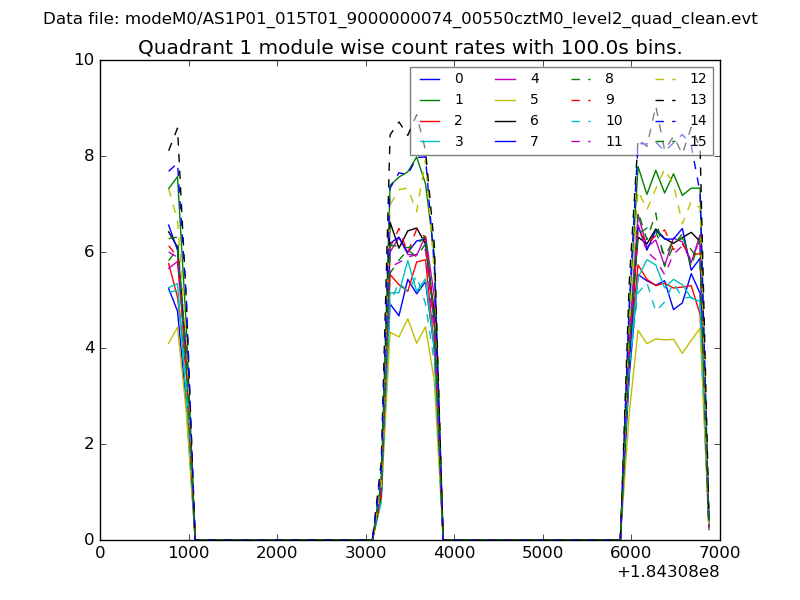
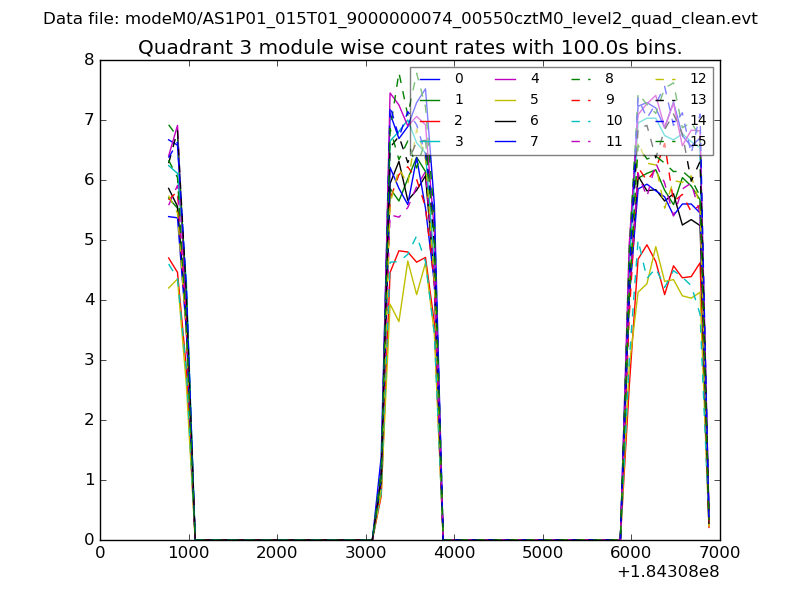
| Module-wise count rates for Quadrant A Data is divided into 100 sec bins |
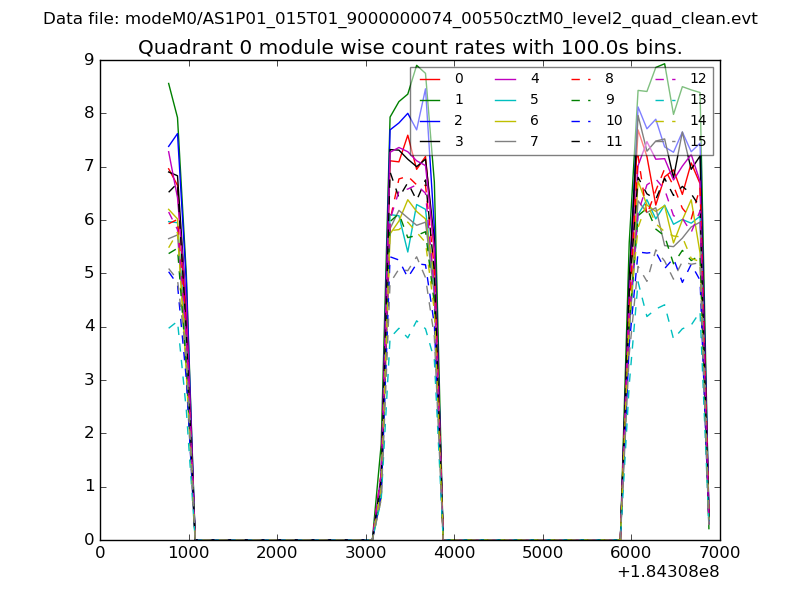 |
 |
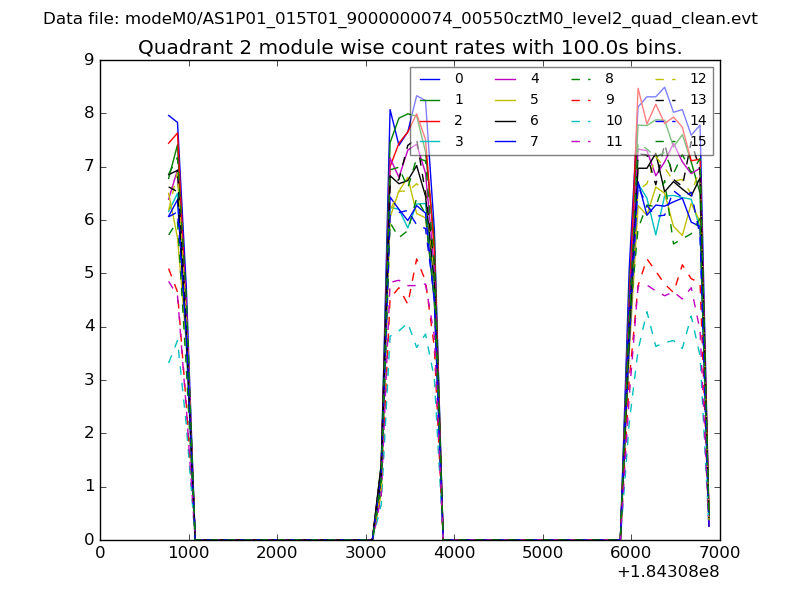
| Module-wise count rates for Quadrant B Data is divided into 100 sec bins |
 |
 |
| Module-wise count rates for Quadrant C Data is divided into 100 sec bins |
 |
 |
| Module-wise count rates for Quadrant D Data is divided into 100 sec bins |
 |
 |
| Parameter | Plot |
|---|---|
| CZT HV Monitor | 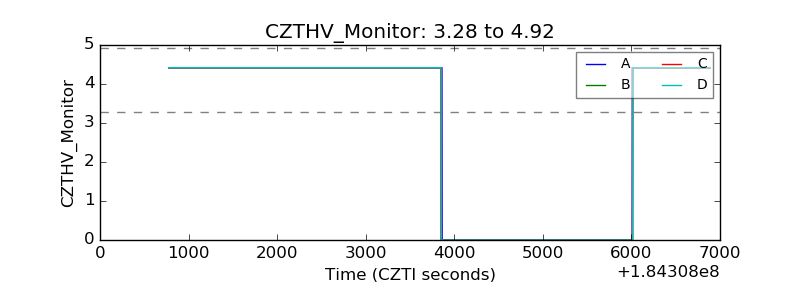 |
| D_VDD | 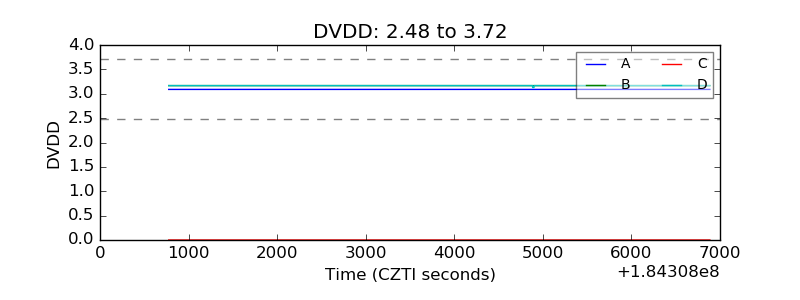 |
| Temperature 1 | 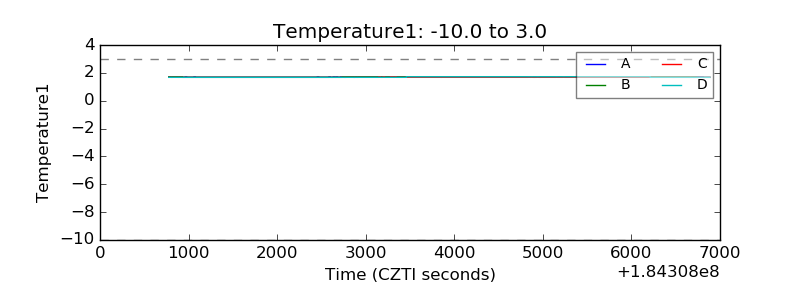 |
| Veto HV Monitor |  |
| Veto LLD | 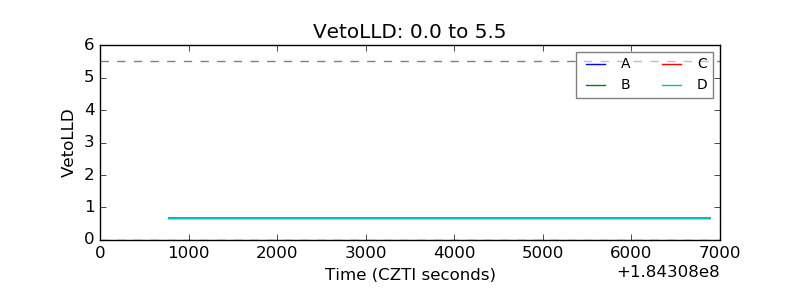 |
| Alpha Counter | 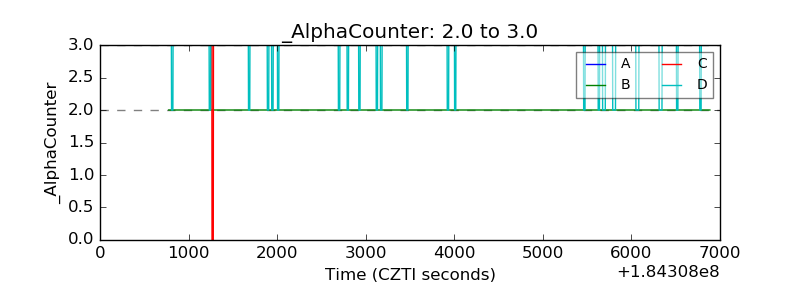 |
| _CPM_Rate | 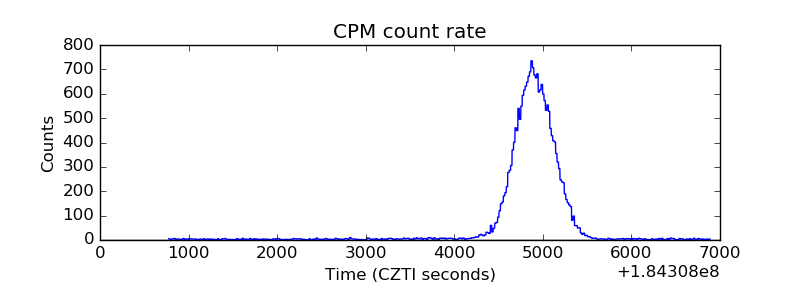 |
| CZT Counter | 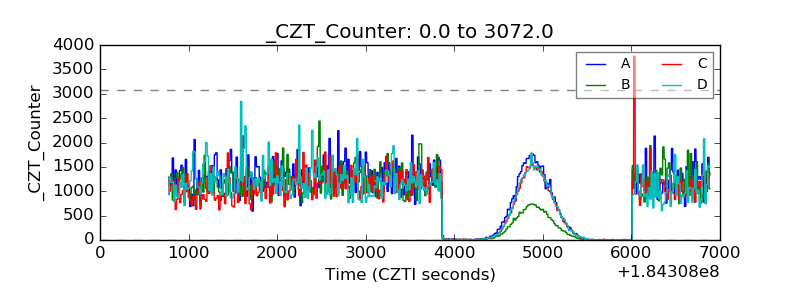 |
| +2.5 Volts monitor | 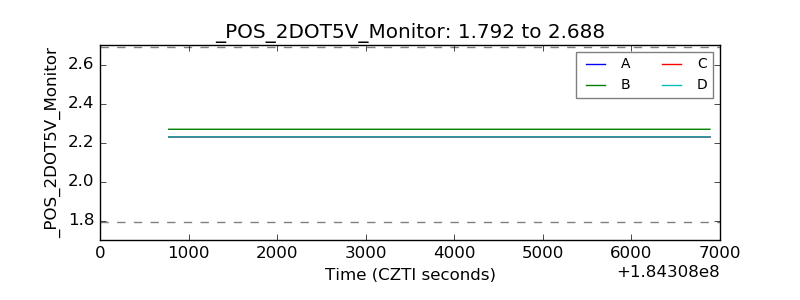 |
| +5 Volts monitor | 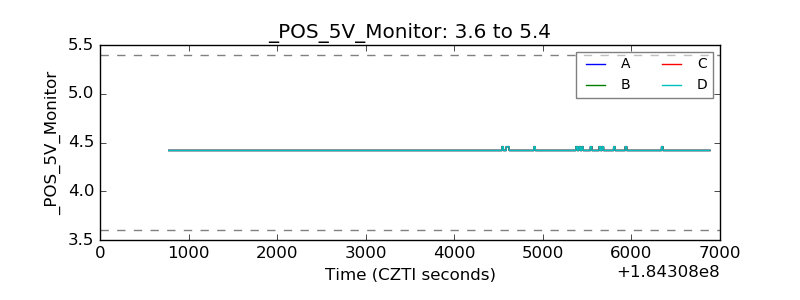 |
| _ROLL_ROT | 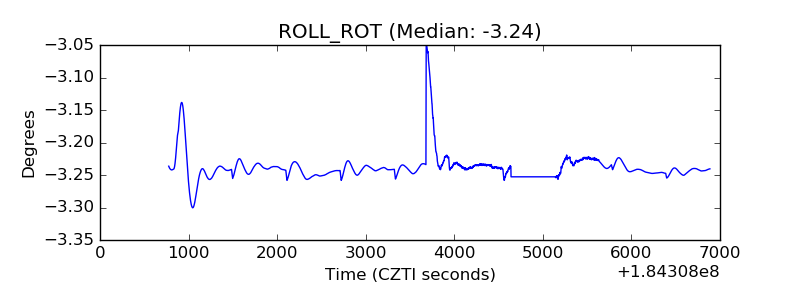 |
| _Roll_DEC | 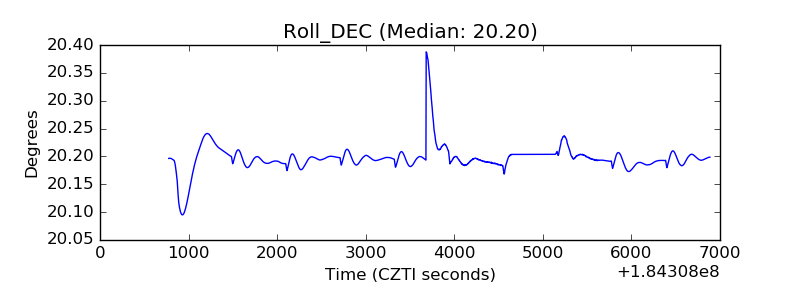 |
| _Roll_RA | 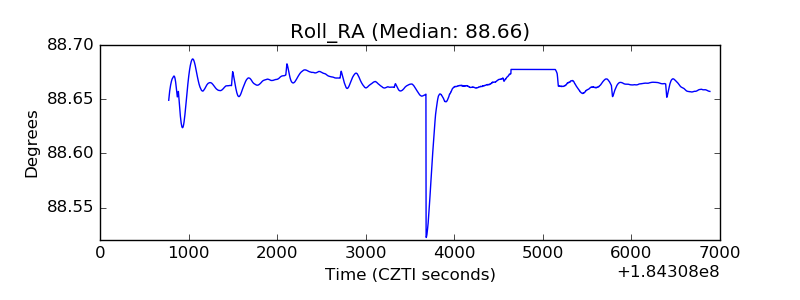 |
| Veto Counter | 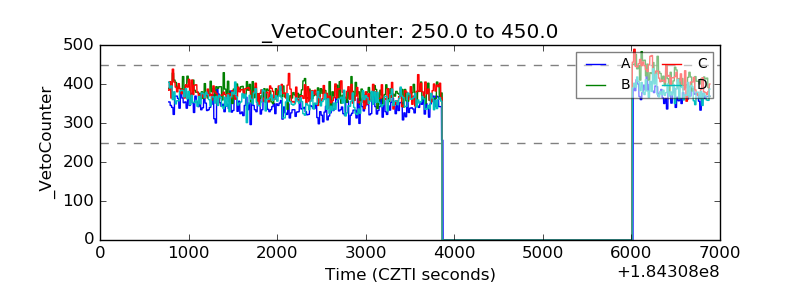 |