| Param | Original file | Final file |
|---|---|---|
| Filename | modeM0/AS1P01_015T01_9000000074_00555cztM0_level2.evt | modeM0/AS1P01_015T01_9000000074_00555cztM0_level2_quad_clean.evt |
| Size (bytes) | 642,502,080 | 43,404,480 |
| Size | 612.7 MB | 41.4 MB |
| Events in quadrant A | 5,032,543 | 257,078 |
| Events in quadrant B | 4,801,438 | 259,939 |
| Events in quadrant C | 4,486,629 | 257,062 |
| Events in quadrant D | 4,863,138 | 249,796 |
| Mode M9 | |||
|---|---|---|---|
| Quadrant | BADHDUFLAG | Total packets | Discarded packets |
| A | 0 | 24 | 0 |
| B | 0 | 24 | 0 |
| C | 0 | 24 | 0 |
| D | 0 | 25 | 0 |
| Mode M0 | |||
|---|---|---|---|
| Quadrant | BADHDUFLAG | Total packets | Discarded packets |
| A | 0 | 17841 | 1 |
| B | 0 | 17150 | 1 |
| C | 0 | 16270 | 1 |
| D | 0 | 17337 | 1 |
| Mode SS | |||
|---|---|---|---|
| Quadrant | BADHDUFLAG | Total packets | Discarded packets |
| A | 0 | 84 | 0 |
| B | 0 | 84 | 0 |
| C | 0 | 84 | 0 |
| D | 0 | 84 | 0 |
| Quadrant | Total seconds | Saturated seconds | Saturation percentage |
|---|---|---|---|
| A | 4114 | 4 | 0.097229% |
| B | 4114 | 4 | 0.097229% |
| C | 4114 | 4 | 0.097229% |
| D | 4114 | 17 | 0.413223% |
Noise dominated data is calculated using 1-second bins in cleaned event files. If a bin has >2000 counts, and if more than 50% of those come from <1% of pixels, then it is considered to be noise-dominated and hence unusable.
| Quadrant | # 1 sec bins | Bins with >0 counts | Bins with >2000 counts | High rate bins dominated by noise | Noise dominated (total time) | Noise dominated (detector-on time) | Marked lightcurve |
|---|---|---|---|---|---|---|---|
| A | 4114 | 4114 | 129 | 129 | 3.14% | 3.14% | 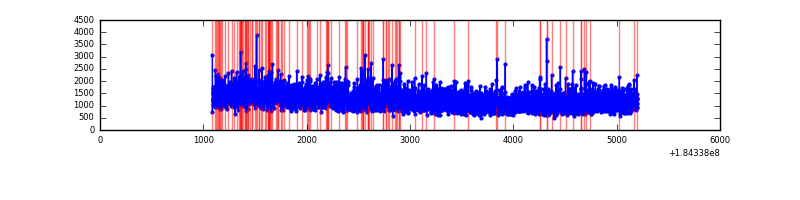 |
| B | 4114 | 4114 | 51 | 51 | 1.24% | 1.24% | 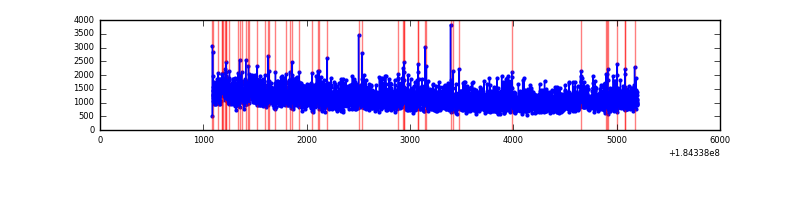 |
| C | 4114 | 4114 | 46 | 46 | 1.12% | 1.12% | 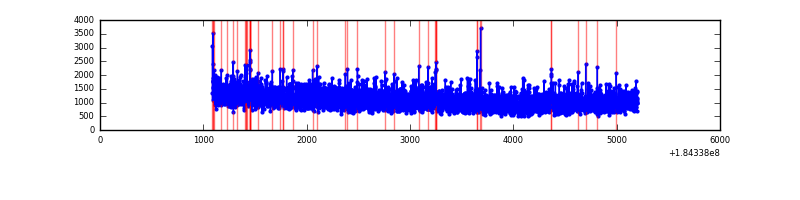 |
| D | 4114 | 4114 | 96 | 96 | 2.33% | 2.33% | 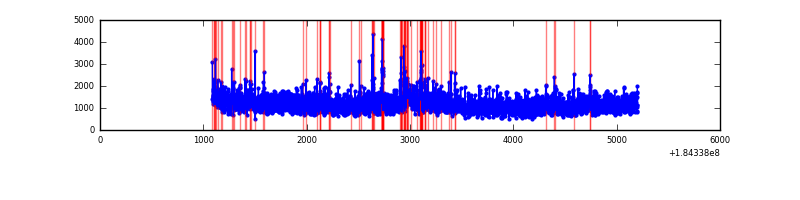 |
Top three noisy pixels from each quadrant. If the there are fewer than three noisy pixels in the level2.evt file, extra rows are filled as -1
| Pixel properties | Quadrant properties | ||||||
|---|---|---|---|---|---|---|---|
| Quadrant | DetID | PixID | Counts | Sigma | Mean | Median | Sigma |
| A | 13 | 160 | 182238 | 663.64 | 1210 | 1198 | 272.8 |
| A | 0 | 238 | 86963 | 314.39 | 1210 | 1198 | 272.8 |
| A | 0 | 149 | 46574 | 166.33 | 1210 | 1198 | 272.8 |
| B | 8 | 4 | 48353 | 164.55 | 1220 | 1227 | 286.4 |
| B | 4 | 235 | 18599 | 60.66 | 1220 | 1227 | 286.4 |
| B | 5 | 2 | 16779 | 54.3 | 1220 | 1227 | 286.4 |
| C | 3 | 159 | 66808 | 208.61 | 1118 | 1160 | 314.7 |
| C | 1 | 1 | 15535 | 45.68 | 1118 | 1160 | 314.7 |
| C | 15 | 241 | 10420 | 29.43 | 1118 | 1160 | 314.7 |
| D | 1 | 239 | 374755 | 1106.77 | 1058 | 1092 | 337.6 |
| D | 13 | 221 | 130362 | 382.89 | 1058 | 1092 | 337.6 |
| D | 2 | 90 | 87937 | 257.23 | 1058 | 1092 | 337.6 |
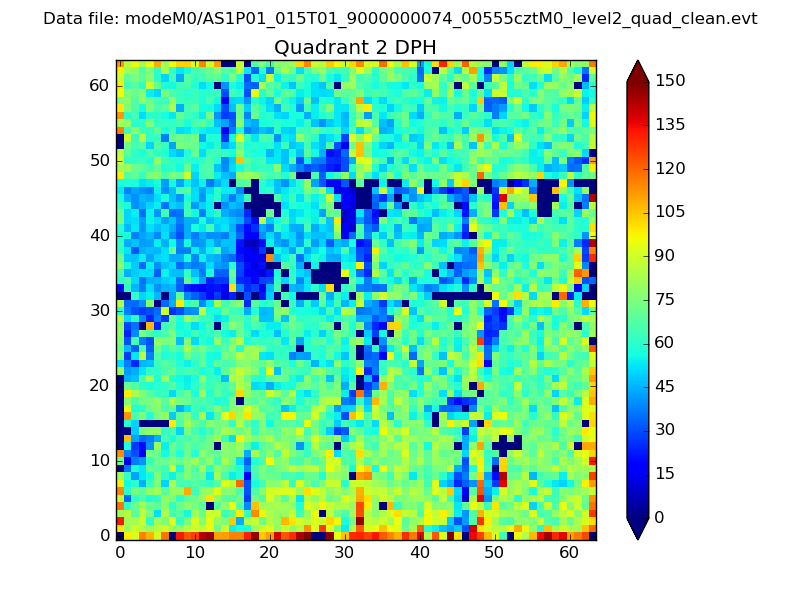
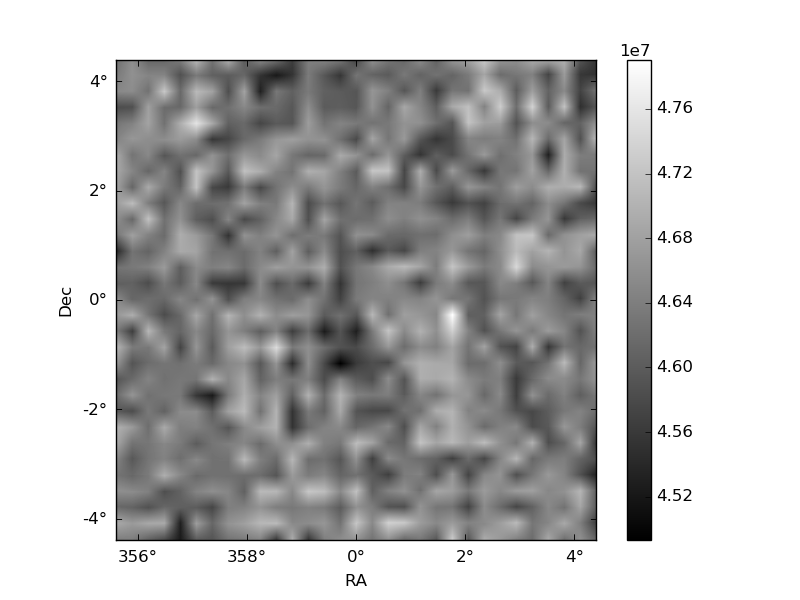
Histogram calculated using DETX and DETY for each event in the final _common_clean file
| Quadrant A | 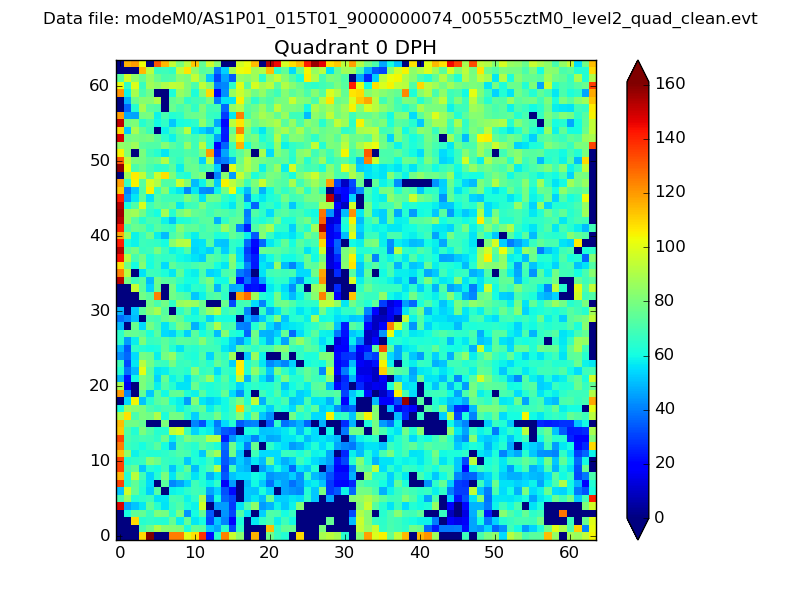 |
 |
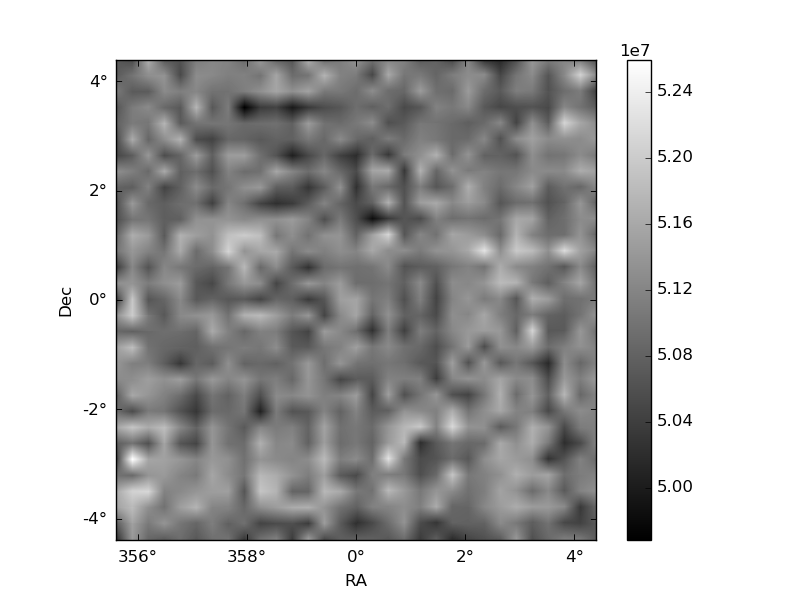
Quadrant B |
|---|---|---|---|
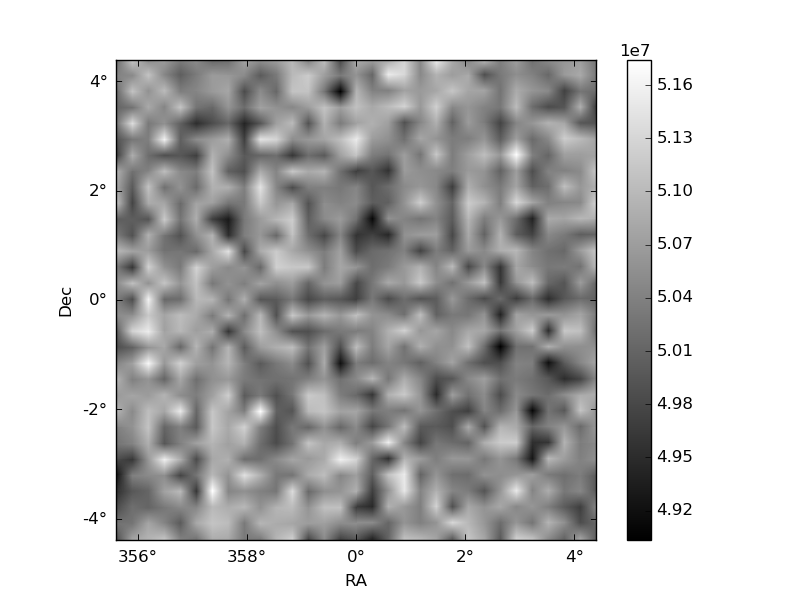
| Quadrant D |  |
 |
Quadrant C |
| Plot type | Count rate plots | Images |
|---|---|---|
| Comparison with Poisson distribution Blue bars denote a histogram of data divided into 1 sec bins. Red curve is a Poisson curve with rate = median count rate of data. |
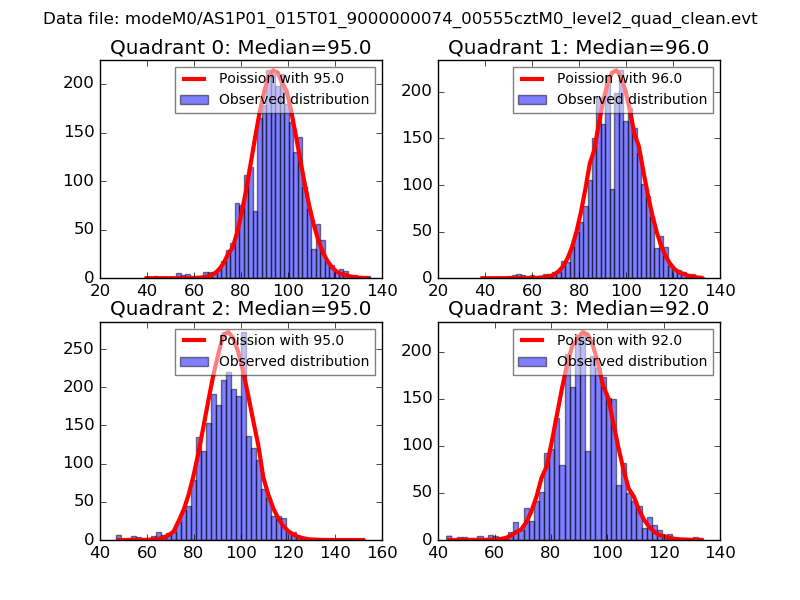 |
 |
| Quadrant-wise count rates Data is divided into 100 sec bins |
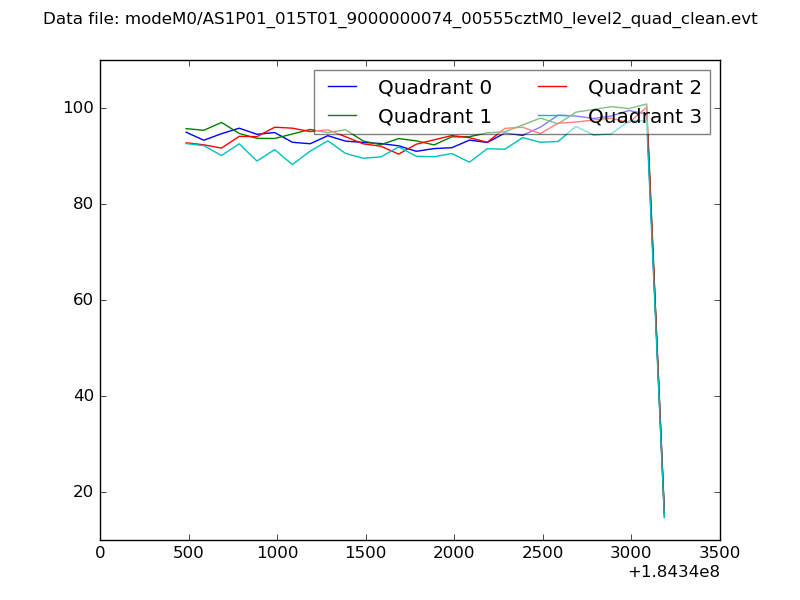 |
|
| Module-wise count rates for Quadrant A Data is divided into 100 sec bins |
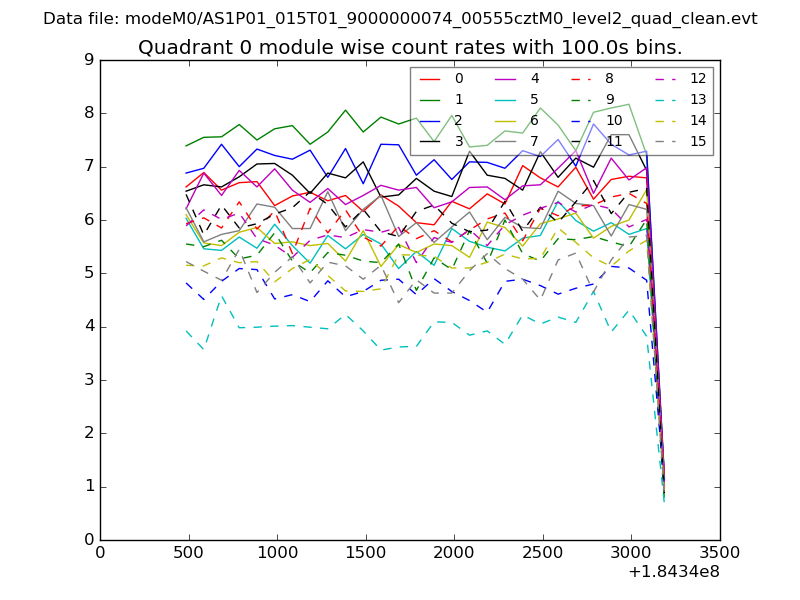 |
 |
| Module-wise count rates for Quadrant B Data is divided into 100 sec bins |
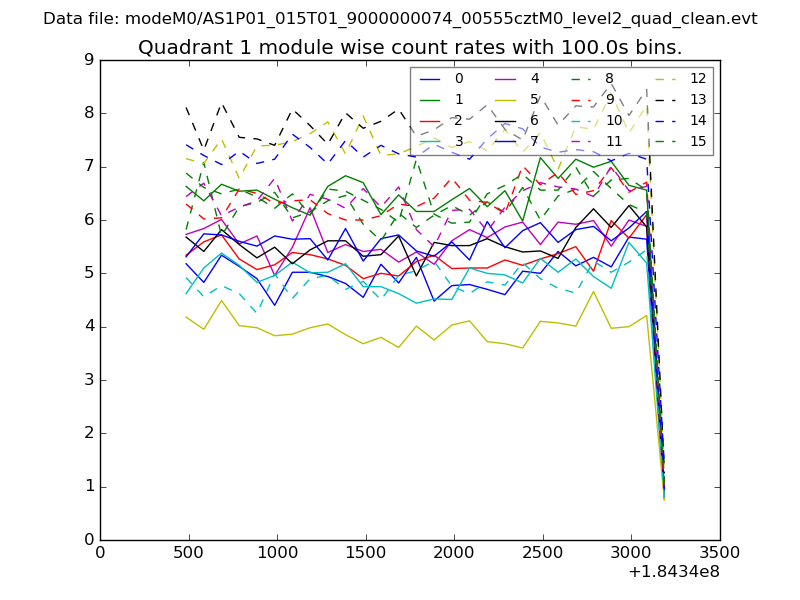 |
 |
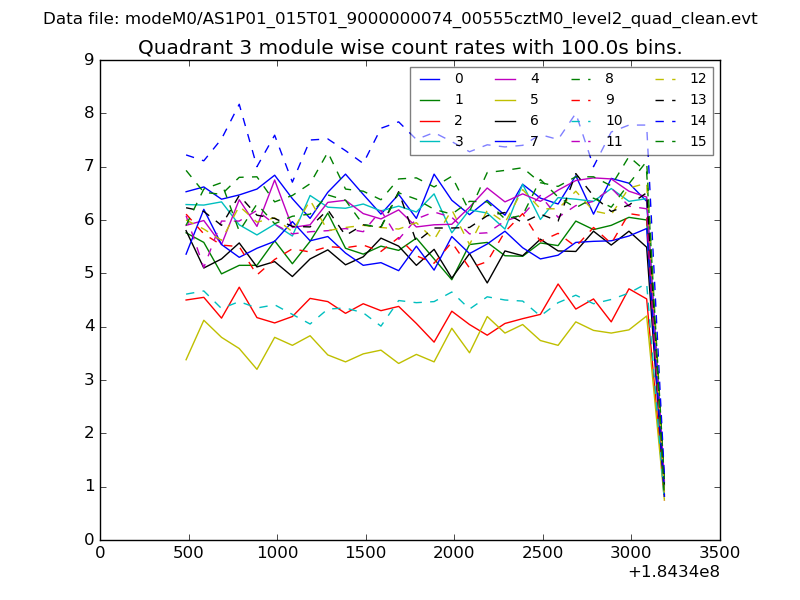
| Module-wise count rates for Quadrant C Data is divided into 100 sec bins |
 |
 |
| Module-wise count rates for Quadrant D Data is divided into 100 sec bins |
 |
 |
| Parameter | Plot |
|---|---|
| CZT HV Monitor |  |
| D_VDD | 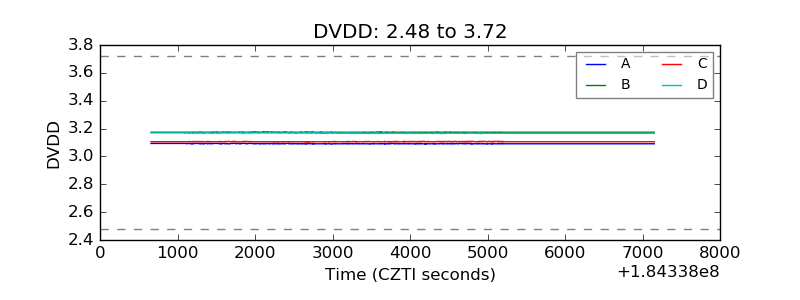 |
| Temperature 1 | 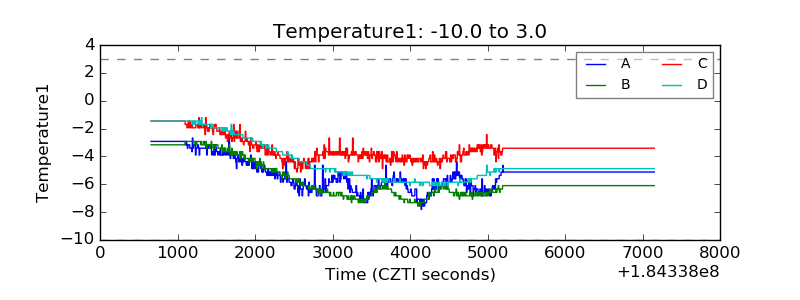 |
| Veto HV Monitor | 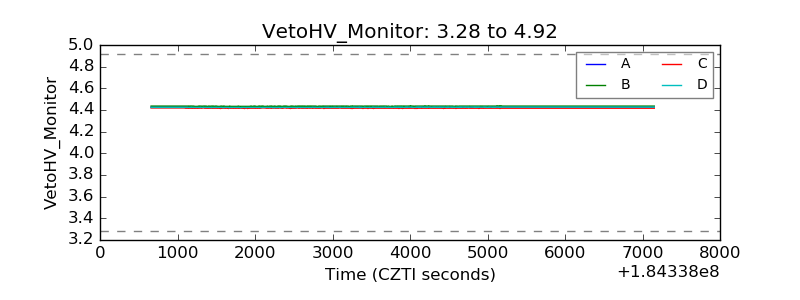 |
| Veto LLD | 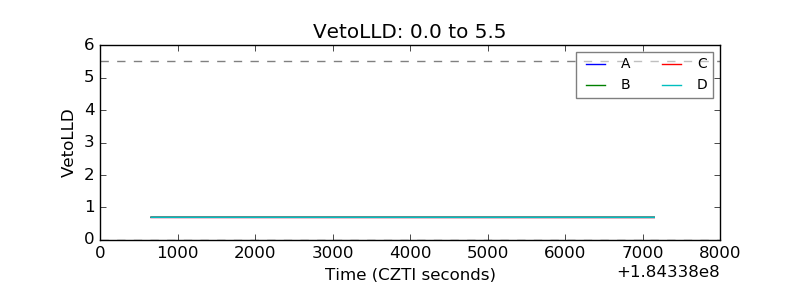 |
| Alpha Counter | 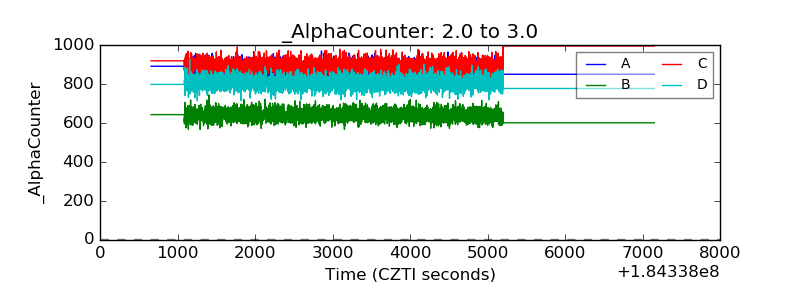 |
| _CPM_Rate | 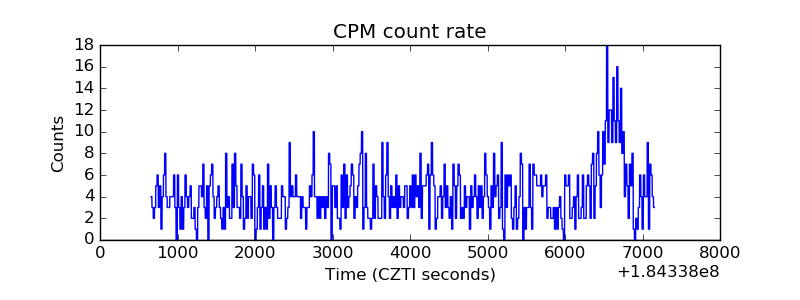 |
| CZT Counter | 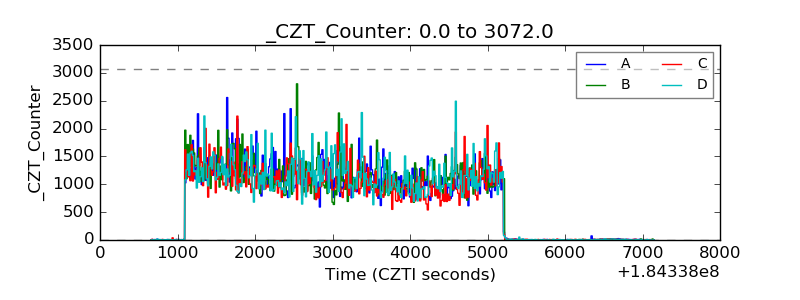 |
| +2.5 Volts monitor |  |
| +5 Volts monitor |  |
| _ROLL_ROT | 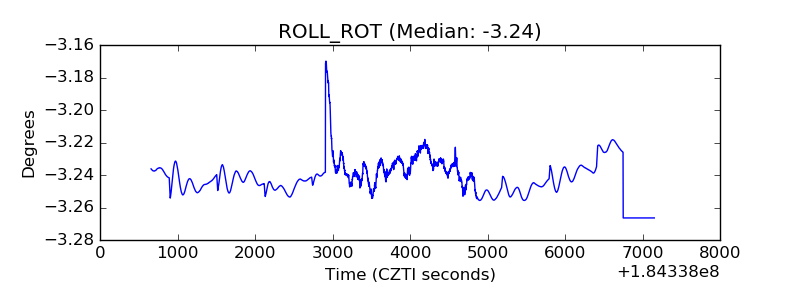 |
| _Roll_DEC | 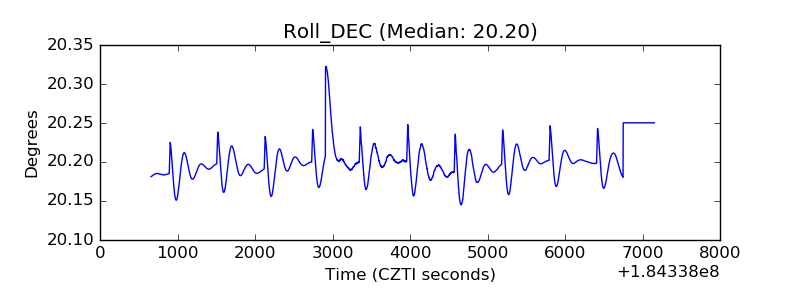 |
| _Roll_RA | 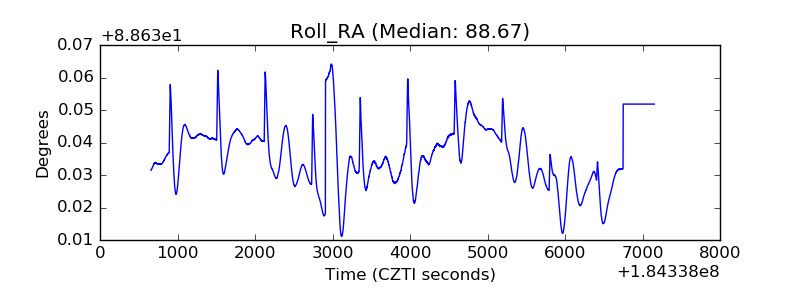 |
| Veto Counter | 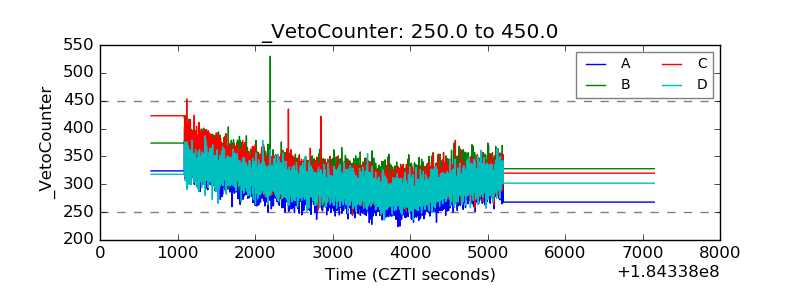 |