| Param | Original file | Final file |
|---|---|---|
| Filename | modeM0/AS1P01_015T03_9000000076cztM0_level2.fits | modeM0/AS1P01_015T03_9000000076cztM0_level2_quad_clean.evt |
| Size (bytes) | 218,626,560 | 328,752,000 |
| Size | 208.5 MB | 313.5 MB |
| Events in quadrant A | 1,221,262 | 2,058,255 |
| Events in quadrant B | 1,231,260 | 2,098,677 |
| Events in quadrant C | 1,223,794 | 2,047,899 |
| Events in quadrant D | 1,024,466 | 1,832,265 |
| Mode M0 | |||
|---|---|---|---|
| Quadrant | BADHDUFLAG | Total packets | Discarded packets |
| A | 0 | 119136 | 0 |
| B | 0 | 117659 | 0 |
| C | 0 | 108610 | 0 |
| D | 0 | 125442 | 0 |
| Mode M9 | |||
|---|---|---|---|
| Quadrant | BADHDUFLAG | Total packets | Discarded packets |
| A | 0 | 151 | 0 |
| B | 0 | 151 | 0 |
| C | 0 | 151 | 0 |
| D | 0 | 151 | 0 |
| Mode SS | |||
|---|---|---|---|
| Quadrant | BADHDUFLAG | Total packets | Discarded packets |
| A | 0 | 578 | 0 |
| B | 0 | 570 | 0 |
| C | 0 | 576 | 0 |
| D | 0 | 576 | 0 |
| Quadrant | Total seconds | Saturated seconds | Saturation percentage |
|---|---|---|---|
| A | 27931 | 202 | 0.723211% |
| B | 27922 | 50 | 0.179070% |
| C | 27931 | 33 | 0.118148% |
| D | 27864 | 232 | 0.832616% |
Noise dominated data is calculated using 1-second bins in cleaned event files. If a bin has >2000 counts, and if more than 50% of those come from <1% of pixels, then it is considered to be noise-dominated and hence unusable.
| Quadrant | # 1 sec bins | Bins with >0 counts | Bins with >2000 counts | High rate bins dominated by noise | Noise dominated (total time) | Noise dominated (detector-on time) | Marked lightcurve |
|---|---|---|---|---|---|---|---|
| A | 45151 | 28020 | 0 | 0 | 0.00% | 0.00% |  |
| B | 45151 | 28020 | 0 | 0 | 0.00% | 0.00% | 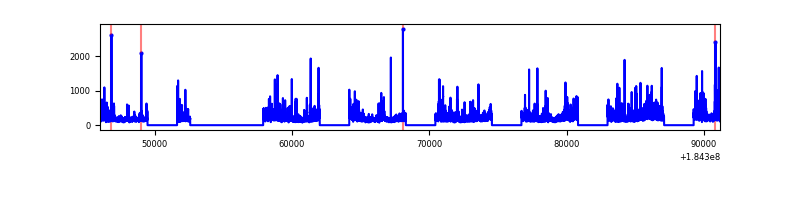 |
| C | 45151 | 28028 | 0 | 0 | 0.00% | 0.00% |  |
| D | 45151 | 27965 | 0 | 0 | 0.00% | 0.00% |  |
Top three noisy pixels from each quadrant. If the there are fewer than three noisy pixels in the level2.evt file, extra rows are filled as -1
| Pixel properties | Quadrant properties | ||||||
|---|---|---|---|---|---|---|---|
| Quadrant | DetID | PixID | Counts | Sigma | Mean | Median | Sigma |
| A | 7 | 110 | 1217 | 12.05 | 317 | 297 | 76.4 |
| A | 0 | 29 | 1167 | 11.39 | 317 | 297 | 76.4 |
| A | 0 | 30 | 934 | 8.34 | 317 | 297 | 76.4 |
| B | 2 | 9 | 1089 | 13.45 | 325 | 311 | 57.8 |
| B | 14 | 254 | 841 | 9.17 | 325 | 311 | 57.8 |
| B | 2 | 8 | 787 | 8.23 | 325 | 311 | 57.8 |
| C | 12 | 241 | 902 | 7.4 | 323 | 300 | 81.3 |
| C | 2 | 191 | 849 | 6.75 | 323 | 300 | 81.3 |
| C | 1 | 81 | 830 | 6.52 | 323 | 300 | 81.3 |
| D | 6 | 44 | 824 | 7.73 | 292 | 268 | 72.0 |
| D | 6 | 231 | 806 | 7.48 | 292 | 268 | 72.0 |
| D | 11 | 82 | 761 | 6.85 | 292 | 268 | 72.0 |
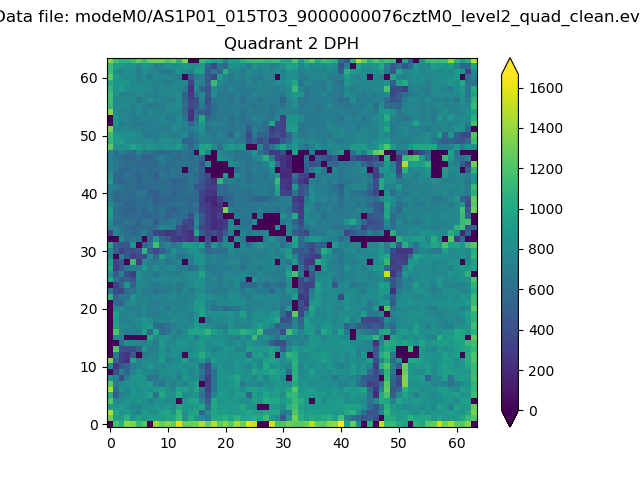
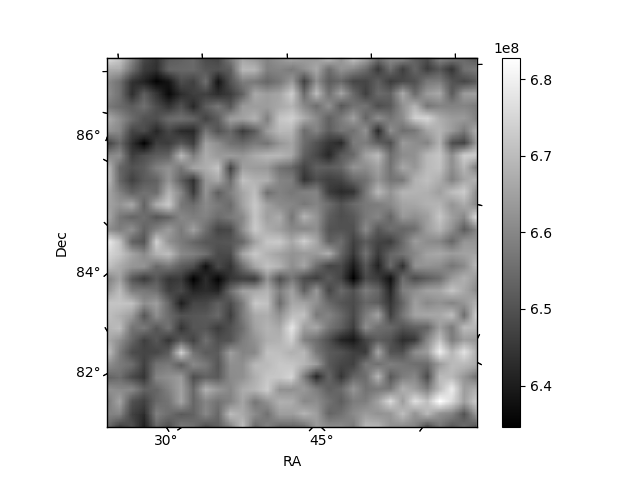
Histogram calculated using DETX and DETY for each event in the final _common_clean file
| Quadrant A |  |
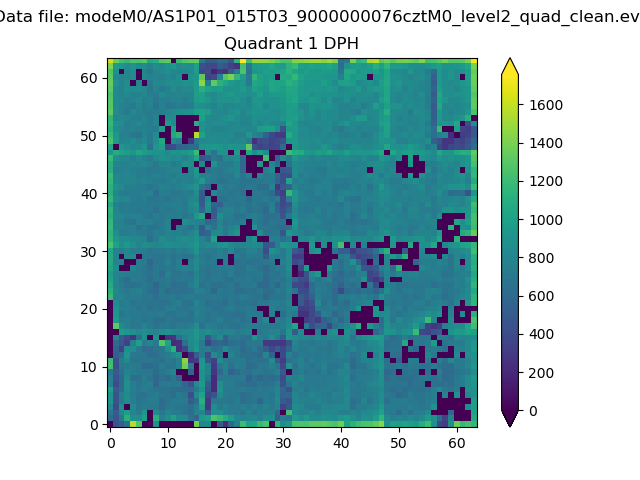 |
Quadrant B |
|---|---|---|---|
| Quadrant D |  |
 |
Quadrant C |
| Plot type | Count rate plots | Images |
|---|---|---|
| Comparison with Poisson distribution Blue bars denote a histogram of data divided into 1 sec bins. Red curve is a Poisson curve with rate = median count rate of data. |
 |
 |
| Quadrant-wise count rates Data is divided into 100 sec bins |
 |
|
| Module-wise count rates for Quadrant A Data is divided into 100 sec bins |
 |
 |
| Module-wise count rates for Quadrant B Data is divided into 100 sec bins |
 |
 |
| Module-wise count rates for Quadrant C Data is divided into 100 sec bins |
 |
 |
| Module-wise count rates for Quadrant D Data is divided into 100 sec bins |
 |
 |
| Parameter | Plot |
|---|---|
| CZT HV Monitor |  |
| D_VDD |  |
| Temperature 1 |  |
| Veto HV Monitor |  |
| Veto LLD | 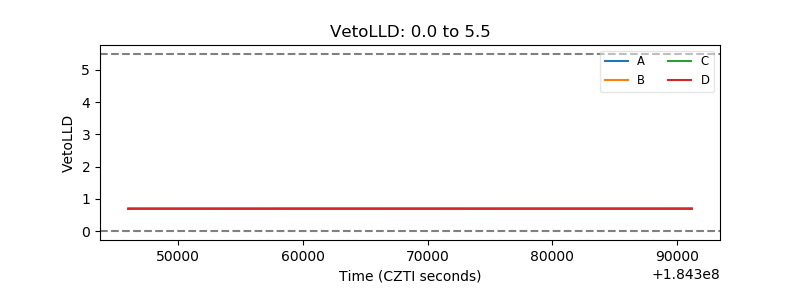 |
| Alpha Counter | 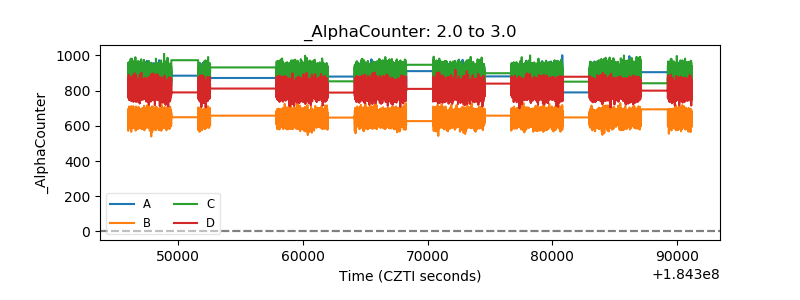 |
| _CPM_Rate |  |
| CZT Counter |  |
| +2.5 Volts monitor |  |
| +5 Volts monitor |  |
| _ROLL_ROT |  |
| _Roll_DEC |  |
| _Roll_RA |  |
| Veto Counter |  |