| Param | Original file | Final file |
|---|---|---|
| Filename | modeM0/AS1P01_015T03_9000000076_00555cztM0_level2.evt | modeM0/AS1P01_015T03_9000000076_00555cztM0_level2_quad_clean.evt |
| Size (bytes) | 74,664,000 | 5,290,560 |
| Size | 71.2 MB | 5.0 MB |
| Events in quadrant A | 465,748 | 32,452 |
| Events in quadrant B | 473,561 | 31,014 |
| Events in quadrant C | 469,967 | 31,145 |
| Events in quadrant D | 823,857 | 31,063 |
| Mode M0 | |||
|---|---|---|---|
| Quadrant | BADHDUFLAG | Total packets | Discarded packets |
| A | 0 | 1651 | 1 |
| B | 0 | 1682 | 0 |
| C | 0 | 1662 | 0 |
| D | 0 | 2702 | 0 |
| Mode SS | |||
|---|---|---|---|
| Quadrant | BADHDUFLAG | Total packets | Discarded packets |
| A | 0 | 8 | 0 |
| B | 0 | 8 | 0 |
| C | 0 | 8 | 0 |
| D | 0 | 8 | 0 |
| Quadrant | Total seconds | Saturated seconds | Saturation percentage |
|---|---|---|---|
| A | 368 | 1 | 0.271739% |
| B | 368 | 0 | 0.000000% |
| C | 368 | 0 | 0.000000% |
| D | 368 | 27 | 7.336957% |
Noise dominated data is calculated using 1-second bins in cleaned event files. If a bin has >2000 counts, and if more than 50% of those come from <1% of pixels, then it is considered to be noise-dominated and hence unusable.
| Quadrant | # 1 sec bins | Bins with >0 counts | Bins with >2000 counts | High rate bins dominated by noise | Noise dominated (total time) | Noise dominated (detector-on time) | Marked lightcurve |
|---|---|---|---|---|---|---|---|
| A | 368 | 368 | 9 | 9 | 2.45% | 2.45% | 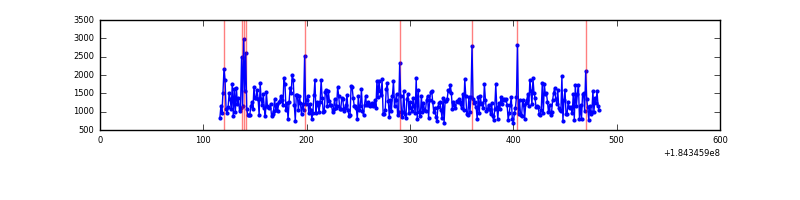 |
| B | 368 | 368 | 12 | 12 | 3.26% | 3.26% | 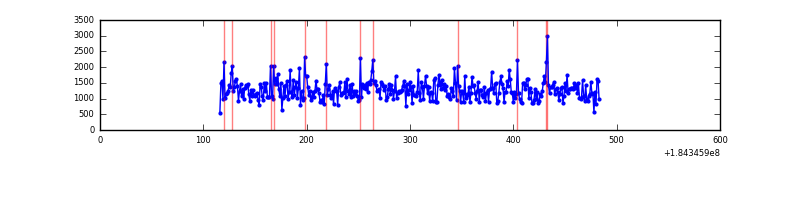 |
| C | 368 | 368 | 5 | 5 | 1.36% | 1.36% | 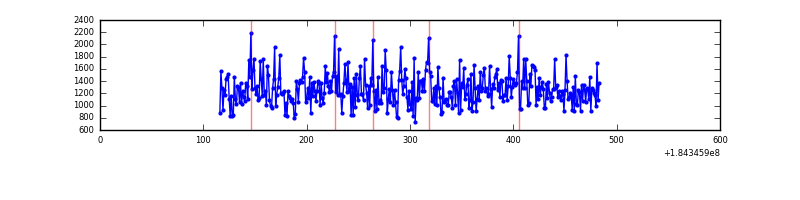 |
| D | 368 | 368 | 245 | 245 | 66.58% | 66.58% | 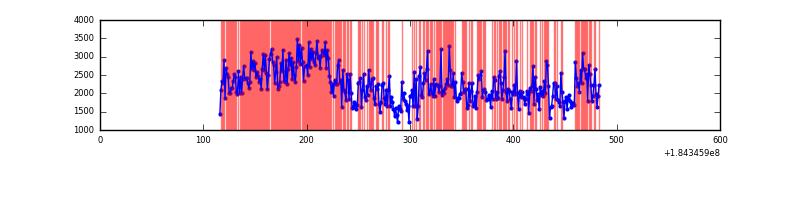 |
Top three noisy pixels from each quadrant. If the there are fewer than three noisy pixels in the level2.evt file, extra rows are filled as -1
| Pixel properties | Quadrant properties | ||||||
|---|---|---|---|---|---|---|---|
| Quadrant | DetID | PixID | Counts | Sigma | Mean | Median | Sigma |
| A | 14 | 79 | 4817 | 164.2 | 118 | 117 | 28.6 |
| A | 0 | 238 | 2500 | 83.25 | 118 | 117 | 28.6 |
| A | 0 | 69 | 776 | 23.02 | 118 | 117 | 28.6 |
| B | 8 | 4 | 27086 | 937.55 | 113 | 113 | 28.8 |
| B | 5 | 46 | 6970 | 238.34 | 113 | 113 | 28.8 |
| B | 5 | 2 | 2315 | 76.54 | 113 | 113 | 28.8 |
| C | 1 | 1 | 33688 | 1021.71 | 110 | 113 | 32.9 |
| C | 10 | 70 | 2551 | 74.19 | 110 | 113 | 32.9 |
| C | 15 | 241 | 900 | 23.95 | 110 | 113 | 32.9 |
| D | 2 | 33 | 206947 | 5779.99 | 108 | 110 | 35.8 |
| D | 1 | 239 | 102282 | 2855.16 | 108 | 110 | 35.8 |
| D | 1 | 4 | 68820 | 1920.07 | 108 | 110 | 35.8 |
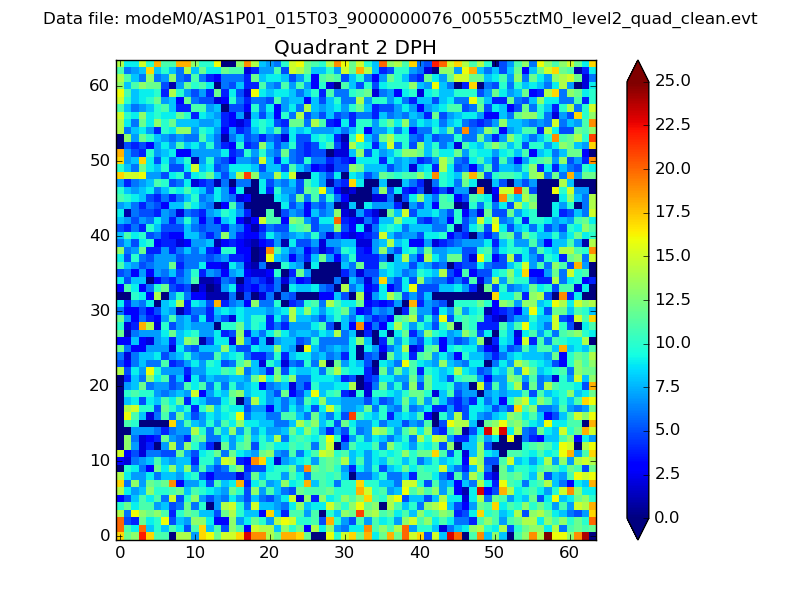
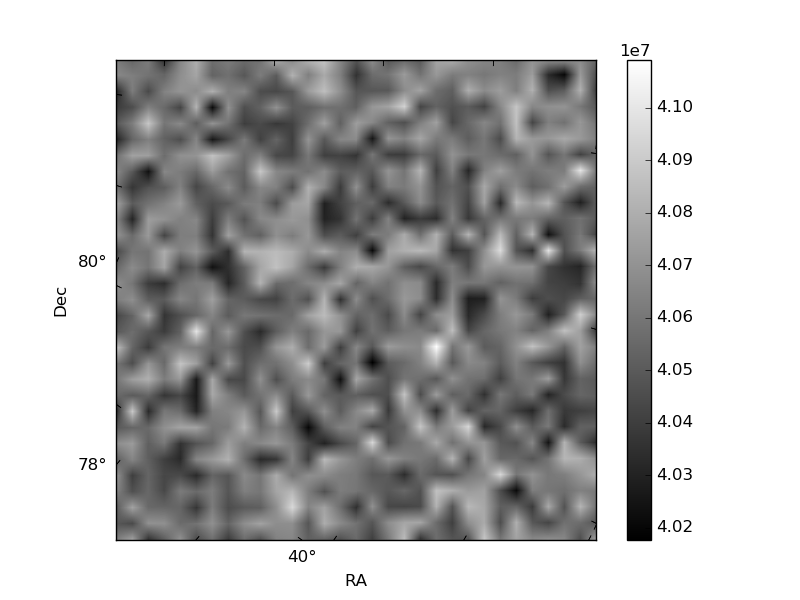
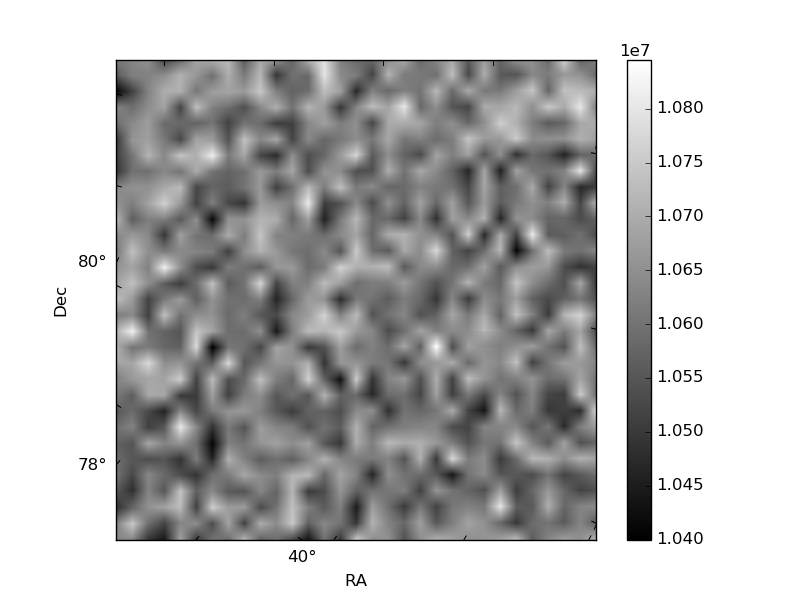
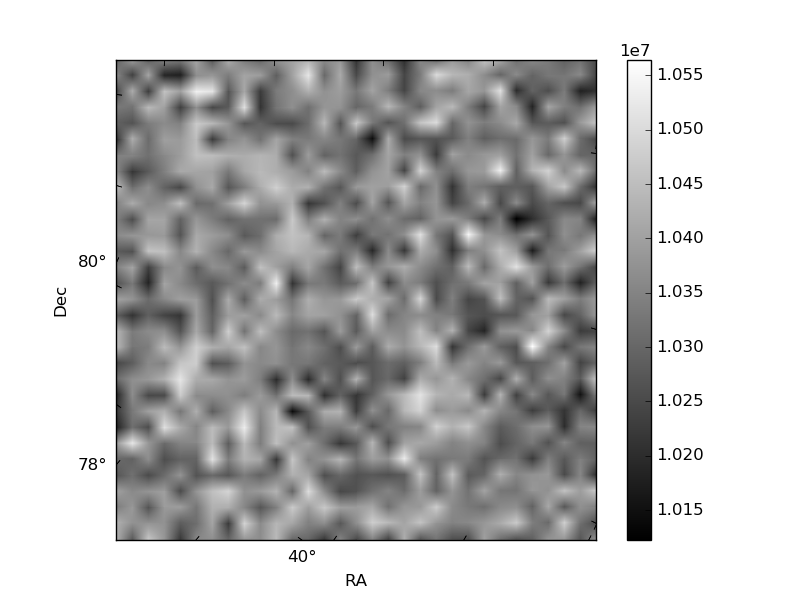
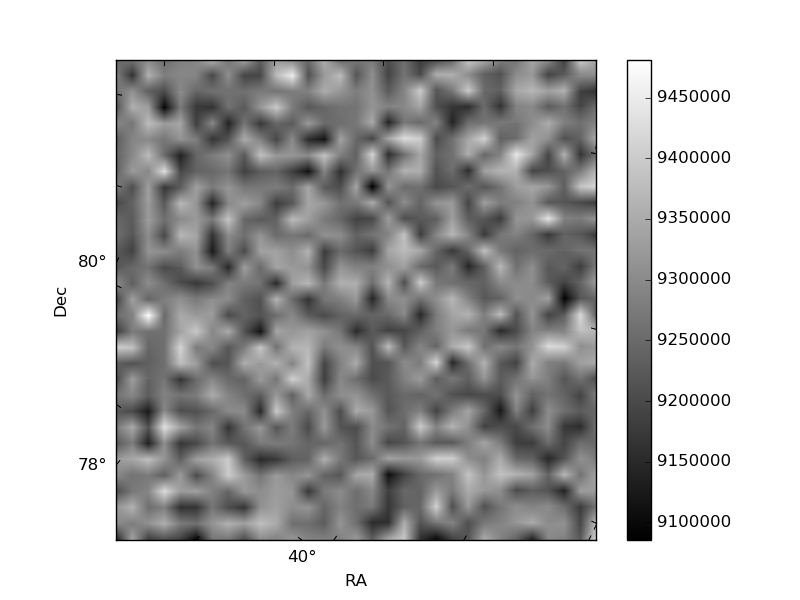
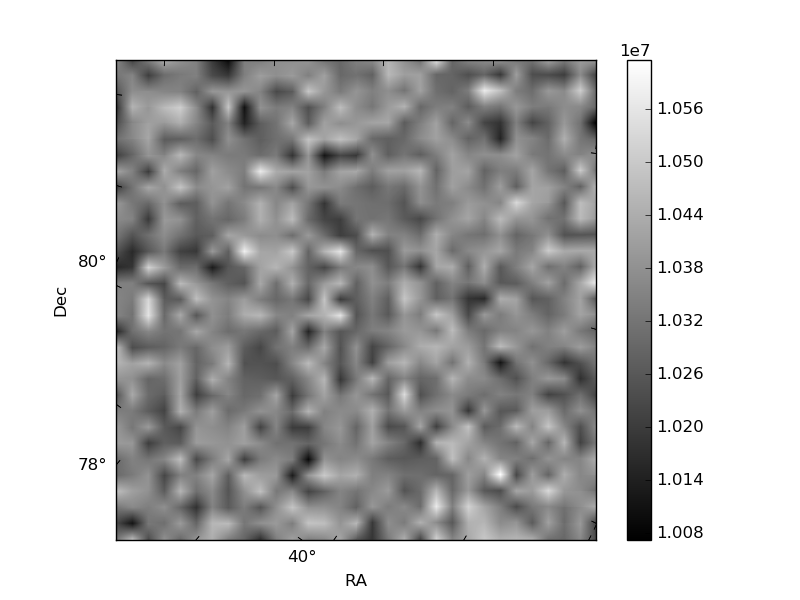
Histogram calculated using DETX and DETY for each event in the final _common_clean file
| Quadrant A | 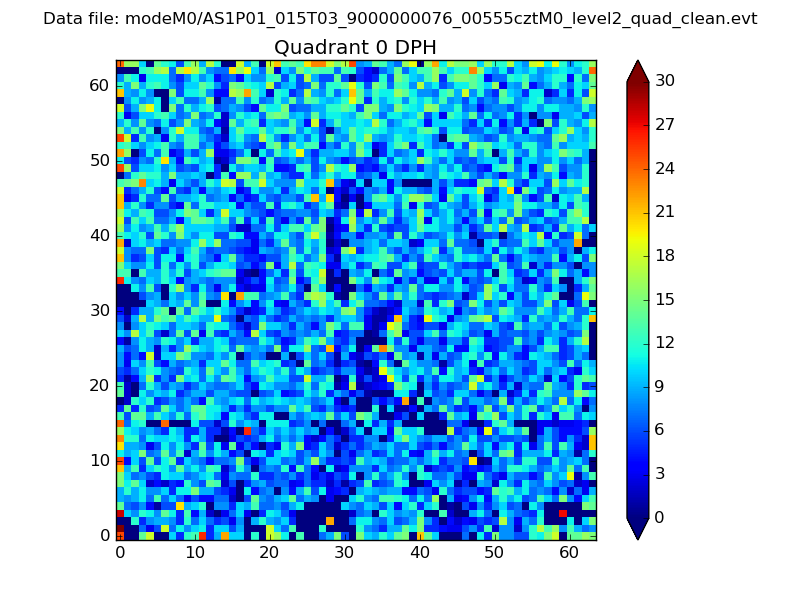 |
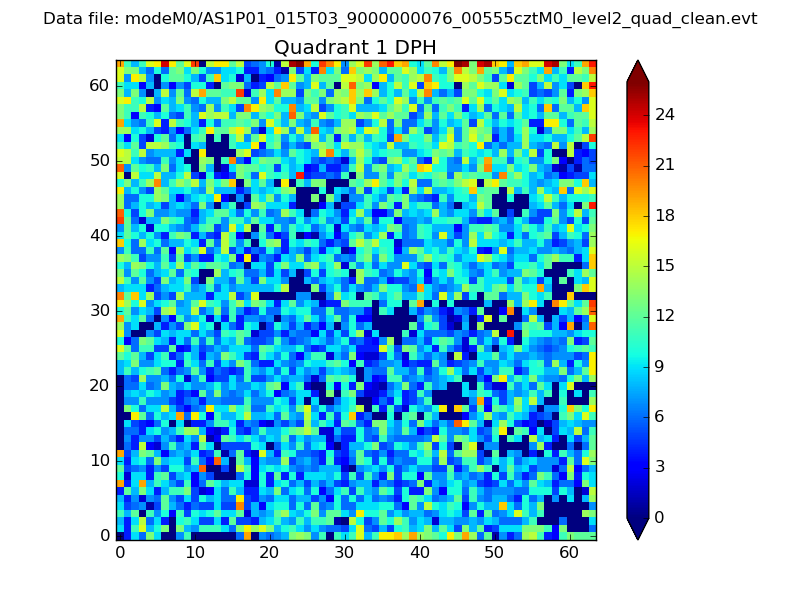 |
Quadrant B |
|---|---|---|---|
| Quadrant D | 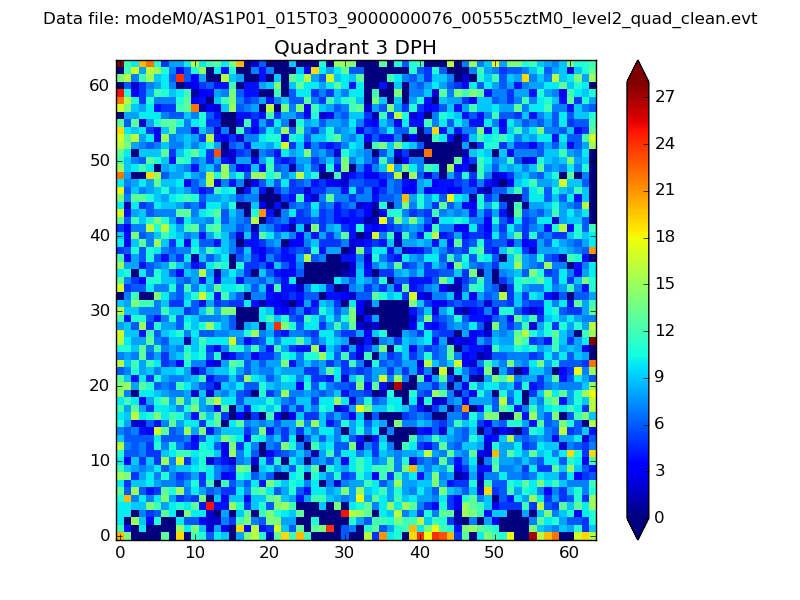 |
 |
Quadrant C |
| Plot type | Count rate plots | Images |
|---|---|---|
| Comparison with Poisson distribution Blue bars denote a histogram of data divided into 1 sec bins. Red curve is a Poisson curve with rate = median count rate of data. |
 |
 |
| Quadrant-wise count rates Data is divided into 100 sec bins |
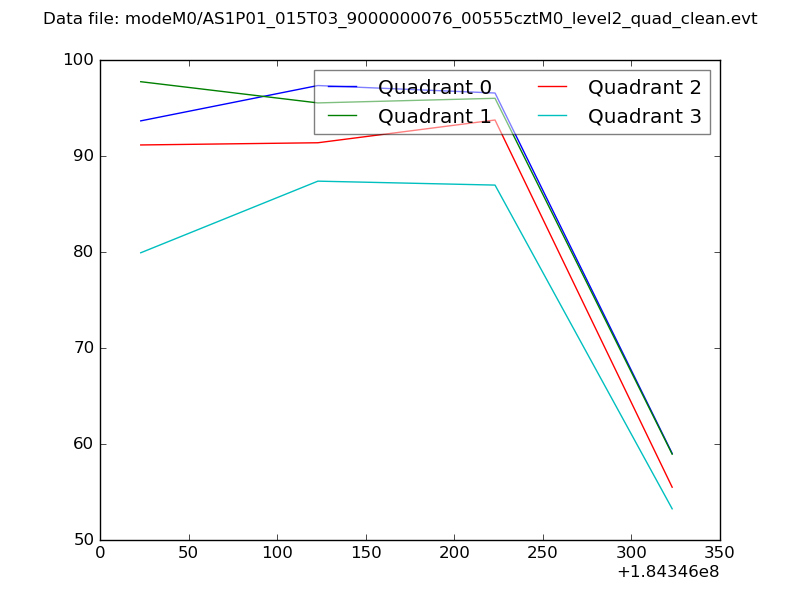 |
|
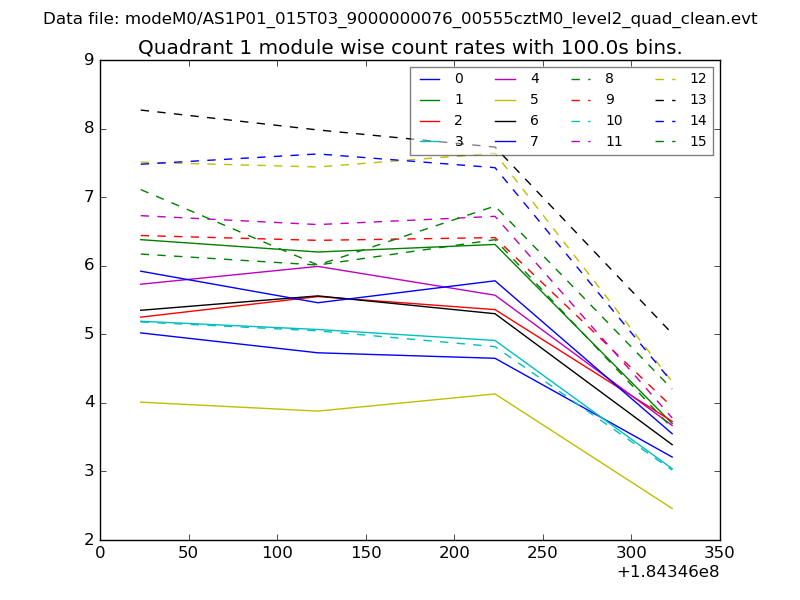
| Module-wise count rates for Quadrant A Data is divided into 100 sec bins |
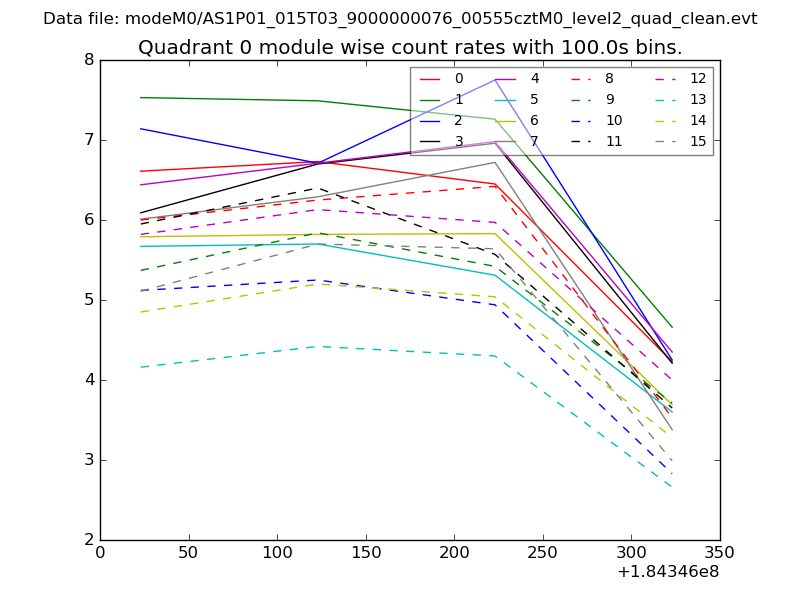 |
 |
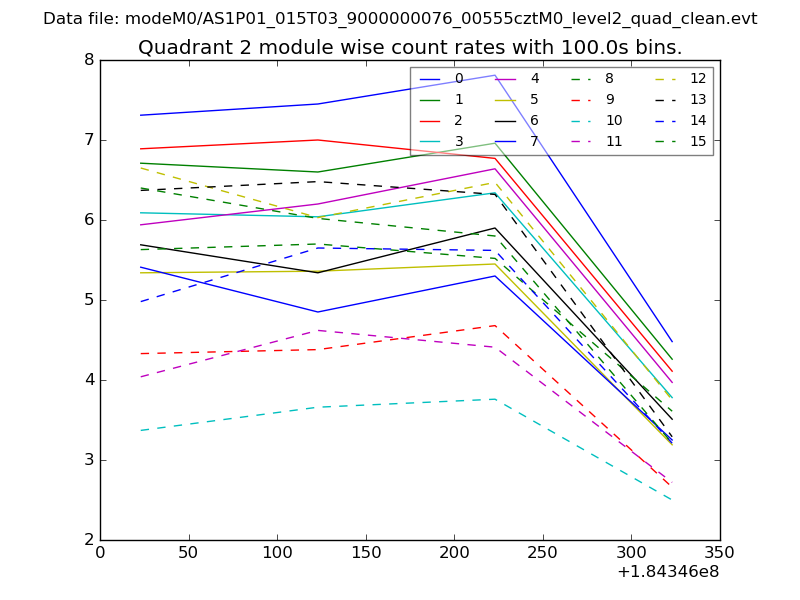
| Module-wise count rates for Quadrant B Data is divided into 100 sec bins |
 |
 |
| Module-wise count rates for Quadrant C Data is divided into 100 sec bins |
 |
 |
| Module-wise count rates for Quadrant D Data is divided into 100 sec bins |
 |
 |
| Parameter | Plot |
|---|---|
| CZT HV Monitor | 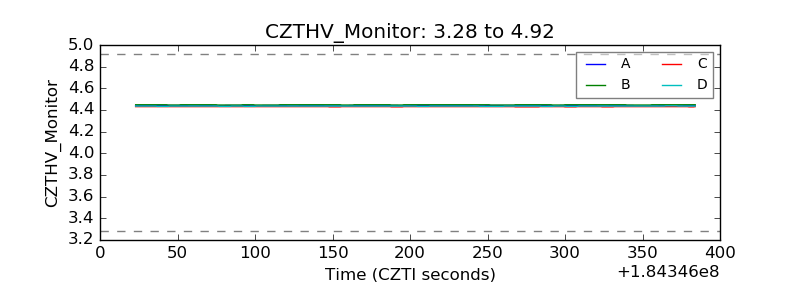 |
| D_VDD | 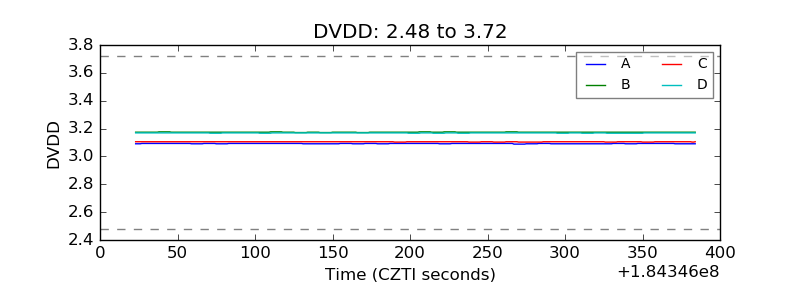 |
| Temperature 1 |  |
| Veto HV Monitor | 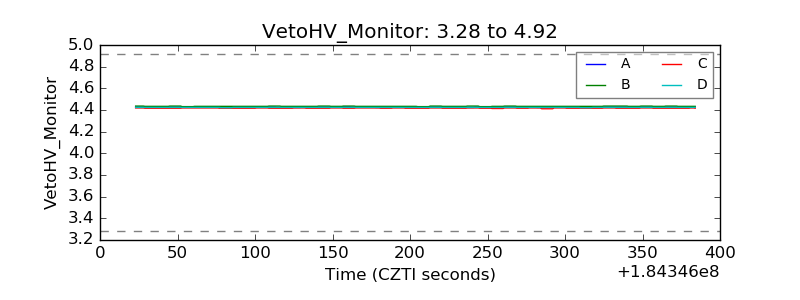 |
| Veto LLD | 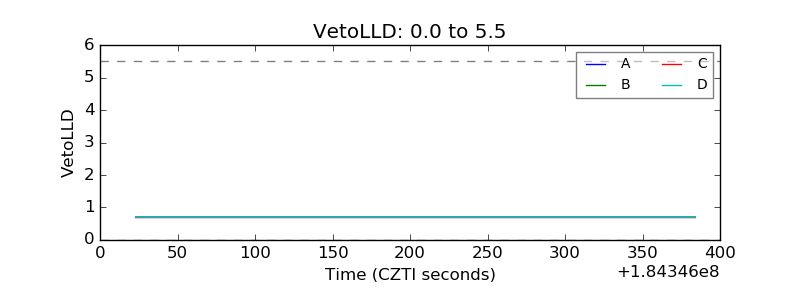 |
| Alpha Counter | 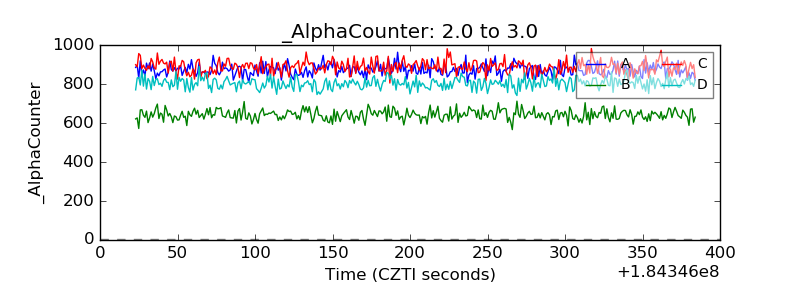 |
| _CPM_Rate | 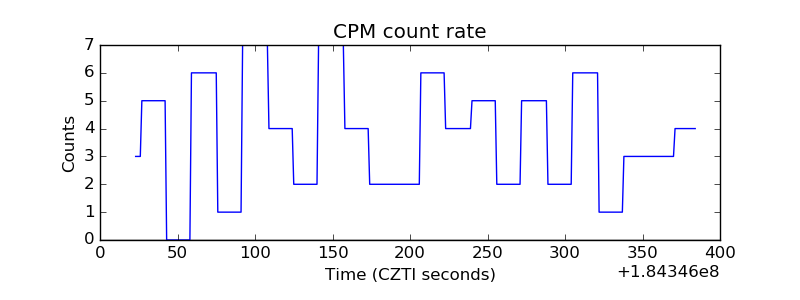 |
| CZT Counter | 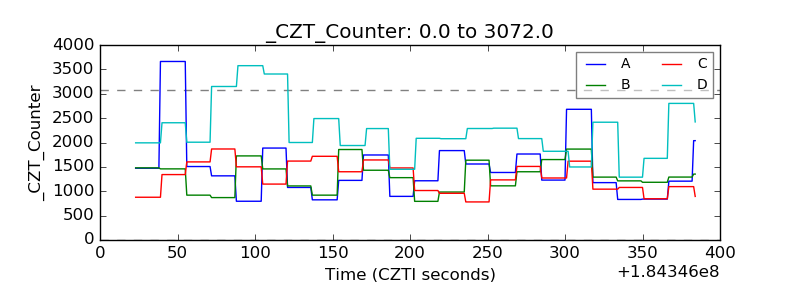 |
| +2.5 Volts monitor |  |
| +5 Volts monitor |  |
| _ROLL_ROT | 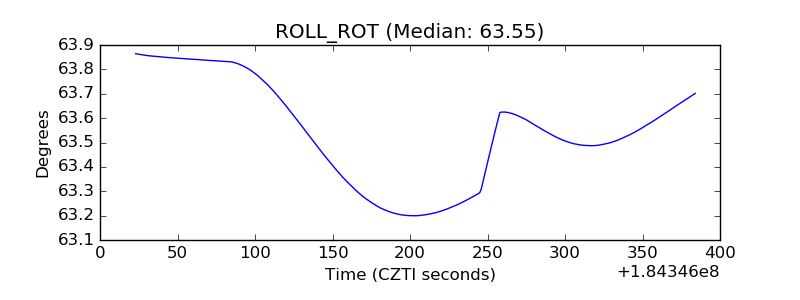 |
| _Roll_DEC |  |
| _Roll_RA | 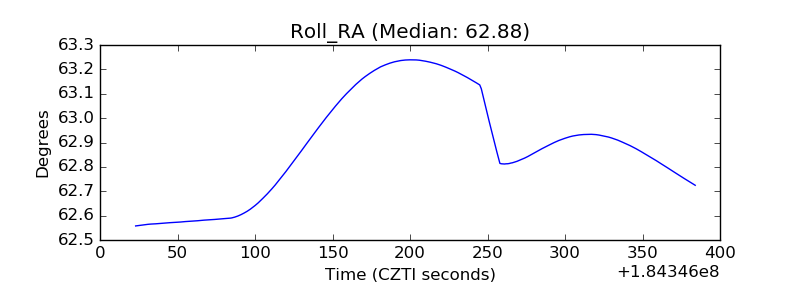 |
| Veto Counter | 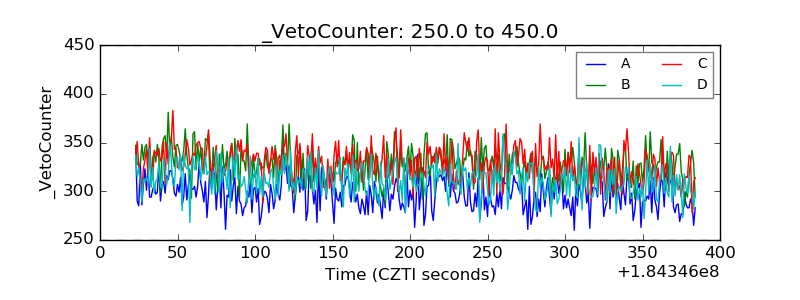 |