| Param | Original file | Final file |
|---|---|---|
| Filename | modeM0/AS1P01_015T03_9000000076_00556cztM0_level2.evt | modeM0/AS1P01_015T03_9000000076_00556cztM0_level2_quad_clean.evt |
| Size (bytes) | 747,023,040 | 64,408,320 |
| Size | 712.4 MB | 61.4 MB |
| Events in quadrant A | 5,029,399 | 414,191 |
| Events in quadrant B | 5,062,620 | 413,645 |
| Events in quadrant C | 5,084,109 | 414,186 |
| Events in quadrant D | 7,154,238 | 397,777 |
| Mode M0 | |||
|---|---|---|---|
| Quadrant | BADHDUFLAG | Total packets | Discarded packets |
| A | 0 | 18093 | 2 |
| B | 0 | 18193 | 1 |
| C | 0 | 18261 | 1 |
| D | 0 | 24316 | 1 |
| Mode M9 | |||
|---|---|---|---|
| Quadrant | BADHDUFLAG | Total packets | Discarded packets |
| A | 0 | 21 | 0 |
| B | 0 | 21 | 0 |
| C | 0 | 21 | 0 |
| D | 0 | 21 | 0 |
| Mode SS | |||
|---|---|---|---|
| Quadrant | BADHDUFLAG | Total packets | Discarded packets |
| A | 0 | 92 | 0 |
| B | 0 | 92 | 0 |
| C | 0 | 92 | 0 |
| D | 0 | 92 | 0 |
| Quadrant | Total seconds | Saturated seconds | Saturation percentage |
|---|---|---|---|
| A | 4408 | 2 | 0.045372% |
| B | 4408 | 7 | 0.158802% |
| C | 4408 | 8 | 0.181488% |
| D | 4408 | 79 | 1.792196% |
Noise dominated data is calculated using 1-second bins in cleaned event files. If a bin has >2000 counts, and if more than 50% of those come from <1% of pixels, then it is considered to be noise-dominated and hence unusable.
| Quadrant | # 1 sec bins | Bins with >0 counts | Bins with >2000 counts | High rate bins dominated by noise | Noise dominated (total time) | Noise dominated (detector-on time) | Marked lightcurve |
|---|---|---|---|---|---|---|---|
| A | 6564 | 4409 | 62 | 62 | 0.94% | 1.41% | 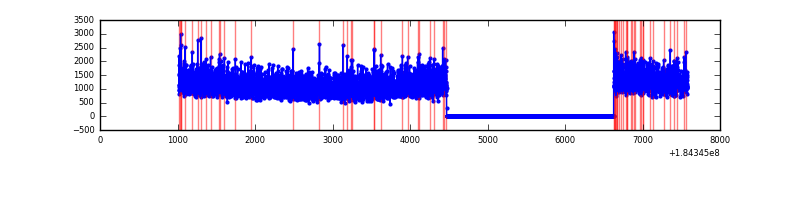 |
| B | 6564 | 4409 | 57 | 57 | 0.87% | 1.29% | 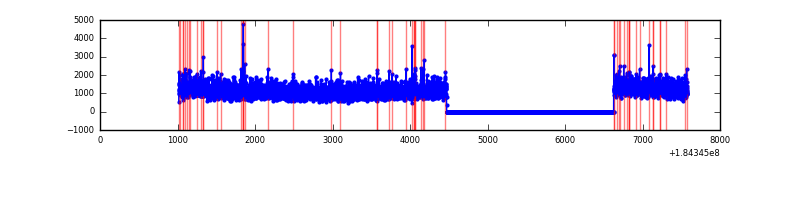 |
| C | 6564 | 4409 | 73 | 73 | 1.11% | 1.66% | 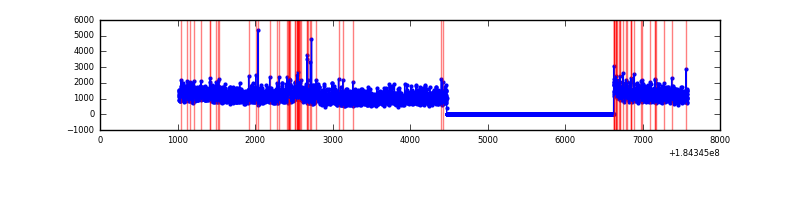 |
| D | 6564 | 4409 | 751 | 751 | 11.44% | 17.03% | 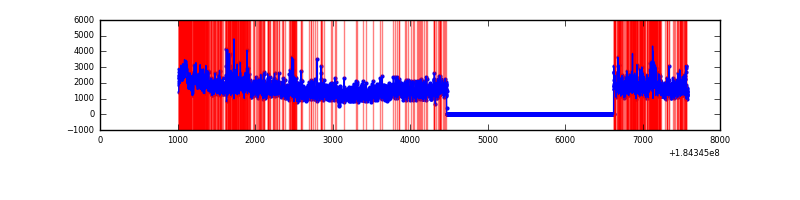 |
Top three noisy pixels from each quadrant. If the there are fewer than three noisy pixels in the level2.evt file, extra rows are filled as -1
| Pixel properties | Quadrant properties | ||||||
|---|---|---|---|---|---|---|---|
| Quadrant | DetID | PixID | Counts | Sigma | Mean | Median | Sigma |
| A | 0 | 238 | 64141 | 221.06 | 1273 | 1256 | 284.5 |
| A | 13 | 160 | 17060 | 55.56 | 1273 | 1256 | 284.5 |
| A | 14 | 79 | 15321 | 49.44 | 1273 | 1256 | 284.5 |
| B | 8 | 4 | 65028 | 211.82 | 1285 | 1287 | 300.9 |
| B | 5 | 46 | 32176 | 102.65 | 1285 | 1287 | 300.9 |
| B | 4 | 206 | 17675 | 54.46 | 1285 | 1287 | 300.9 |
| C | 1 | 1 | 187683 | 552.8 | 1204 | 1247 | 337.3 |
| C | 3 | 159 | 137361 | 403.59 | 1204 | 1247 | 337.3 |
| C | 15 | 241 | 11274 | 29.73 | 1204 | 1247 | 337.3 |
| D | 1 | 239 | 1684243 | 4739.78 | 1141 | 1190 | 355.1 |
| D | 2 | 33 | 343158 | 963.04 | 1141 | 1190 | 355.1 |
| D | 1 | 4 | 253091 | 709.4 | 1141 | 1190 | 355.1 |
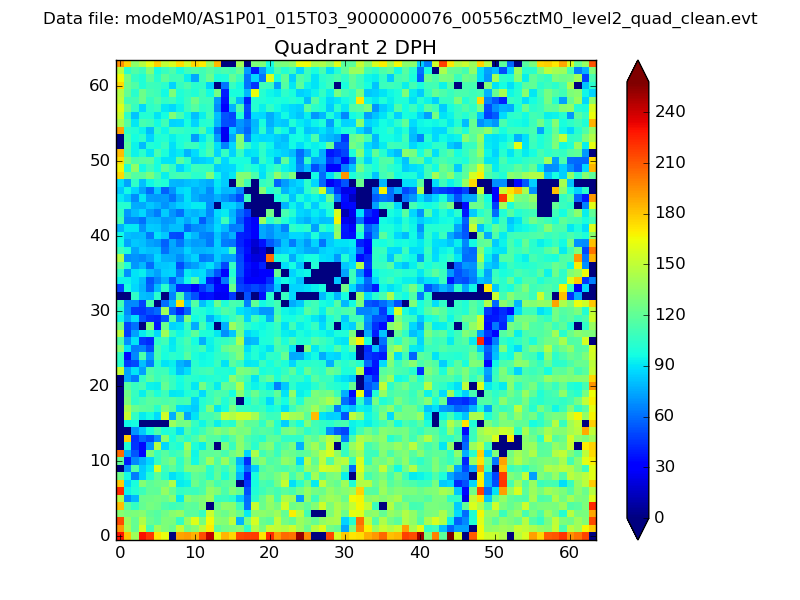
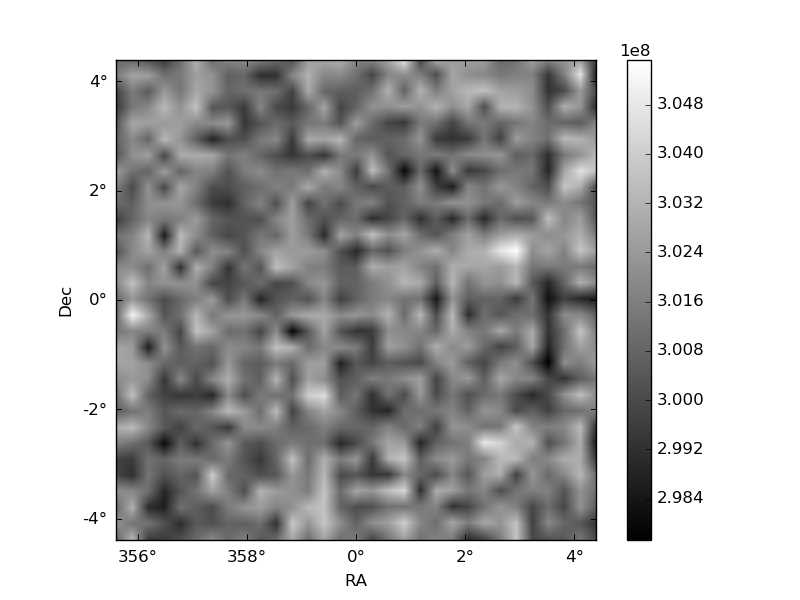
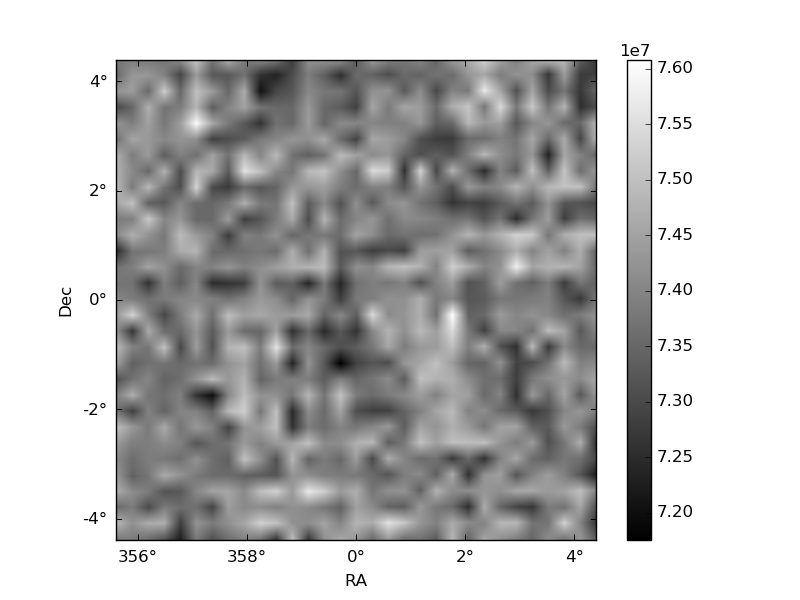
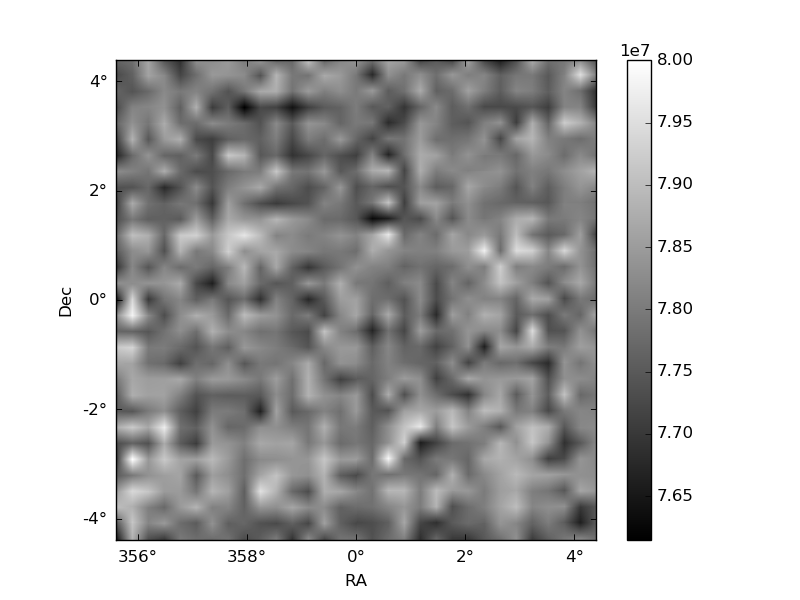
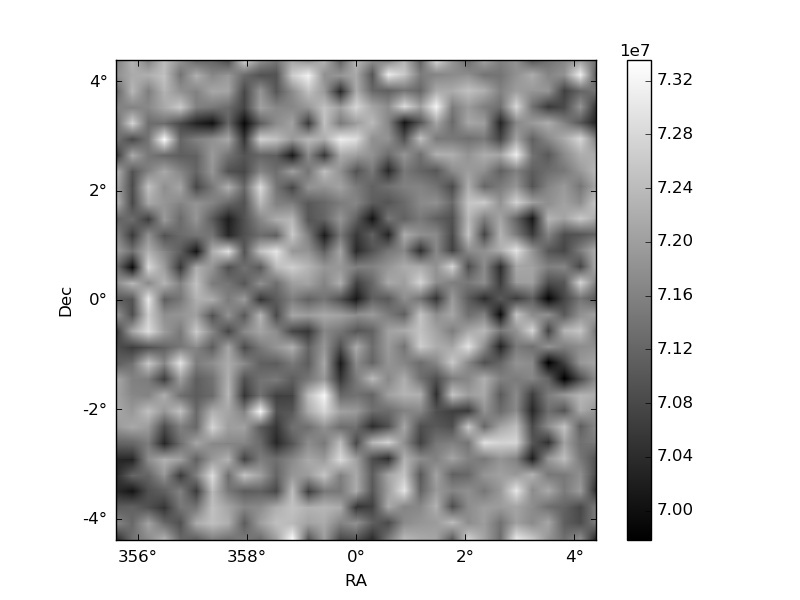
Histogram calculated using DETX and DETY for each event in the final _common_clean file
| Quadrant A | 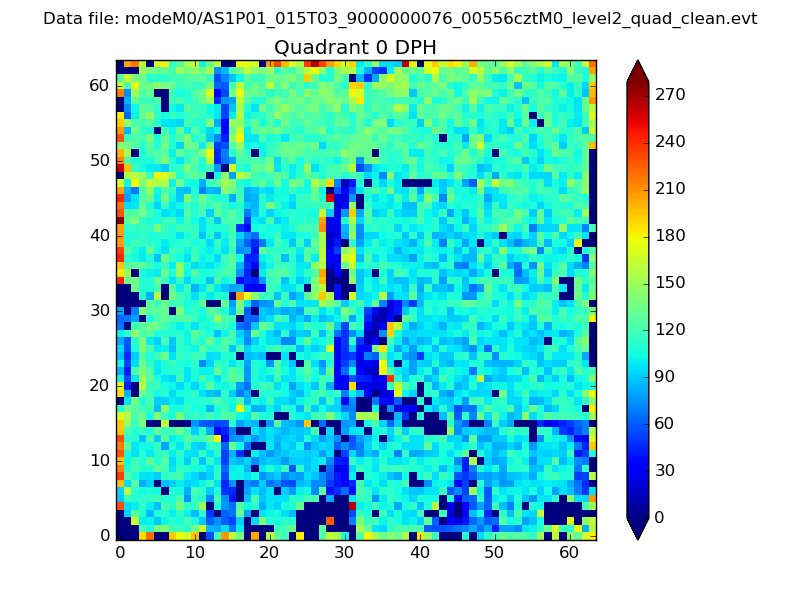 |
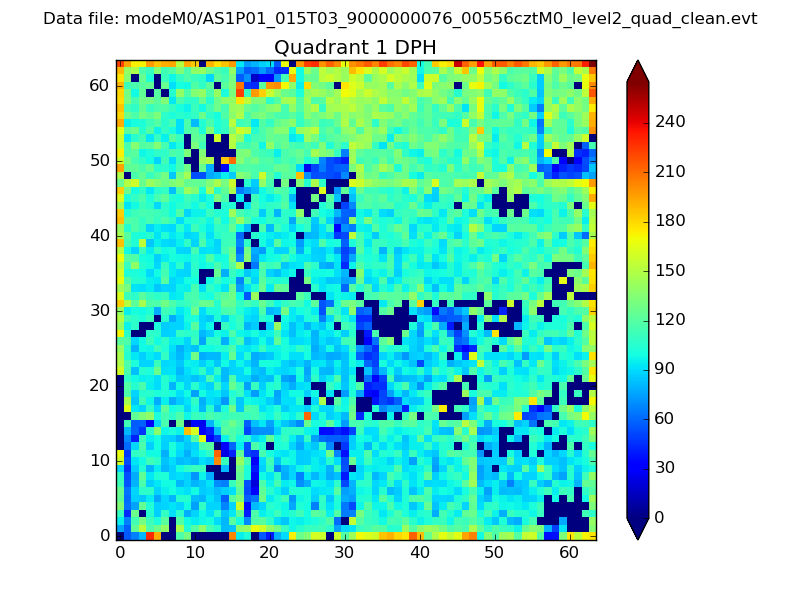 |
Quadrant B |
|---|---|---|---|
| Quadrant D | 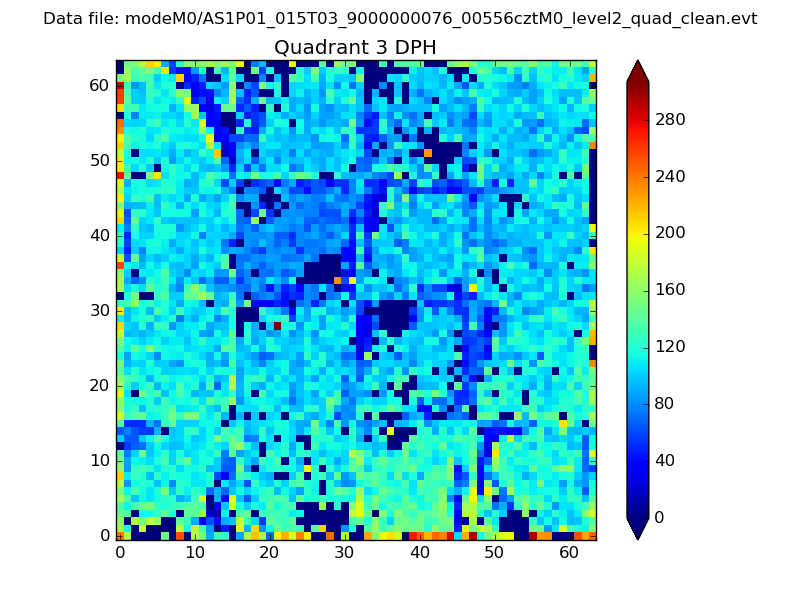 |
 |
Quadrant C |
| Plot type | Count rate plots | Images |
|---|---|---|
| Comparison with Poisson distribution Blue bars denote a histogram of data divided into 1 sec bins. Red curve is a Poisson curve with rate = median count rate of data. |
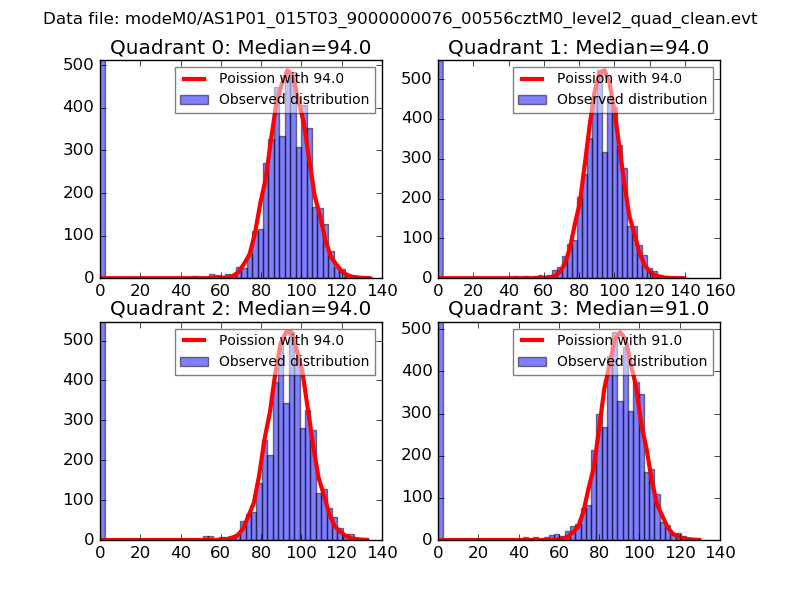 |
 |
| Quadrant-wise count rates Data is divided into 100 sec bins |
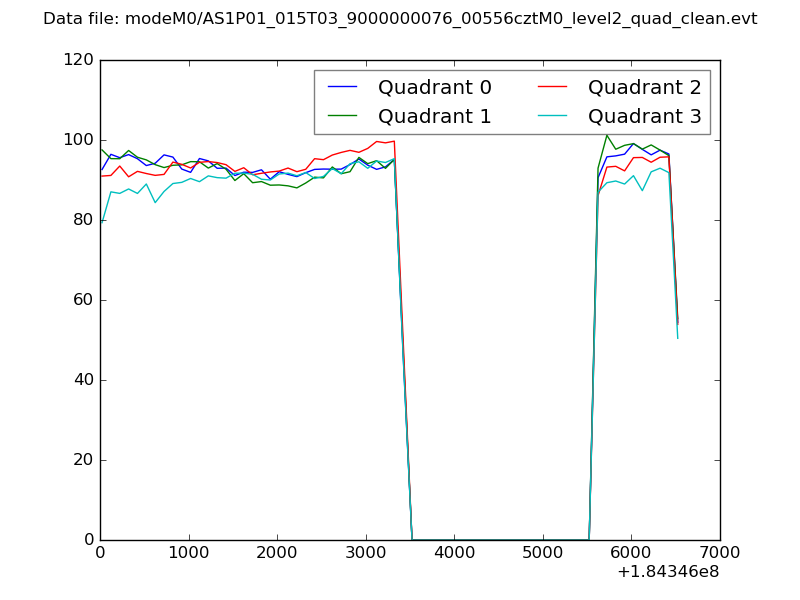 |
|
| Module-wise count rates for Quadrant A Data is divided into 100 sec bins |
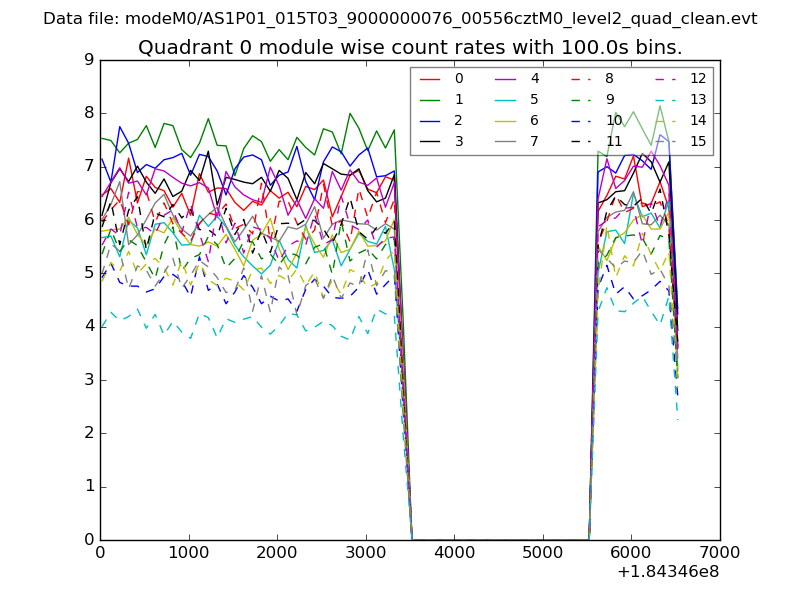 |
 |
| Module-wise count rates for Quadrant B Data is divided into 100 sec bins |
 |
 |
| Module-wise count rates for Quadrant C Data is divided into 100 sec bins |
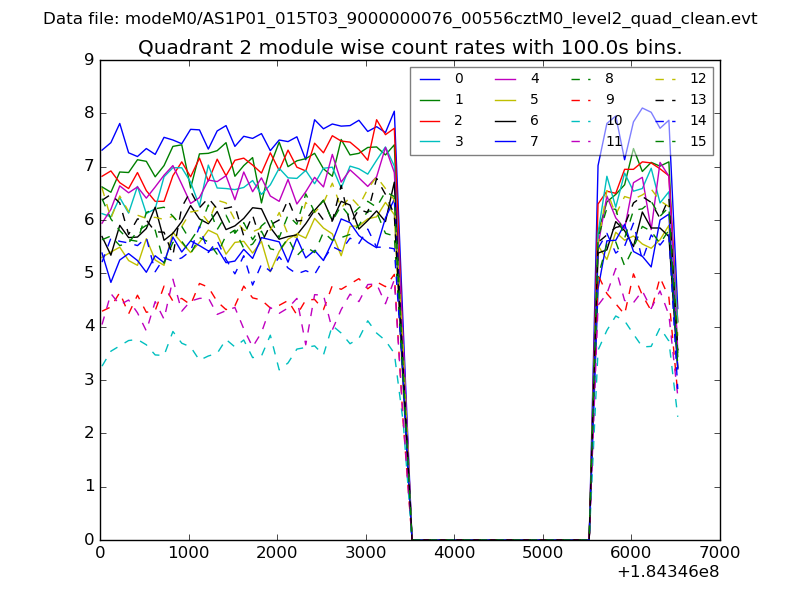 |
 |
| Module-wise count rates for Quadrant D Data is divided into 100 sec bins |
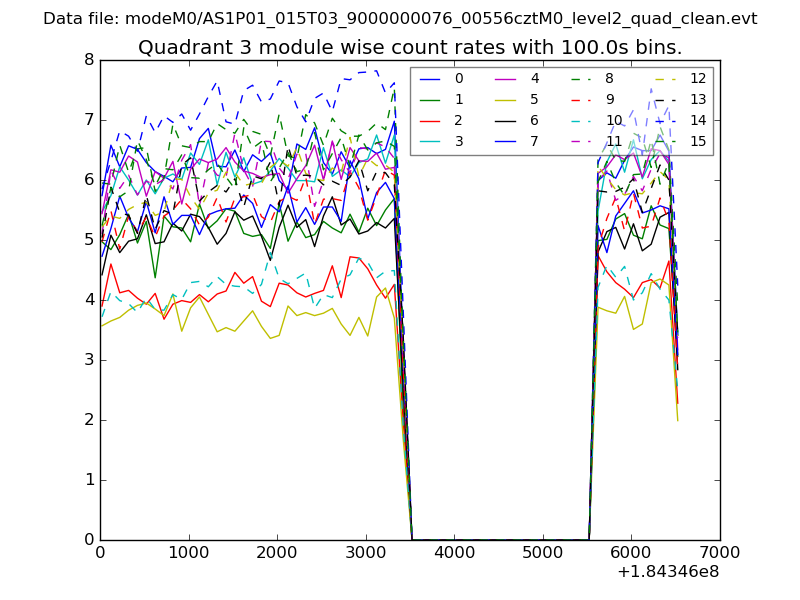 |
 |
| Parameter | Plot |
|---|---|
| CZT HV Monitor | 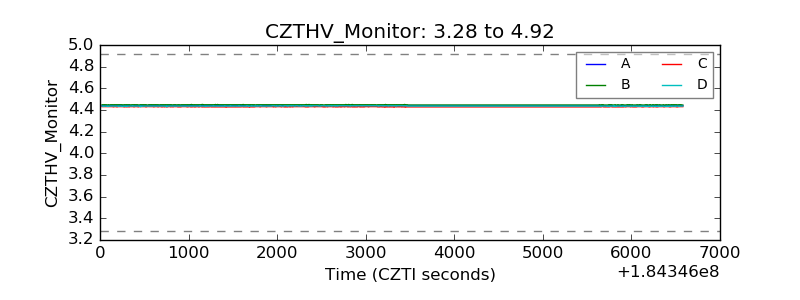 |
| D_VDD | 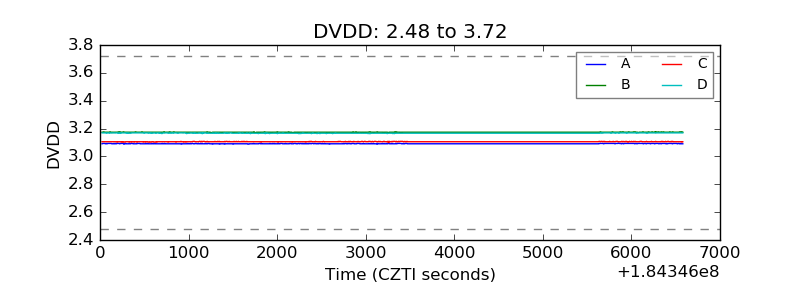 |
| Temperature 1 | 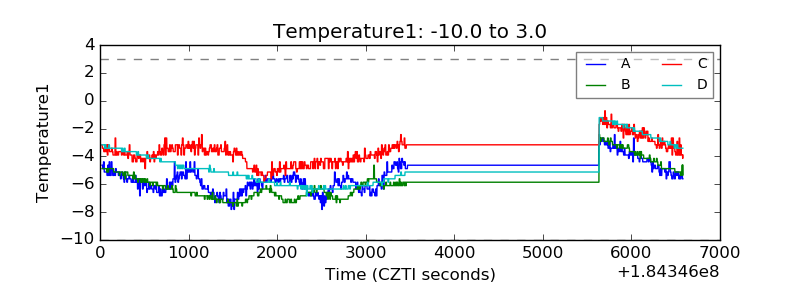 |
| Veto HV Monitor | 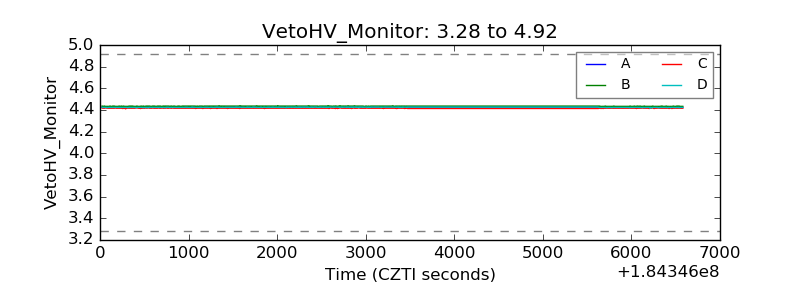 |
| Veto LLD | 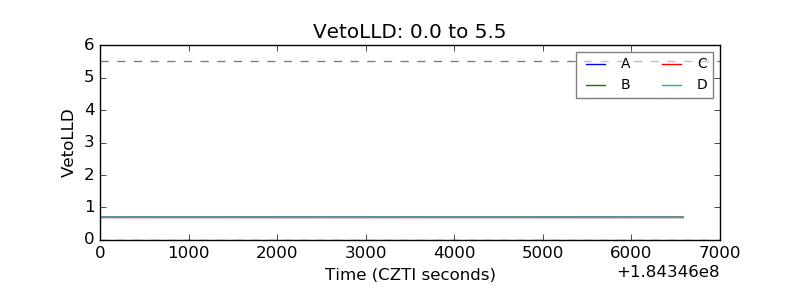 |
| Alpha Counter | 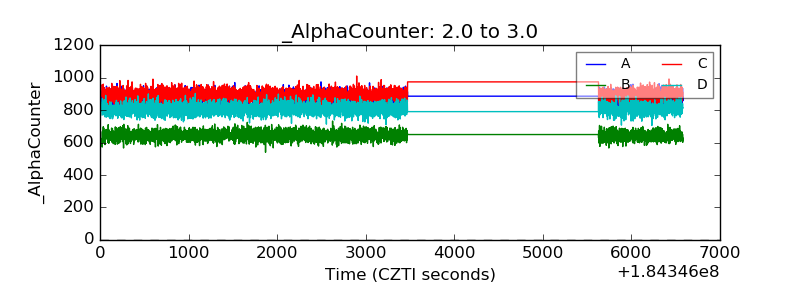 |
| _CPM_Rate | 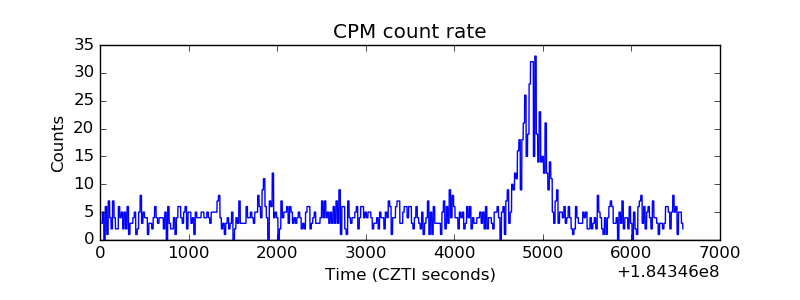 |
| CZT Counter | 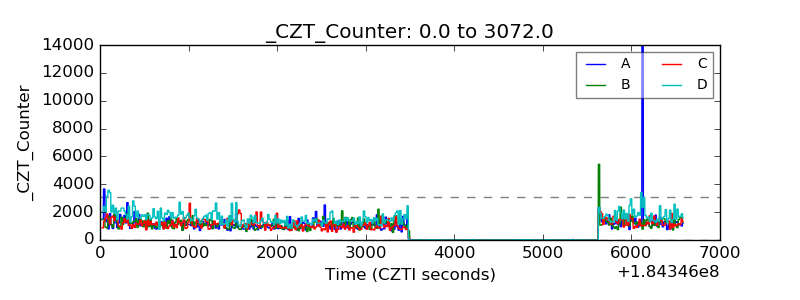 |
| +2.5 Volts monitor |  |
| +5 Volts monitor |  |
| _ROLL_ROT | 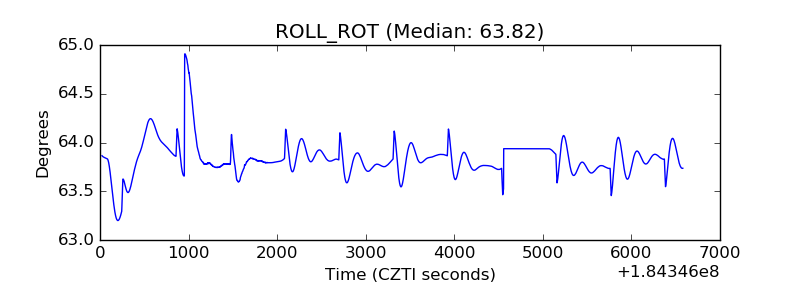 |
| _Roll_DEC | 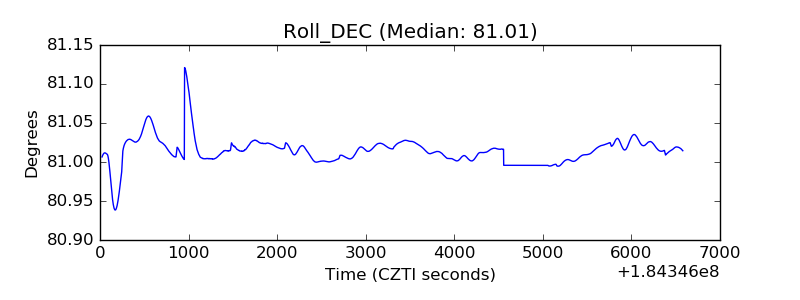 |
| _Roll_RA | 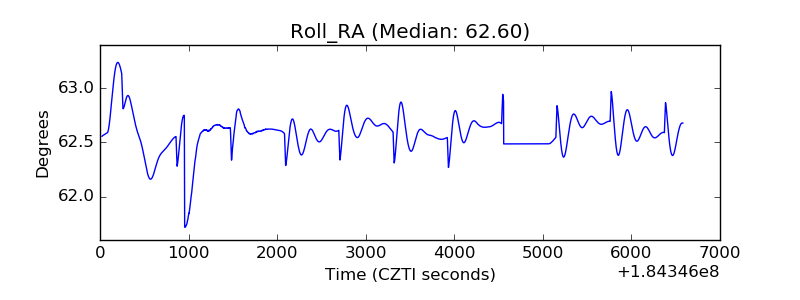 |
| Veto Counter | 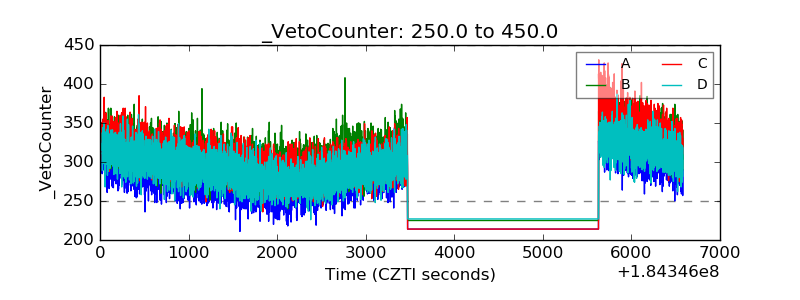 |