| Param | Original file | Final file |
|---|---|---|
| Filename | modeM0/AS1P01_015T03_9000000076_00557cztM0_level2.evt | modeM0/AS1P01_015T03_9000000076_00557cztM0_level2_quad_clean.evt |
| Size (bytes) | 537,785,280 | 44,118,720 |
| Size | 512.9 MB | 42.1 MB |
| Events in quadrant A | 3,654,816 | 285,755 |
| Events in quadrant B | 3,672,847 | 287,239 |
| Events in quadrant C | 3,633,547 | 284,899 |
| Events in quadrant D | 5,127,431 | 265,785 |
| Mode M0 | |||
|---|---|---|---|
| Quadrant | BADHDUFLAG | Total packets | Discarded packets |
| A | 0 | 17441 | 4454 |
| B | 0 | 17582 | 4562 |
| C | 0 | 17114 | 4182 |
| D | 0 | 23825 | 6575 |
| Mode M9 | |||
|---|---|---|---|
| Quadrant | BADHDUFLAG | Total packets | Discarded packets |
| A | 0 | 27 | 2 |
| B | 0 | 28 | 3 |
| C | 0 | 27 | 2 |
| D | 0 | 27 | 2 |
| Mode SS | |||
|---|---|---|---|
| Quadrant | BADHDUFLAG | Total packets | Discarded packets |
| A | 0 | 85 | 19 |
| B | 0 | 83 | 25 |
| C | 0 | 82 | 18 |
| D | 0 | 85 | 21 |
| Quadrant | Total seconds | Saturated seconds | Saturation percentage |
|---|---|---|---|
| A | 2985 | 3 | 0.100503% |
| B | 2976 | 5 | 0.168011% |
| C | 2984 | 4 | 0.134048% |
| D | 2917 | 61 | 2.091190% |
Noise dominated data is calculated using 1-second bins in cleaned event files. If a bin has >2000 counts, and if more than 50% of those come from <1% of pixels, then it is considered to be noise-dominated and hence unusable.
| Quadrant | # 1 sec bins | Bins with >0 counts | Bins with >2000 counts | High rate bins dominated by noise | Noise dominated (total time) | Noise dominated (detector-on time) | Marked lightcurve |
|---|---|---|---|---|---|---|---|
| A | 7274 | 3078 | 64 | 64 | 0.88% | 2.08% | 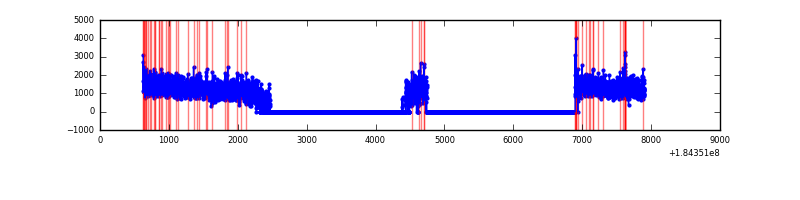 |
| B | 7274 | 3075 | 53 | 53 | 0.73% | 1.72% | 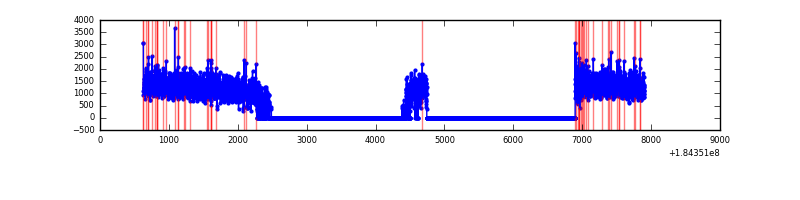 |
| C | 7274 | 3083 | 55 | 55 | 0.76% | 1.78% | 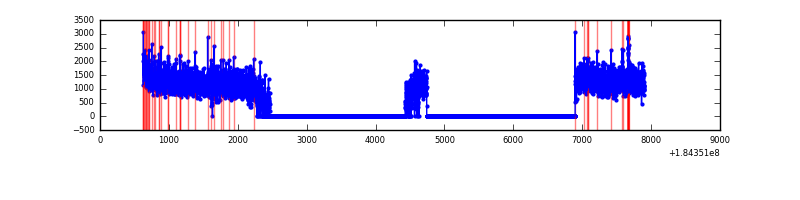 |
| D | 7274 | 3020 | 624 | 624 | 8.58% | 20.66% | 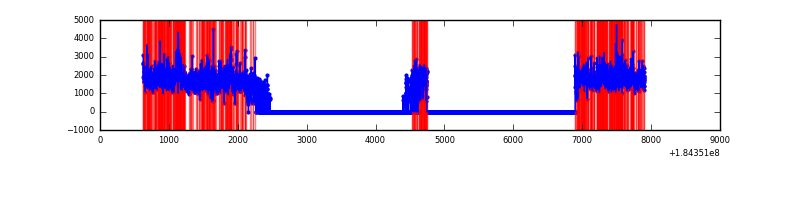 |
Top three noisy pixels from each quadrant. If the there are fewer than three noisy pixels in the level2.evt file, extra rows are filled as -1
| Pixel properties | Quadrant properties | ||||||
|---|---|---|---|---|---|---|---|
| Quadrant | DetID | PixID | Counts | Sigma | Mean | Median | Sigma |
| A | 0 | 238 | 26883 | 126.71 | 926 | 912 | 205.0 |
| A | 13 | 160 | 19221 | 89.33 | 926 | 912 | 205.0 |
| A | 15 | 53 | 10352 | 46.06 | 926 | 912 | 205.0 |
| B | 8 | 4 | 36164 | 161.42 | 925 | 926 | 218.3 |
| B | 4 | 206 | 24892 | 109.78 | 925 | 926 | 218.3 |
| B | 5 | 46 | 21705 | 95.18 | 925 | 926 | 218.3 |
| C | 1 | 1 | 81209 | 319.59 | 891 | 926 | 251.2 |
| C | 7 | 222 | 28138 | 108.32 | 891 | 926 | 251.2 |
| C | 15 | 241 | 8146 | 28.74 | 891 | 926 | 251.2 |
| D | 1 | 239 | 1181447 | 4487.01 | 841 | 872 | 263.1 |
| D | 13 | 221 | 208237 | 788.13 | 841 | 872 | 263.1 |
| D | 1 | 4 | 129420 | 488.57 | 841 | 872 | 263.1 |
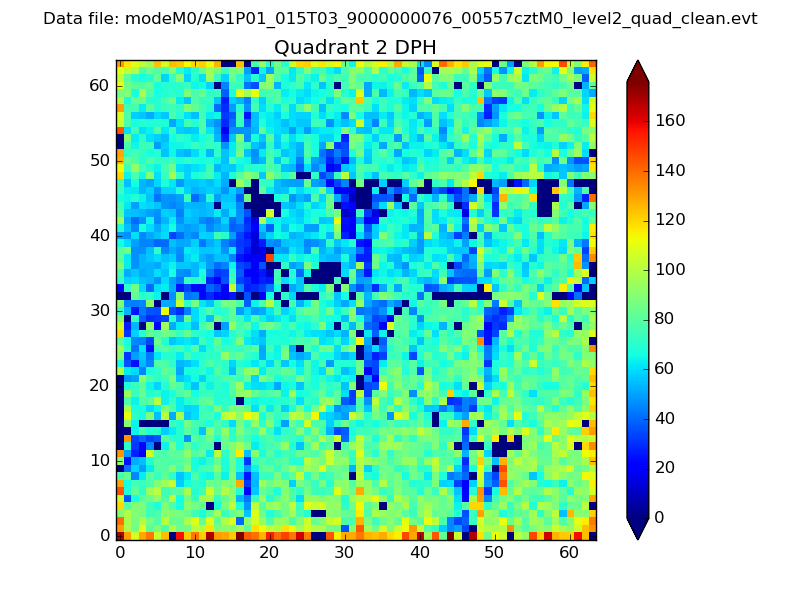
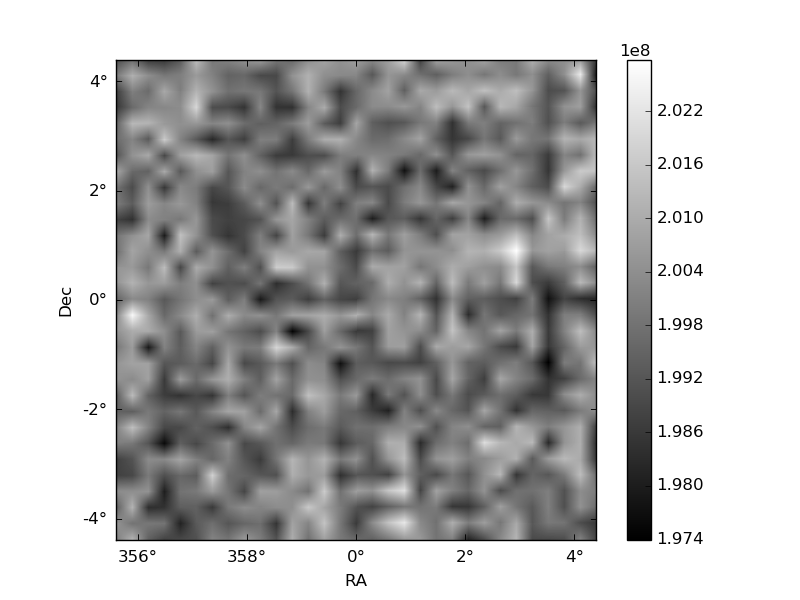
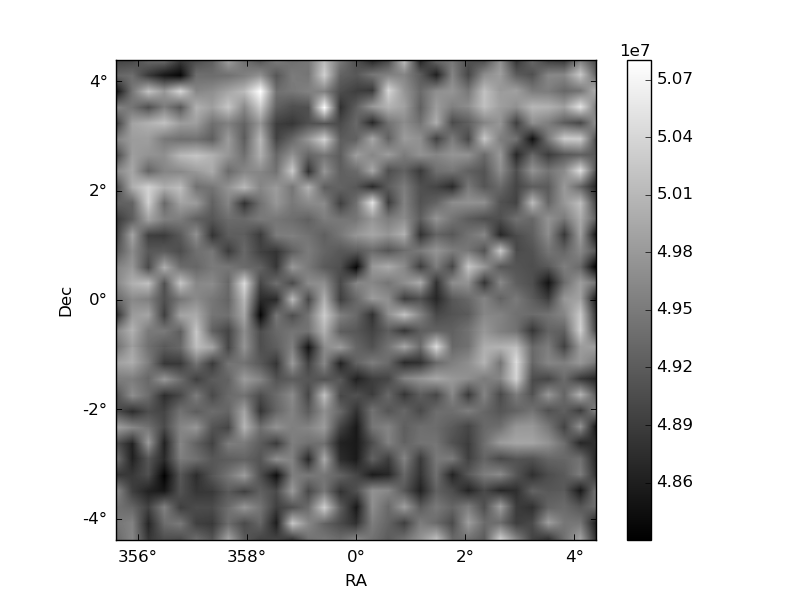
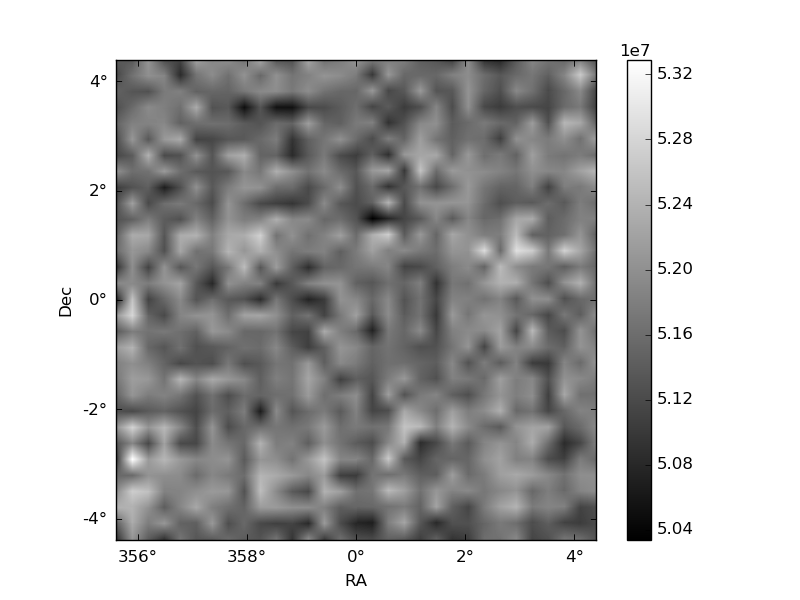
Histogram calculated using DETX and DETY for each event in the final _common_clean file
| Quadrant A | 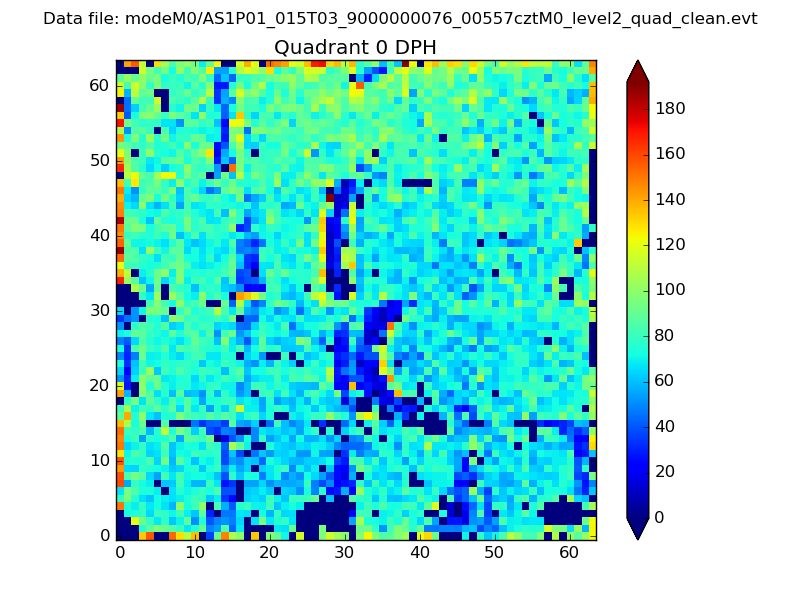 |
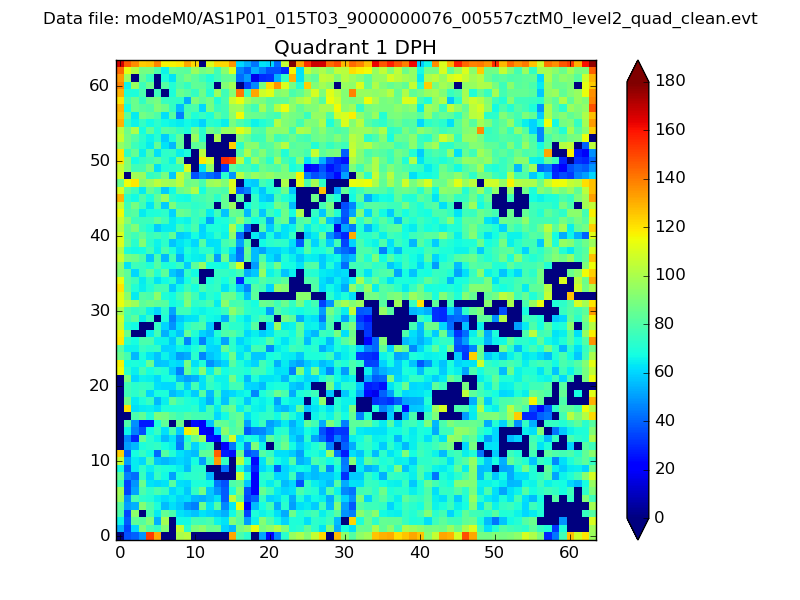 |
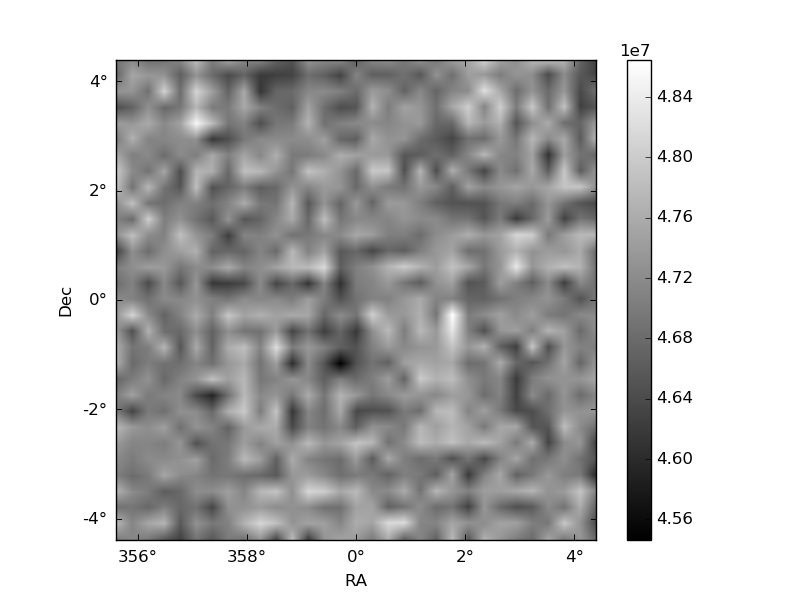
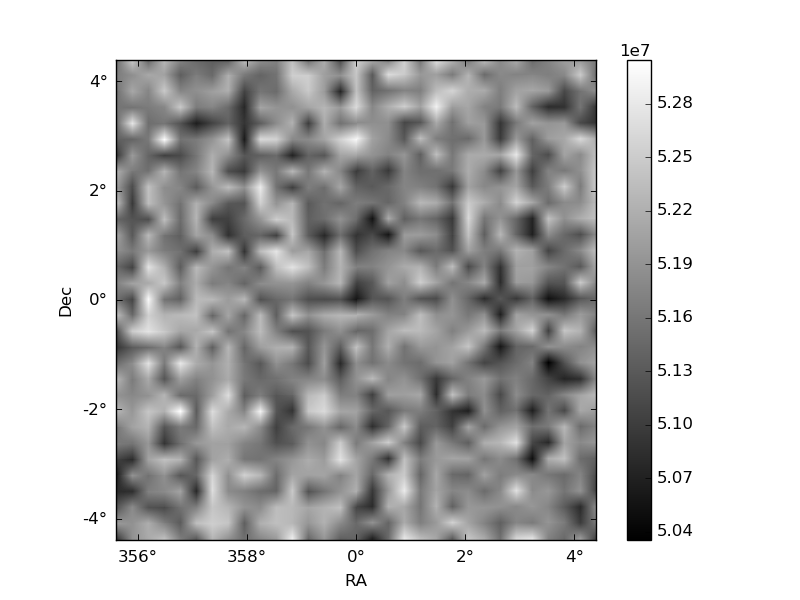
Quadrant B |
|---|---|---|---|
| Quadrant D | 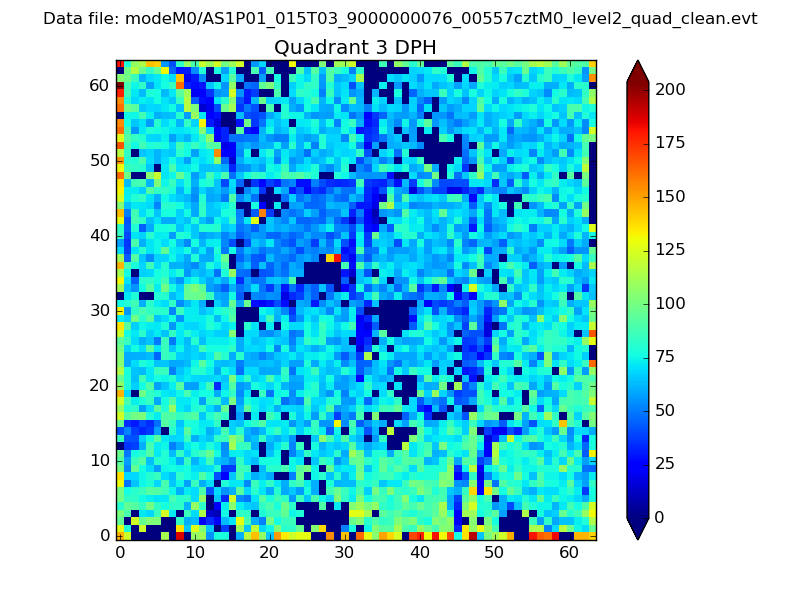 |
 |
Quadrant C |
| Plot type | Count rate plots | Images |
|---|---|---|
| Comparison with Poisson distribution Blue bars denote a histogram of data divided into 1 sec bins. Red curve is a Poisson curve with rate = median count rate of data. |
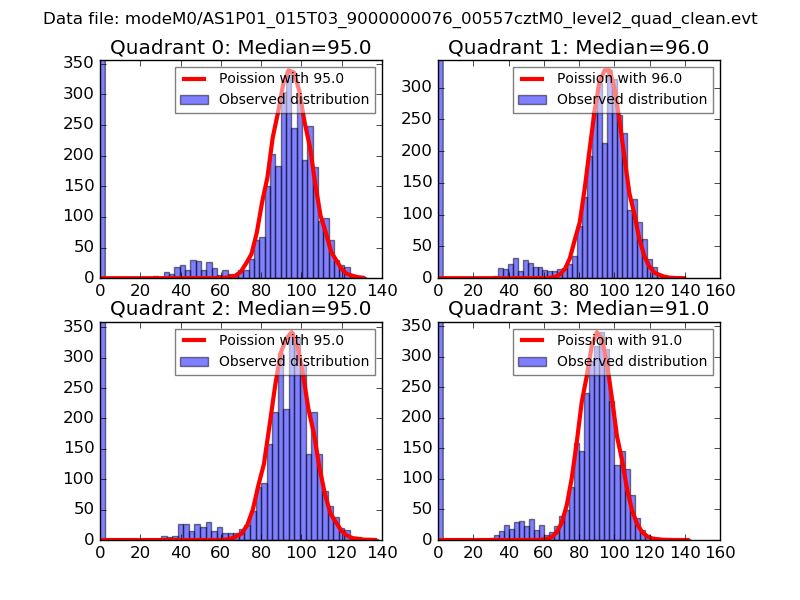 |
 |
| Quadrant-wise count rates Data is divided into 100 sec bins |
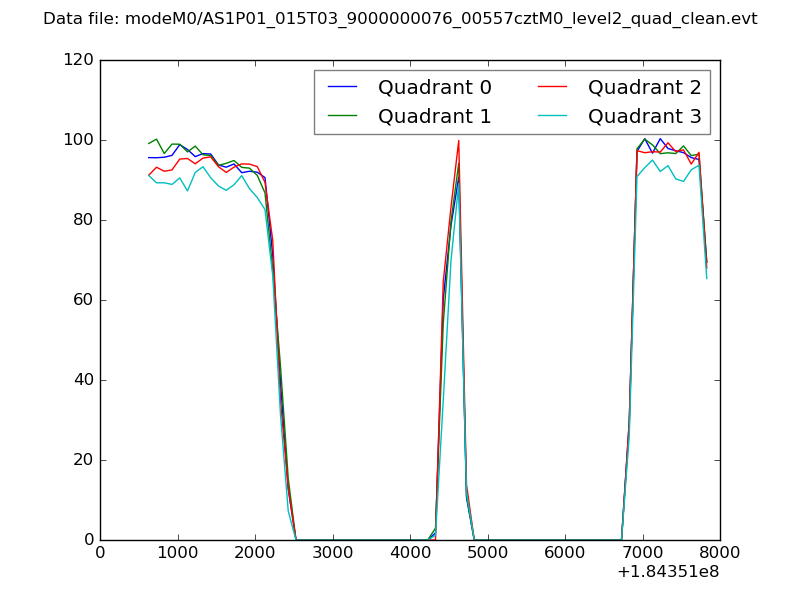 |
|
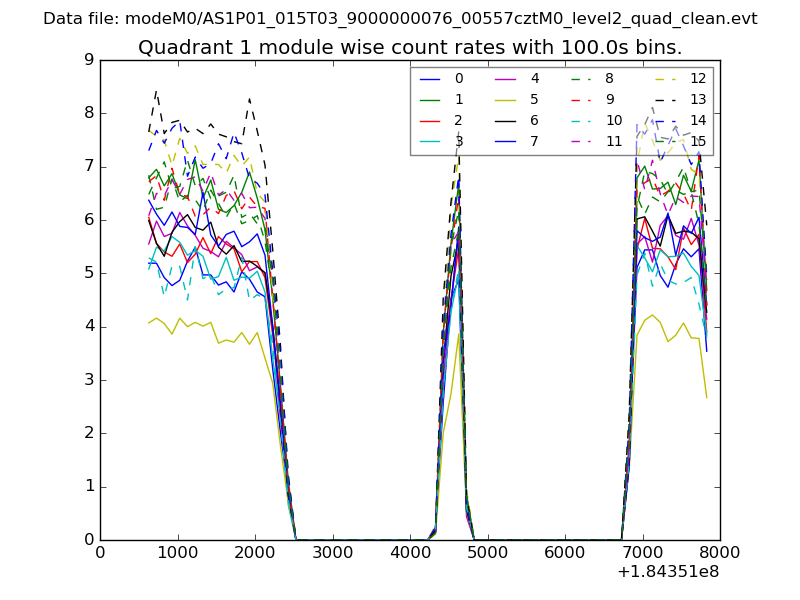
| Module-wise count rates for Quadrant A Data is divided into 100 sec bins |
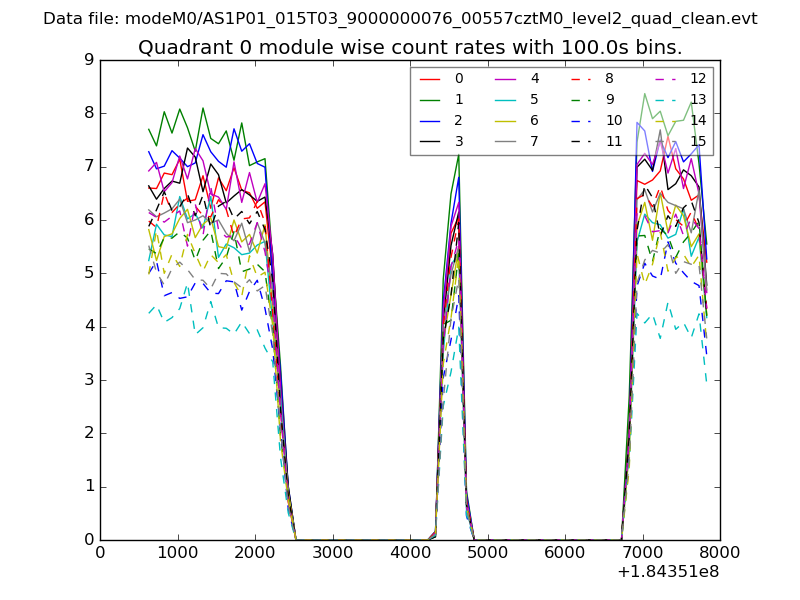 |
 |
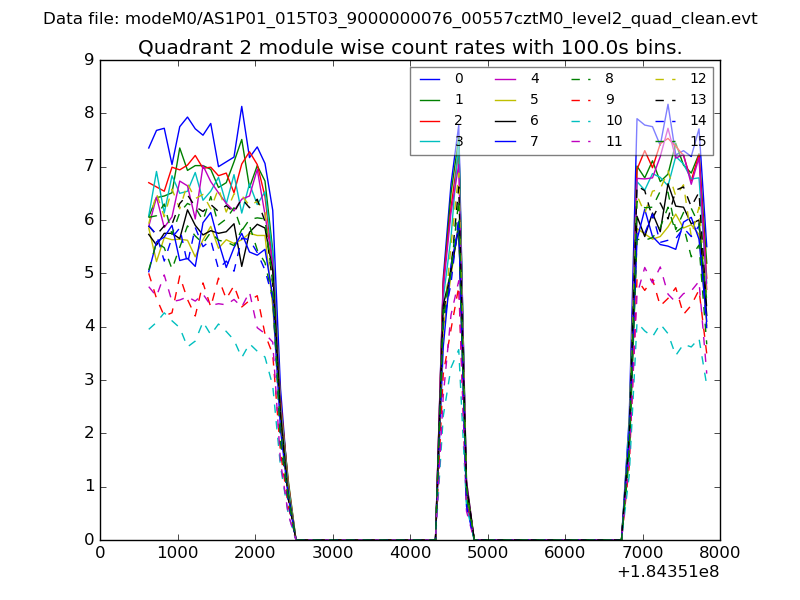
| Module-wise count rates for Quadrant B Data is divided into 100 sec bins |
 |
 |
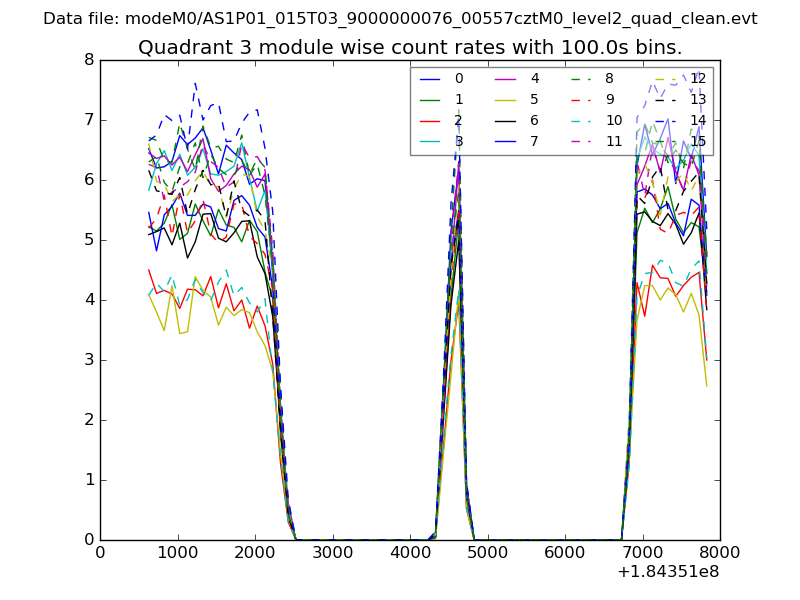
| Module-wise count rates for Quadrant C Data is divided into 100 sec bins |
 |
 |
| Module-wise count rates for Quadrant D Data is divided into 100 sec bins |
 |
 |
| Parameter | Plot |
|---|---|
| CZT HV Monitor | 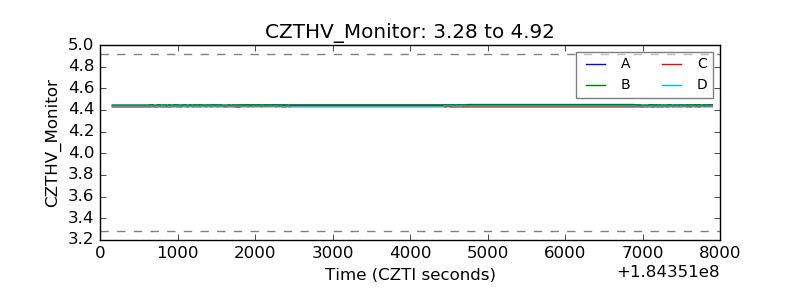 |
| D_VDD | 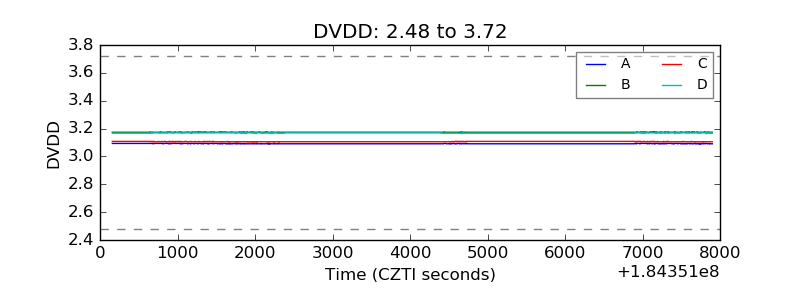 |
| Temperature 1 |  |
| Veto HV Monitor | 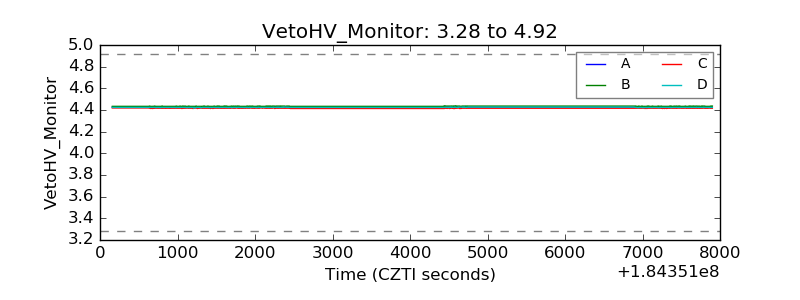 |
| Veto LLD | 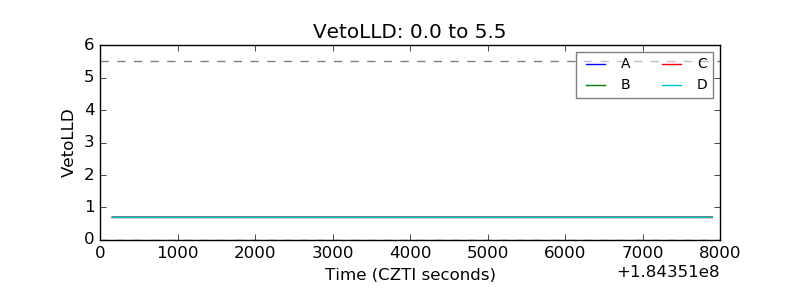 |
| Alpha Counter | 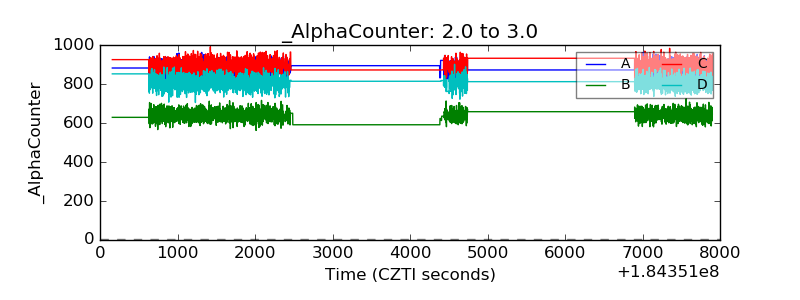 |
| _CPM_Rate | 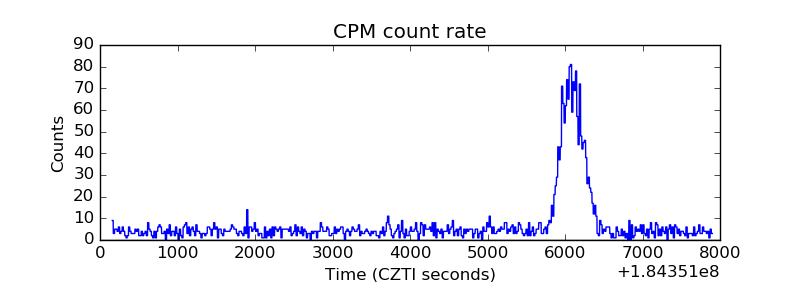 |
| CZT Counter | 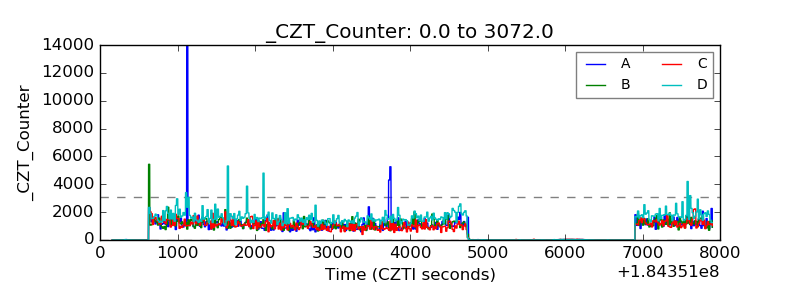 |
| +2.5 Volts monitor |  |
| +5 Volts monitor |  |
| _ROLL_ROT | 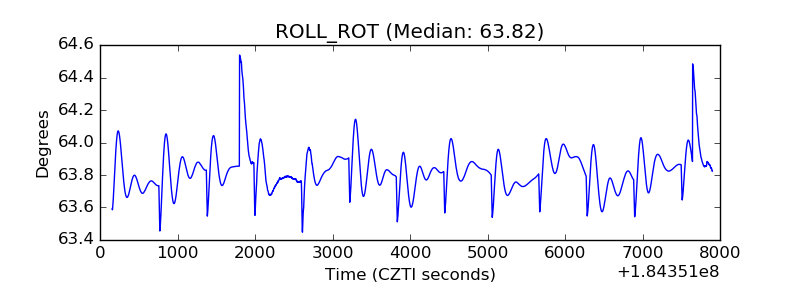 |
| _Roll_DEC | 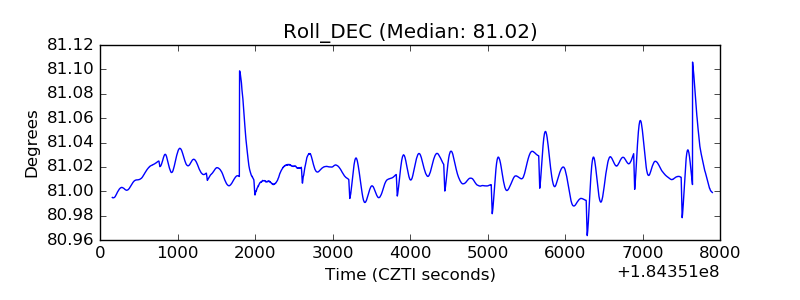 |
| _Roll_RA | 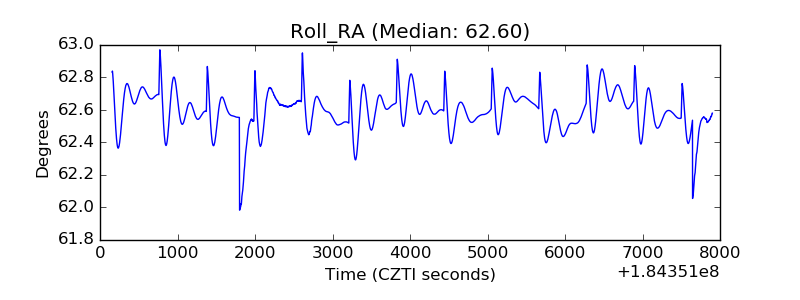 |
| Veto Counter | 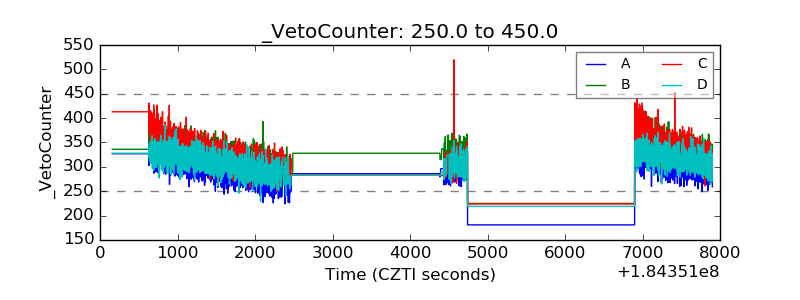 |