| Param | Original file | Final file |
|---|---|---|
| Filename | modeM0/AS1P01_015T03_9000000076_00558cztM0_level2.evt | modeM0/AS1P01_015T03_9000000076_00558cztM0_level2_quad_clean.evt |
| Size (bytes) | 856,869,120 | 74,401,920 |
| Size | 817.2 MB | 71.0 MB |
| Events in quadrant A | 5,844,969 | 474,751 |
| Events in quadrant B | 6,051,636 | 475,437 |
| Events in quadrant C | 5,512,070 | 483,841 |
| Events in quadrant D | 8,205,288 | 463,349 |
| Mode M0 | |||
|---|---|---|---|
| Quadrant | BADHDUFLAG | Total packets | Discarded packets |
| A | 0 | 20969 | 3 |
| B | 0 | 21563 | 2 |
| C | 0 | 20025 | 2 |
| D | 0 | 27951 | 2 |
| Mode M9 | |||
|---|---|---|---|
| Quadrant | BADHDUFLAG | Total packets | Discarded packets |
| A | 0 | 24 | 0 |
| B | 0 | 24 | 0 |
| C | 0 | 24 | 0 |
| D | 0 | 25 | 0 |
| Mode SS | |||
|---|---|---|---|
| Quadrant | BADHDUFLAG | Total packets | Discarded packets |
| A | 0 | 102 | 0 |
| B | 0 | 102 | 0 |
| C | 0 | 102 | 0 |
| D | 0 | 102 | 0 |
| Quadrant | Total seconds | Saturated seconds | Saturation percentage |
|---|---|---|---|
| A | 5077 | 11 | 0.216663% |
| B | 5077 | 6 | 0.118180% |
| C | 5077 | 3 | 0.059090% |
| D | 5077 | 30 | 0.590900% |
Noise dominated data is calculated using 1-second bins in cleaned event files. If a bin has >2000 counts, and if more than 50% of those come from <1% of pixels, then it is considered to be noise-dominated and hence unusable.
| Quadrant | # 1 sec bins | Bins with >0 counts | Bins with >2000 counts | High rate bins dominated by noise | Noise dominated (total time) | Noise dominated (detector-on time) | Marked lightcurve |
|---|---|---|---|---|---|---|---|
| A | 7232 | 5078 | 111 | 111 | 1.53% | 2.19% | 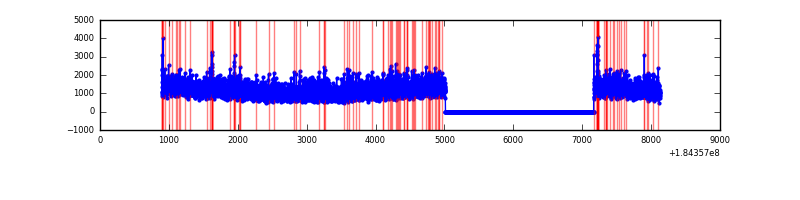 |
| B | 7232 | 5078 | 90 | 90 | 1.24% | 1.77% | 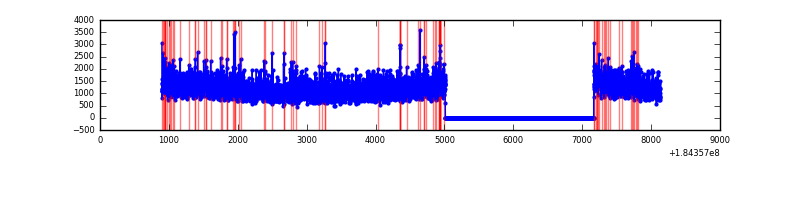 |
| C | 7232 | 5078 | 50 | 50 | 0.69% | 0.98% | 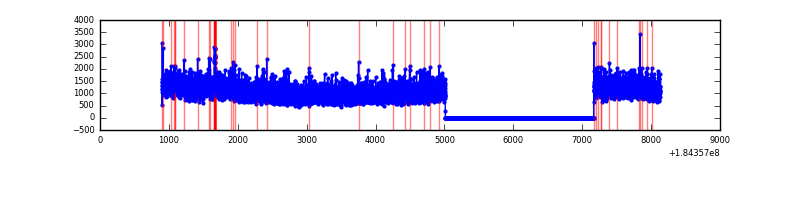 |
| D | 7232 | 5078 | 644 | 644 | 8.90% | 12.68% | 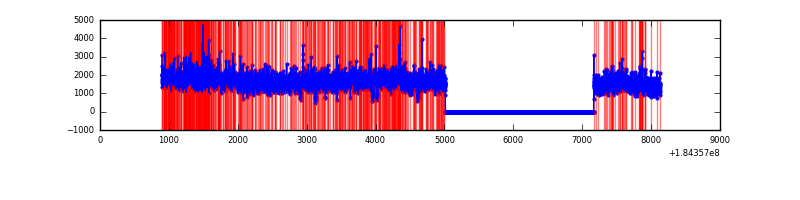 |
Top three noisy pixels from each quadrant. If the there are fewer than three noisy pixels in the level2.evt file, extra rows are filled as -1
| Pixel properties | Quadrant properties | ||||||
|---|---|---|---|---|---|---|---|
| Quadrant | DetID | PixID | Counts | Sigma | Mean | Median | Sigma |
| A | 0 | 69 | 36230 | 104.03 | 1479 | 1458 | 334.3 |
| A | 0 | 238 | 35142 | 100.77 | 1479 | 1458 | 334.3 |
| A | 15 | 171 | 22320 | 62.41 | 1479 | 1458 | 334.3 |
| B | 4 | 206 | 123635 | 347.2 | 1506 | 1512 | 351.7 |
| B | 8 | 4 | 50087 | 138.1 | 1506 | 1512 | 351.7 |
| B | 15 | 185 | 22307 | 59.12 | 1506 | 1512 | 351.7 |
| C | 1 | 1 | 48221 | 121.27 | 1375 | 1424 | 385.9 |
| C | 7 | 222 | 29874 | 73.73 | 1375 | 1424 | 385.9 |
| C | 9 | 206 | 14291 | 33.34 | 1375 | 1424 | 385.9 |
| D | 1 | 239 | 2545801 | 6307.7 | 1296 | 1348 | 403.4 |
| D | 1 | 4 | 194757 | 479.46 | 1296 | 1348 | 403.4 |
| D | 13 | 221 | 187701 | 461.97 | 1296 | 1348 | 403.4 |
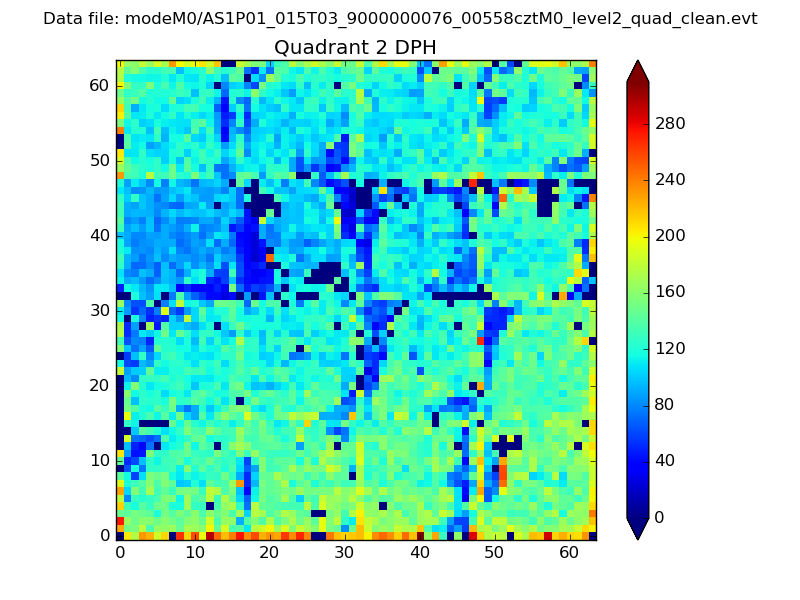
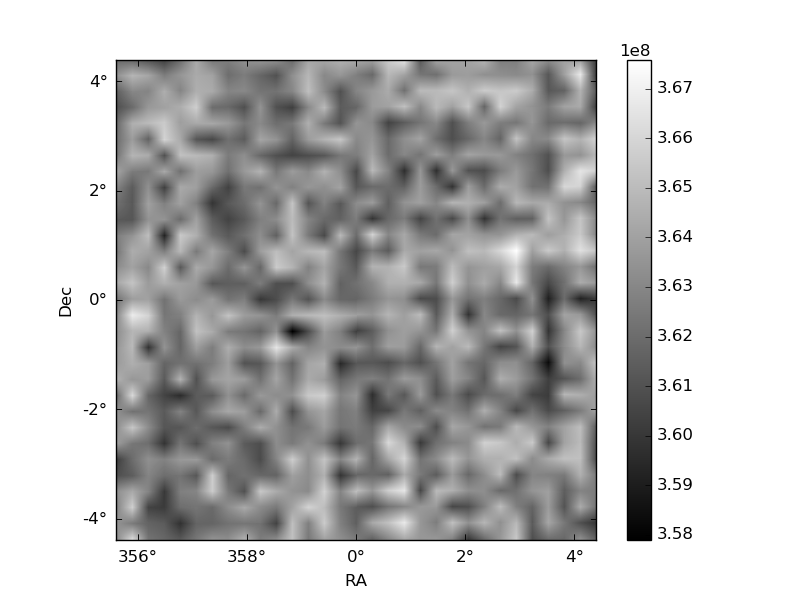
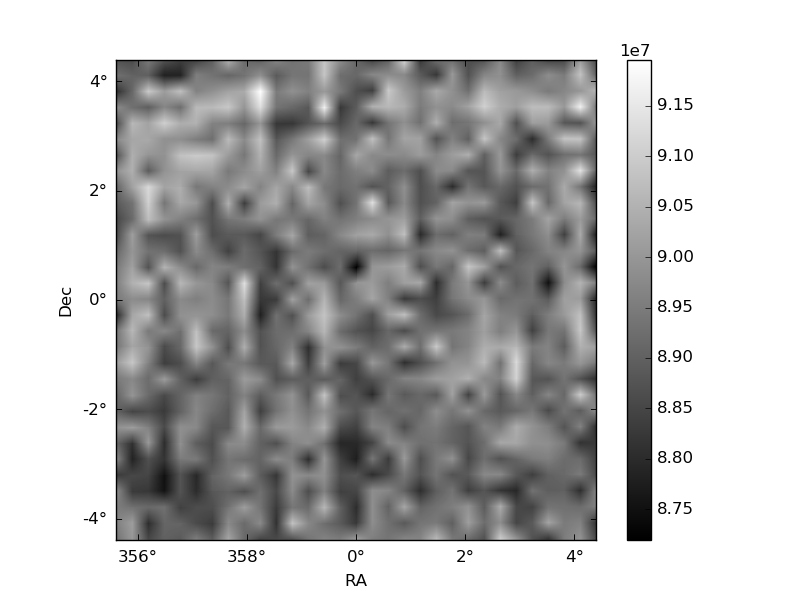
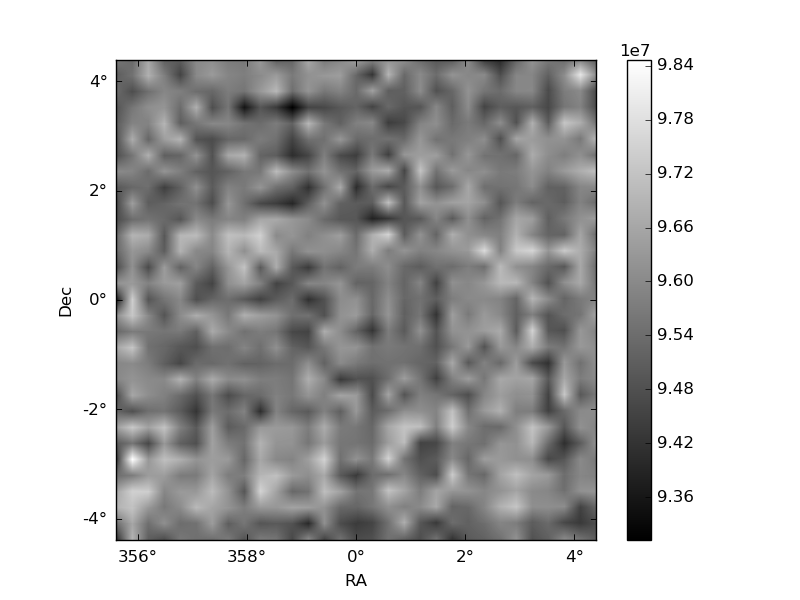
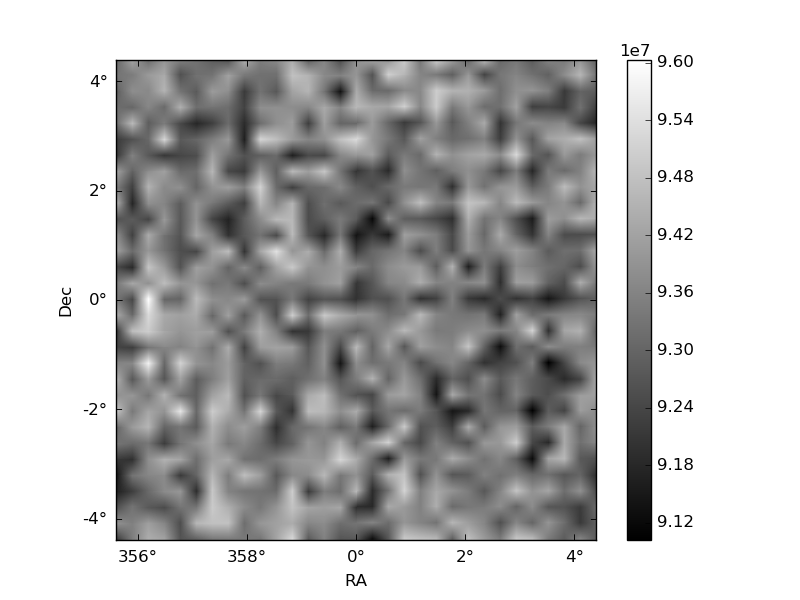
Histogram calculated using DETX and DETY for each event in the final _common_clean file
| Quadrant A | 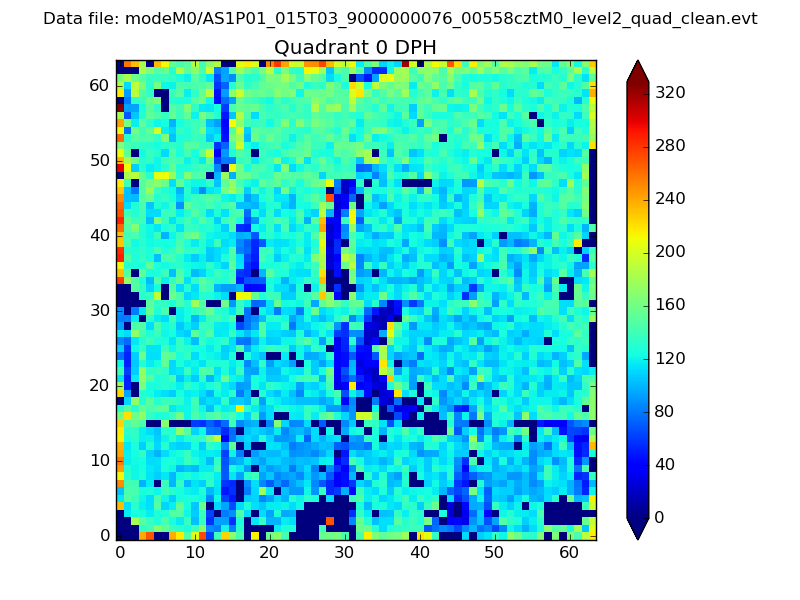 |
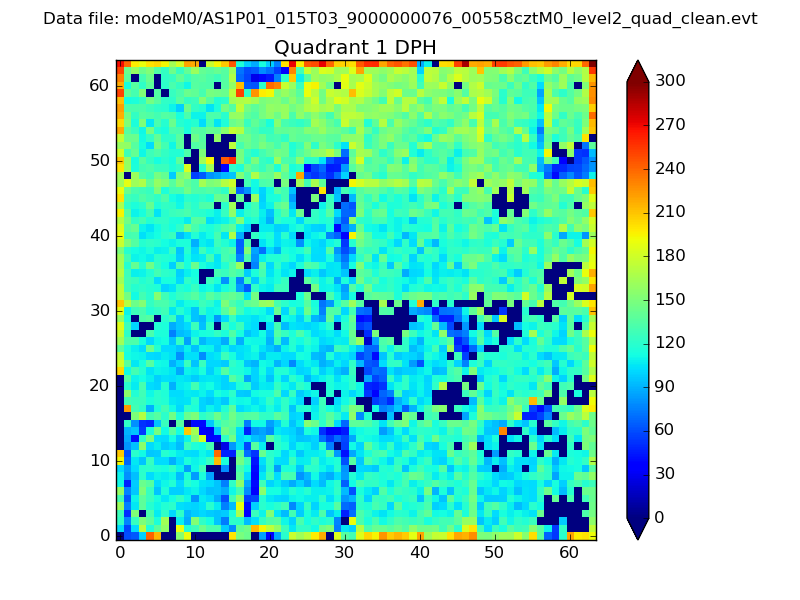 |
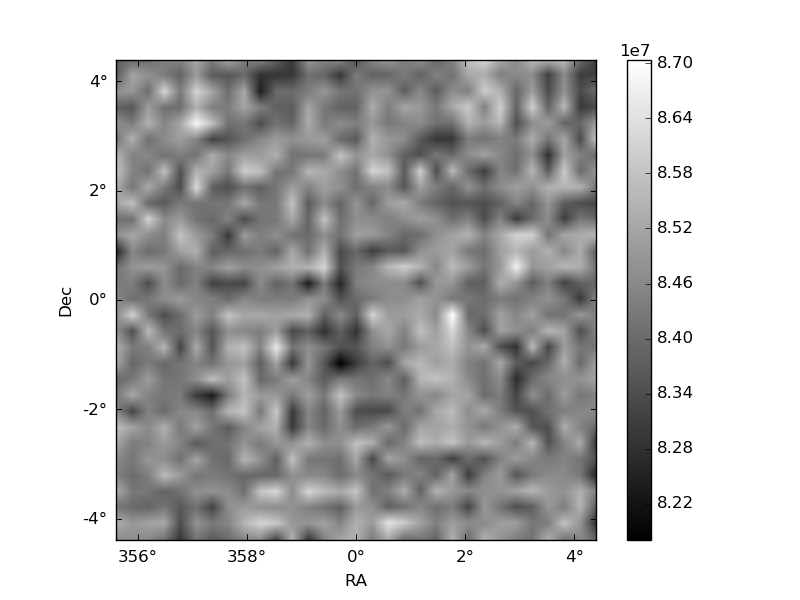
Quadrant B |
|---|---|---|---|
| Quadrant D | 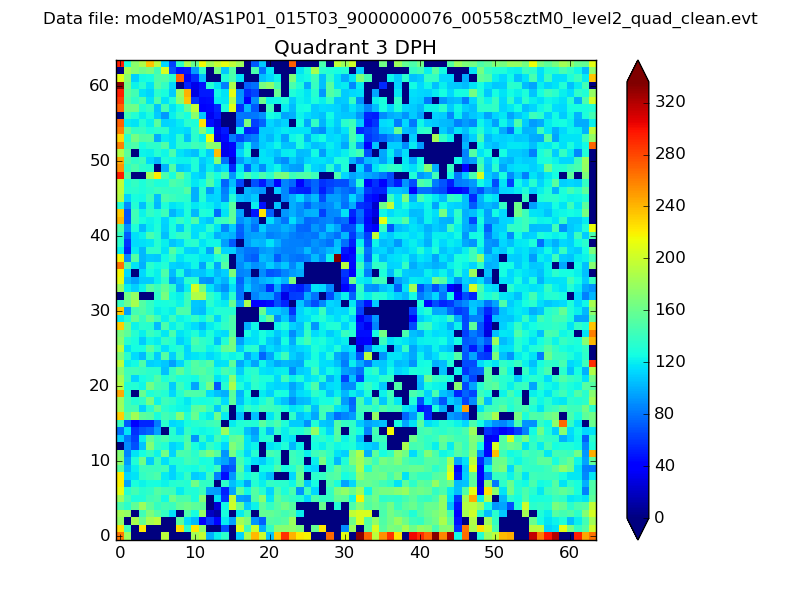 |
 |
Quadrant C |
| Plot type | Count rate plots | Images |
|---|---|---|
| Comparison with Poisson distribution Blue bars denote a histogram of data divided into 1 sec bins. Red curve is a Poisson curve with rate = median count rate of data. |
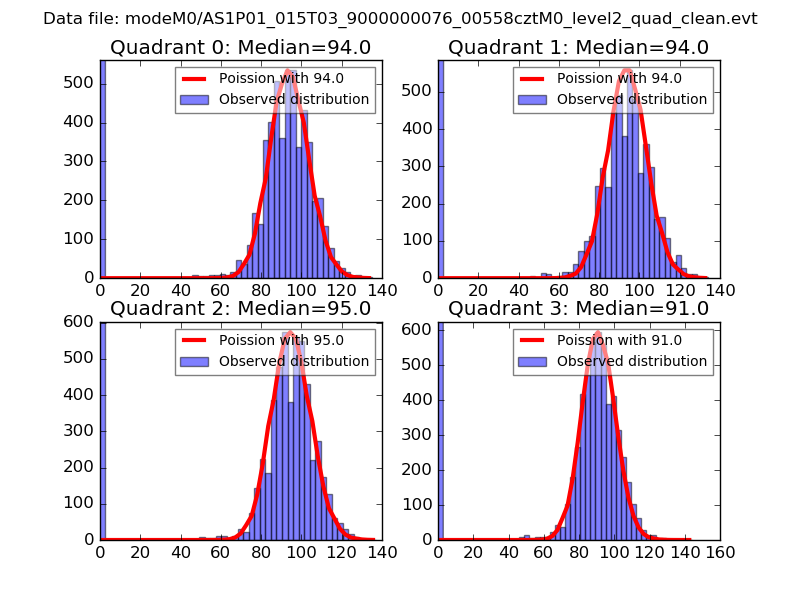 |
 |
| Quadrant-wise count rates Data is divided into 100 sec bins |
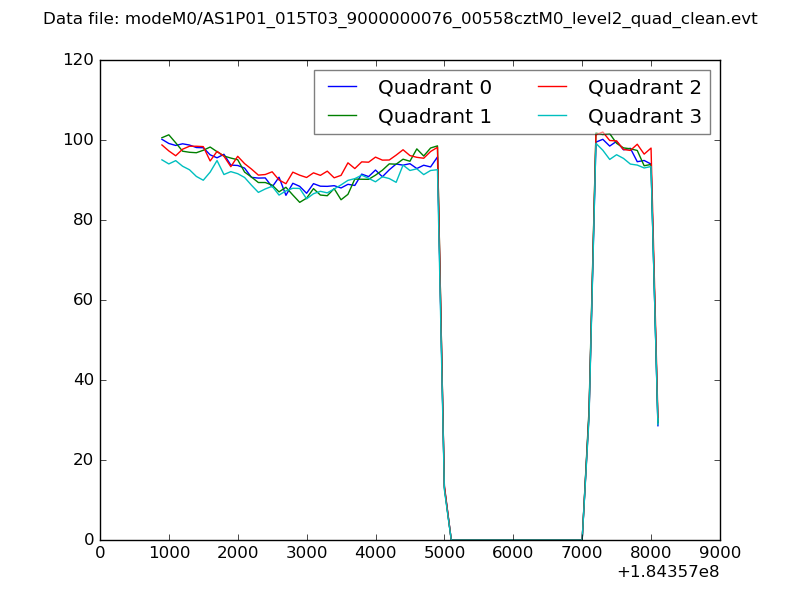 |
|
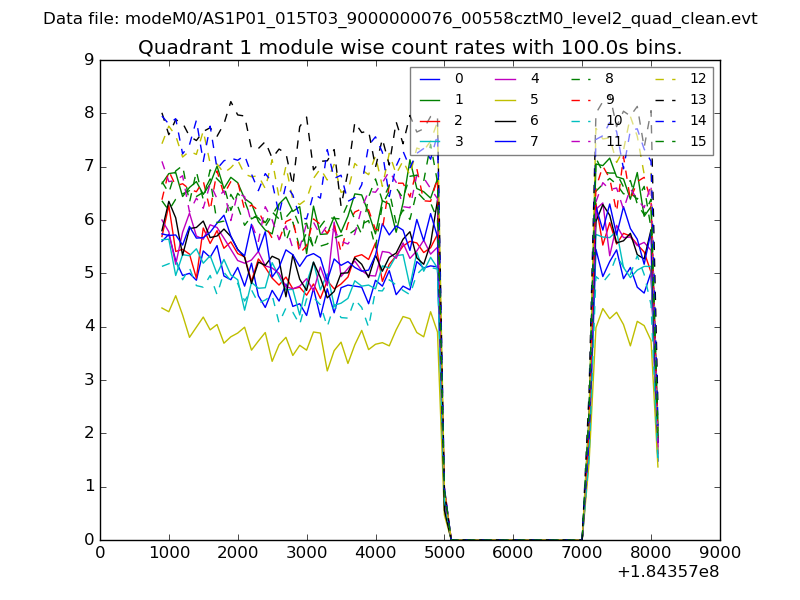
| Module-wise count rates for Quadrant A Data is divided into 100 sec bins |
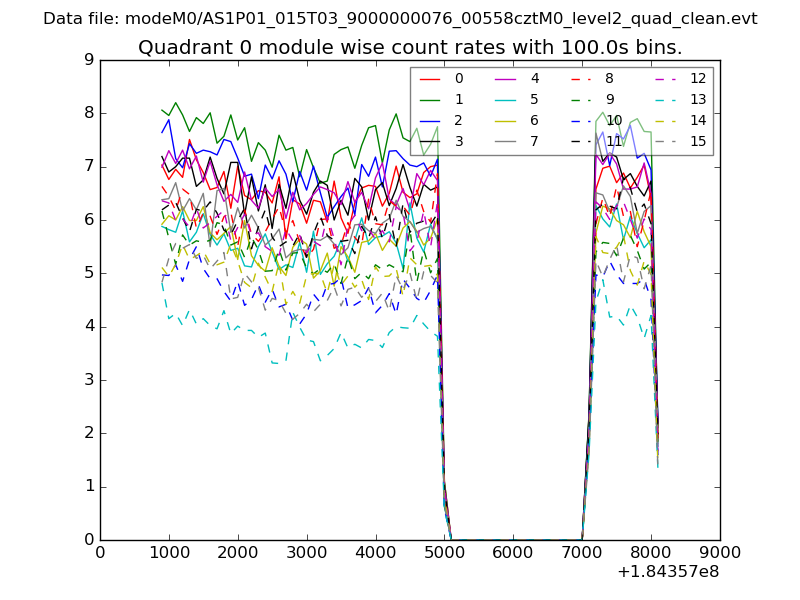 |
 |
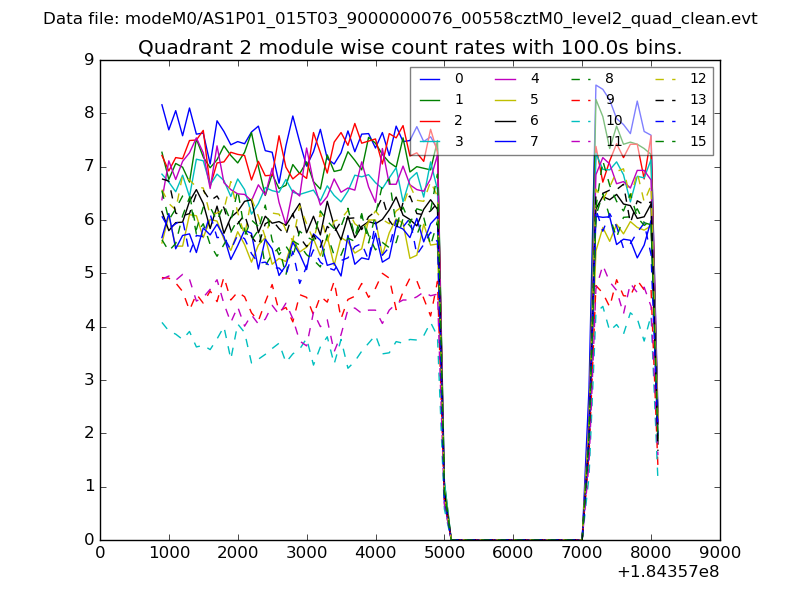
| Module-wise count rates for Quadrant B Data is divided into 100 sec bins |
 |
 |
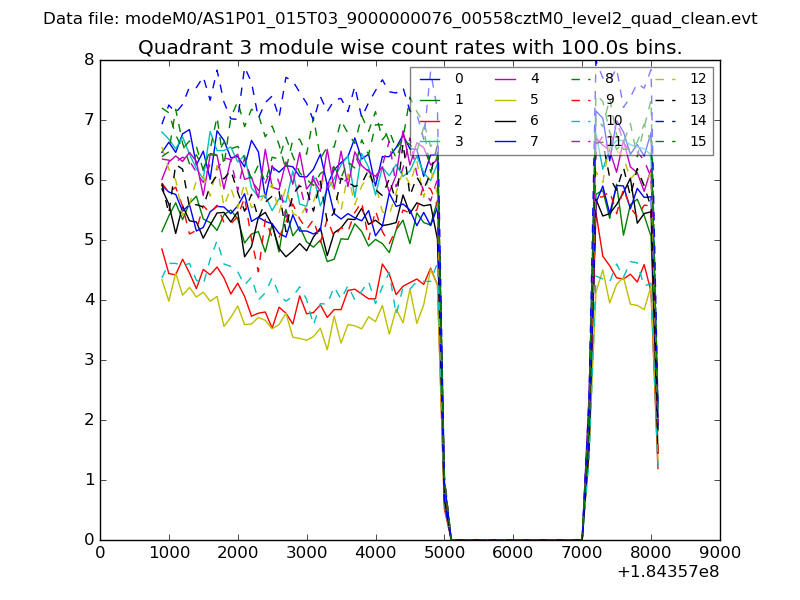
| Module-wise count rates for Quadrant C Data is divided into 100 sec bins |
 |
 |
| Module-wise count rates for Quadrant D Data is divided into 100 sec bins |
 |
 |
| Parameter | Plot |
|---|---|
| CZT HV Monitor | 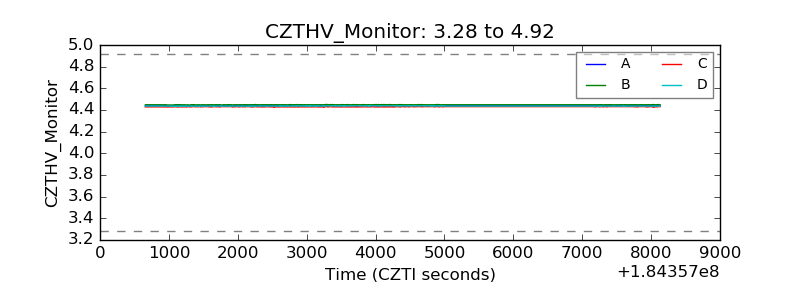 |
| D_VDD | 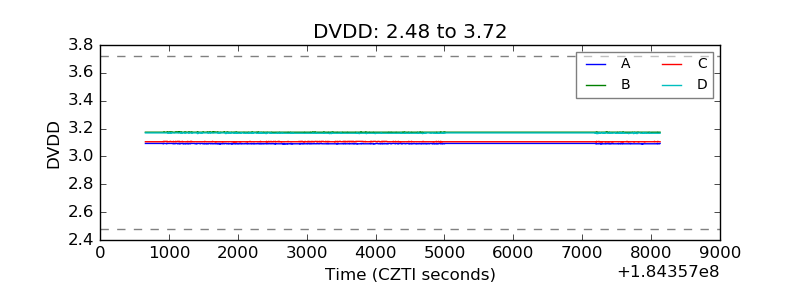 |
| Temperature 1 | 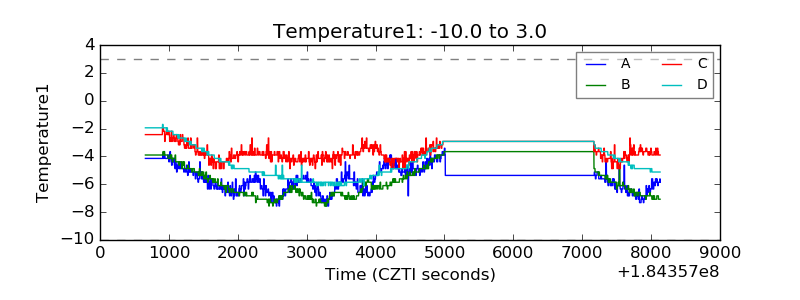 |
| Veto HV Monitor |  |
| Veto LLD | 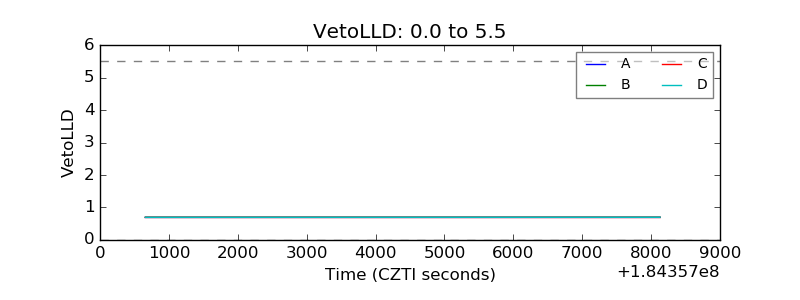 |
| Alpha Counter | 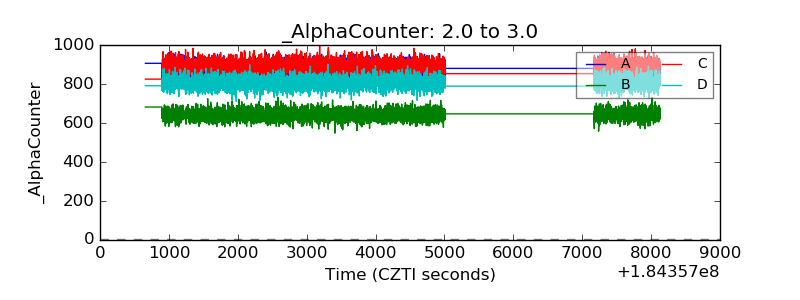 |
| _CPM_Rate | 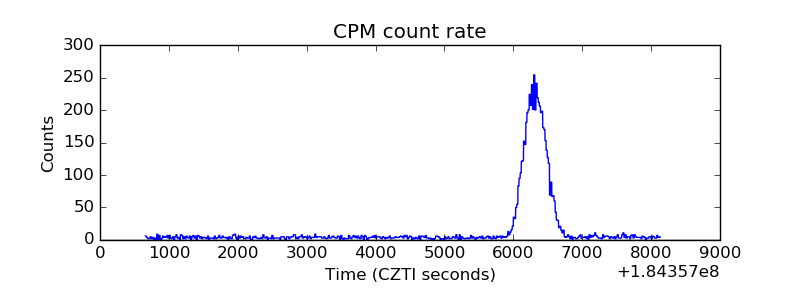 |
| CZT Counter | 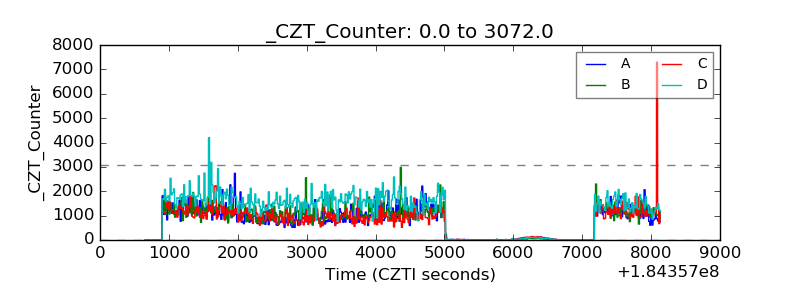 |
| +2.5 Volts monitor |  |
| +5 Volts monitor | 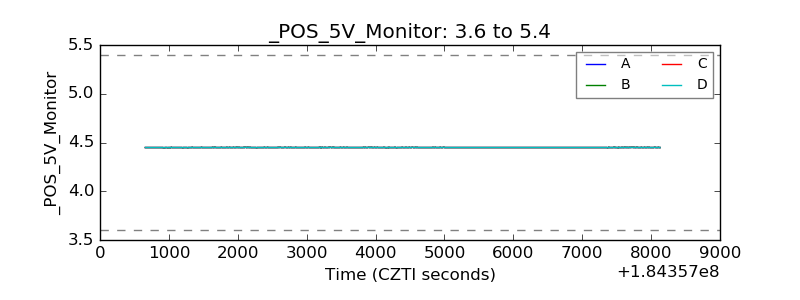 |
| _ROLL_ROT | 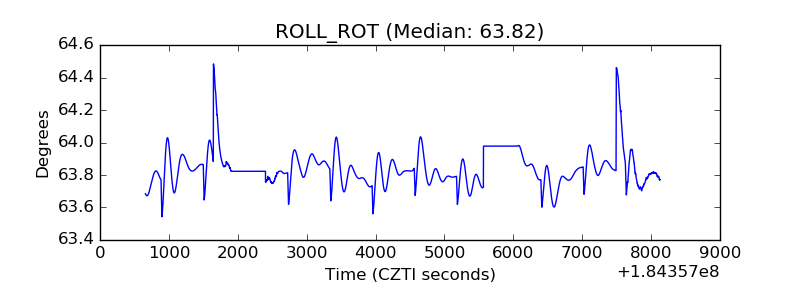 |
| _Roll_DEC | 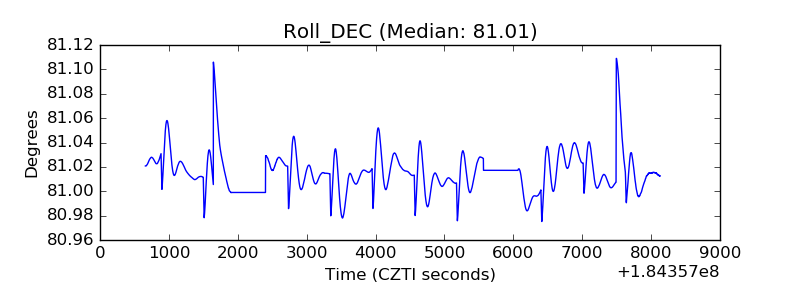 |
| _Roll_RA | 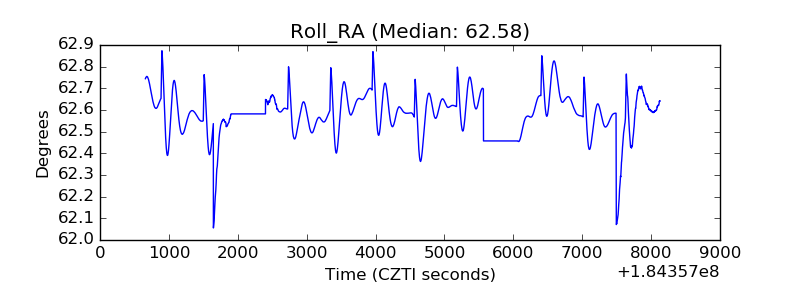 |
| Veto Counter | 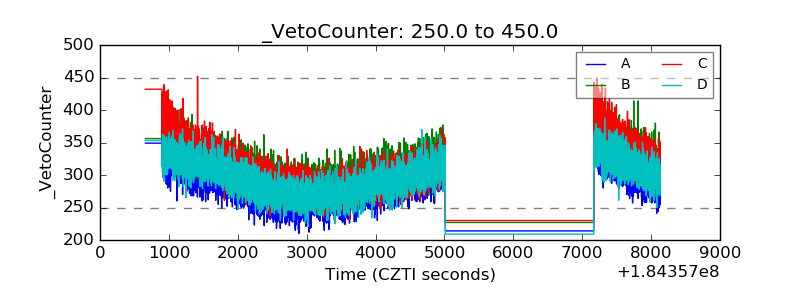 |