| Param | Original file | Final file |
|---|---|---|
| Filename | modeM0/AS1P01_015T03_9000000076_00559cztM0_level2.evt | modeM0/AS1P01_015T03_9000000076_00559cztM0_level2_quad_clean.evt |
| Size (bytes) | 790,876,800 | 75,216,960 |
| Size | 754.2 MB | 71.7 MB |
| Events in quadrant A | 6,244,479 | 474,360 |
| Events in quadrant B | 6,015,775 | 481,121 |
| Events in quadrant C | 5,626,126 | 489,641 |
| Events in quadrant D | 5,724,444 | 473,692 |
| Mode M0 | |||
|---|---|---|---|
| Quadrant | BADHDUFLAG | Total packets | Discarded packets |
| A | 0 | 22210 | 3 |
| B | 0 | 21504 | 2 |
| C | 0 | 20406 | 2 |
| D | 0 | 20682 | 2 |
| Mode M9 | |||
|---|---|---|---|
| Quadrant | BADHDUFLAG | Total packets | Discarded packets |
| A | 0 | 31 | 0 |
| B | 0 | 31 | 0 |
| C | 0 | 31 | 0 |
| D | 0 | 32 | 0 |
| Mode SS | |||
|---|---|---|---|
| Quadrant | BADHDUFLAG | Total packets | Discarded packets |
| A | 0 | 104 | 0 |
| B | 0 | 104 | 0 |
| C | 0 | 104 | 0 |
| D | 0 | 104 | 0 |
| Quadrant | Total seconds | Saturated seconds | Saturation percentage |
|---|---|---|---|
| A | 5122 | 51 | 0.995705% |
| B | 5122 | 8 | 0.156189% |
| C | 5122 | 10 | 0.195236% |
| D | 5122 | 16 | 0.312378% |
Noise dominated data is calculated using 1-second bins in cleaned event files. If a bin has >2000 counts, and if more than 50% of those come from <1% of pixels, then it is considered to be noise-dominated and hence unusable.
| Quadrant | # 1 sec bins | Bins with >0 counts | Bins with >2000 counts | High rate bins dominated by noise | Noise dominated (total time) | Noise dominated (detector-on time) | Marked lightcurve |
|---|---|---|---|---|---|---|---|
| A | 7278 | 5123 | 256 | 256 | 3.52% | 5.00% | 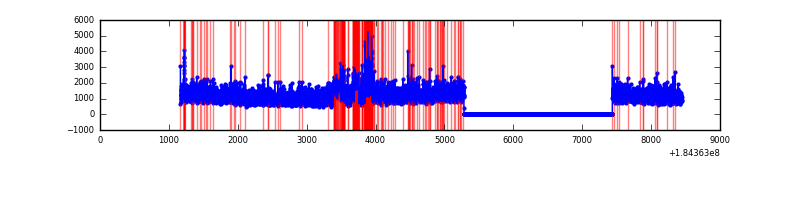 |
| B | 7278 | 5123 | 79 | 79 | 1.09% | 1.54% | 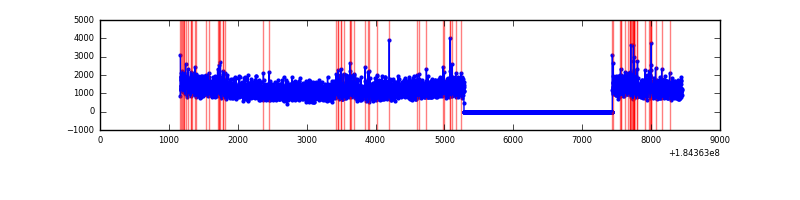 |
| C | 7278 | 5123 | 89 | 89 | 1.22% | 1.74% | 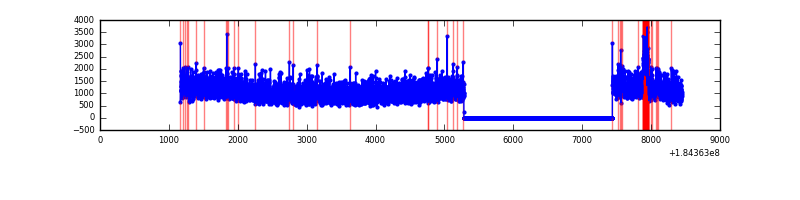 |
| D | 7278 | 5123 | 106 | 106 | 1.46% | 2.07% |  |
Top three noisy pixels from each quadrant. If the there are fewer than three noisy pixels in the level2.evt file, extra rows are filled as -1
| Pixel properties | Quadrant properties | ||||||
|---|---|---|---|---|---|---|---|
| Quadrant | DetID | PixID | Counts | Sigma | Mean | Median | Sigma |
| A | 0 | 69 | 369536 | 1103.32 | 1488 | 1470 | 333.6 |
| A | 15 | 171 | 47940 | 139.3 | 1488 | 1470 | 333.6 |
| A | 0 | 238 | 37817 | 108.95 | 1488 | 1470 | 333.6 |
| B | 4 | 250 | 87491 | 244.2 | 1511 | 1517 | 352.1 |
| B | 0 | 220 | 37159 | 101.24 | 1511 | 1517 | 352.1 |
| B | 8 | 4 | 33538 | 90.95 | 1511 | 1517 | 352.1 |
| C | 10 | 17 | 114131 | 294.42 | 1373 | 1422 | 382.8 |
| C | 1 | 1 | 65661 | 167.81 | 1373 | 1422 | 382.8 |
| C | 9 | 206 | 24794 | 61.05 | 1373 | 1422 | 382.8 |
| D | 1 | 239 | 243026 | 602.89 | 1285 | 1333 | 400.9 |
| D | 1 | 4 | 190185 | 471.08 | 1285 | 1333 | 400.9 |
| D | 13 | 221 | 116813 | 288.06 | 1285 | 1333 | 400.9 |
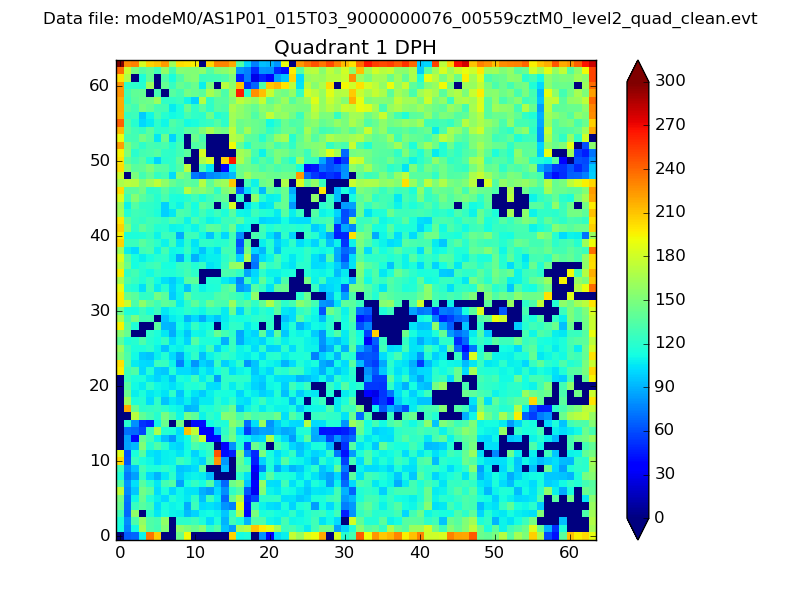
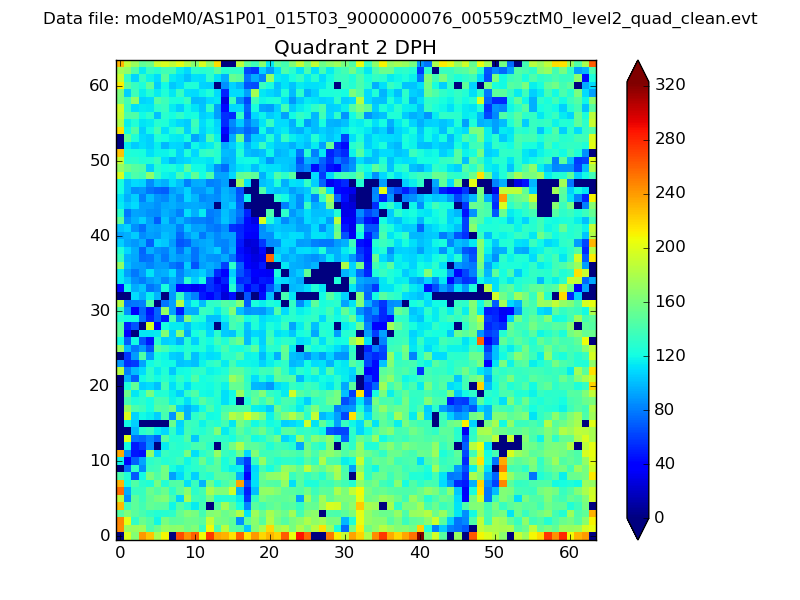
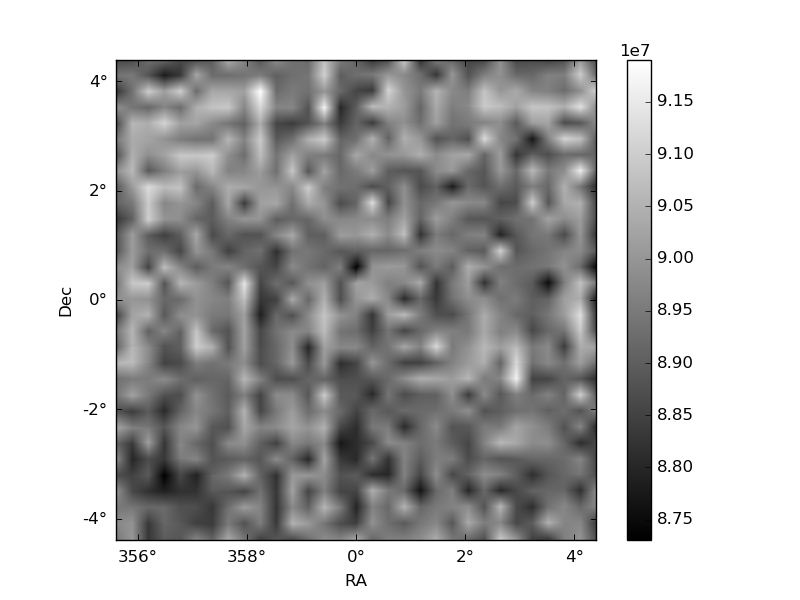
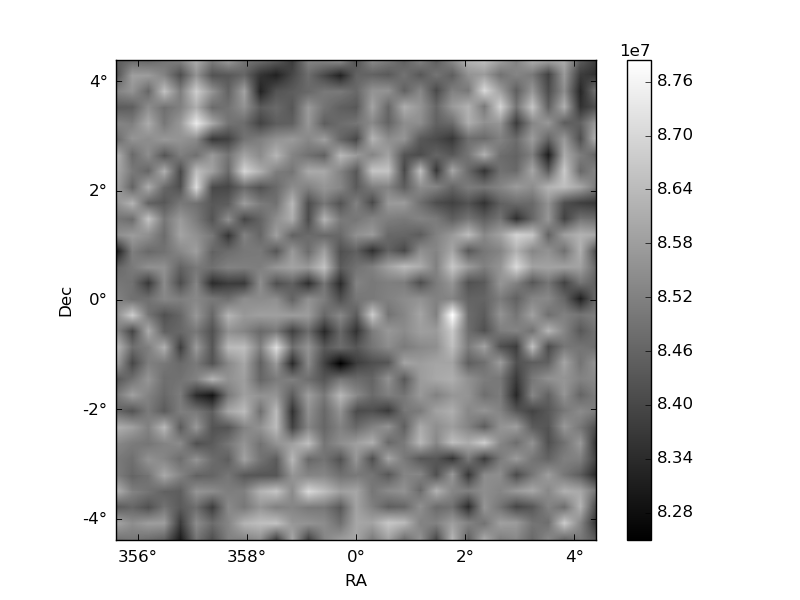
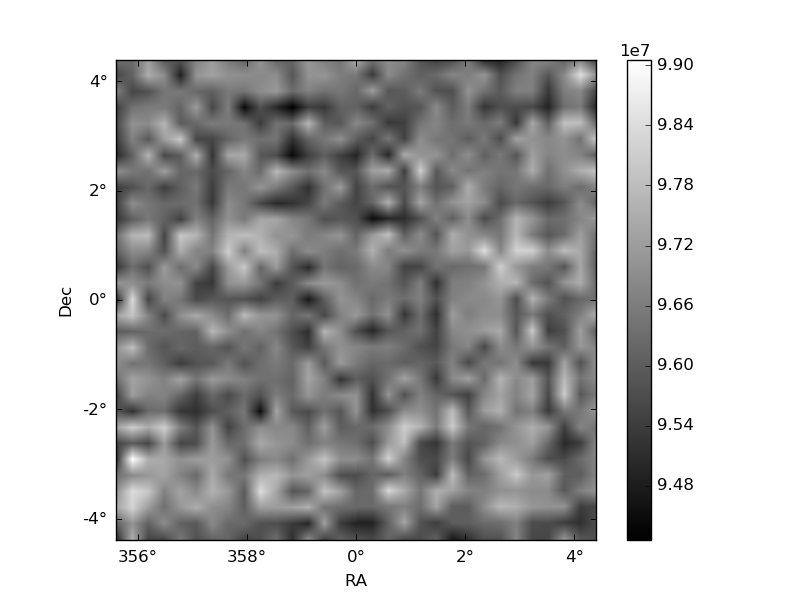
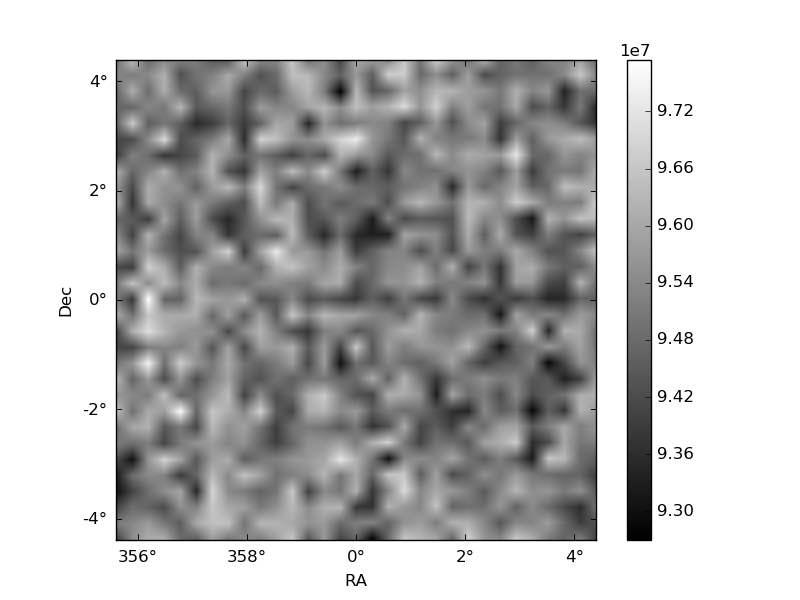
Histogram calculated using DETX and DETY for each event in the final _common_clean file
| Quadrant A | 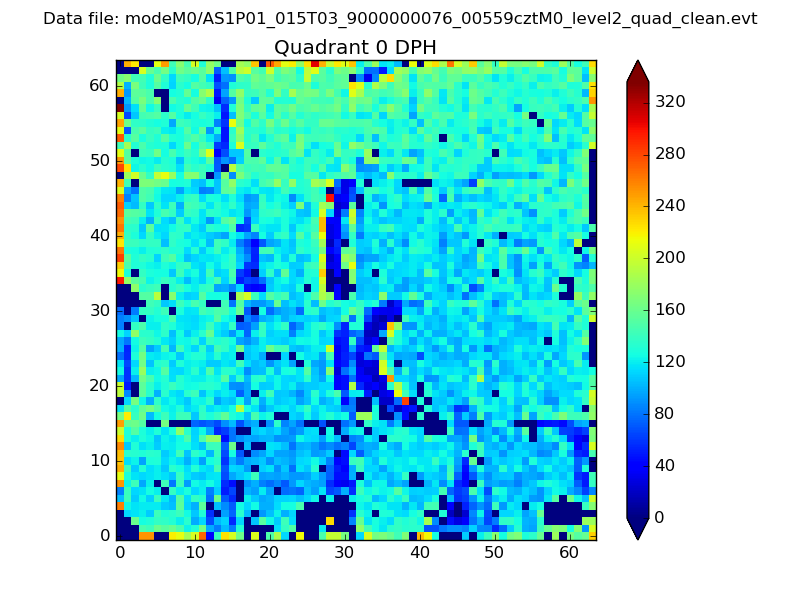 |
 |
Quadrant B |
|---|---|---|---|
| Quadrant D | 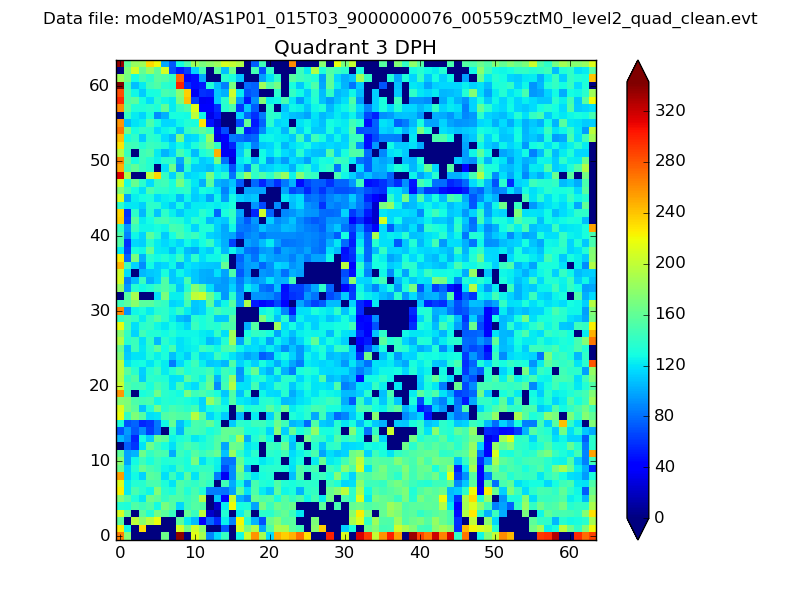 |
 |
Quadrant C |
| Plot type | Count rate plots | Images |
|---|---|---|
| Comparison with Poisson distribution Blue bars denote a histogram of data divided into 1 sec bins. Red curve is a Poisson curve with rate = median count rate of data. |
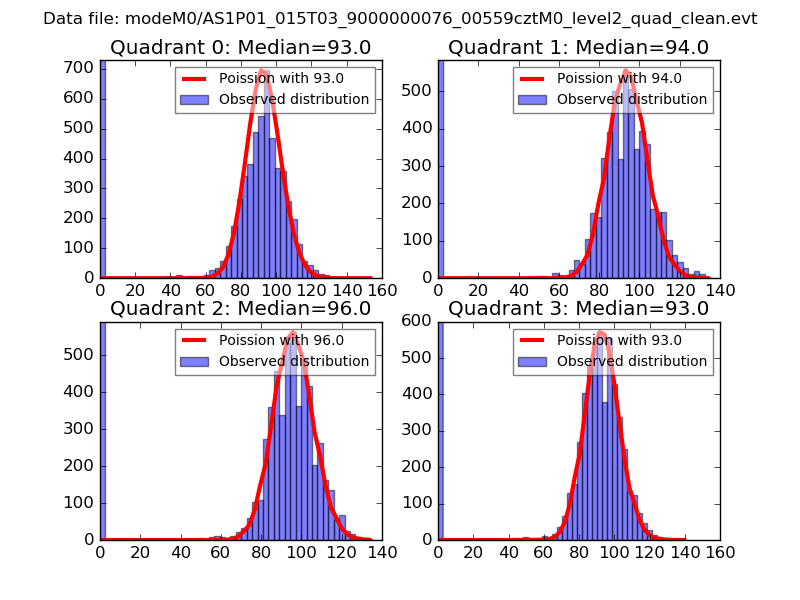 |
 |
| Quadrant-wise count rates Data is divided into 100 sec bins |
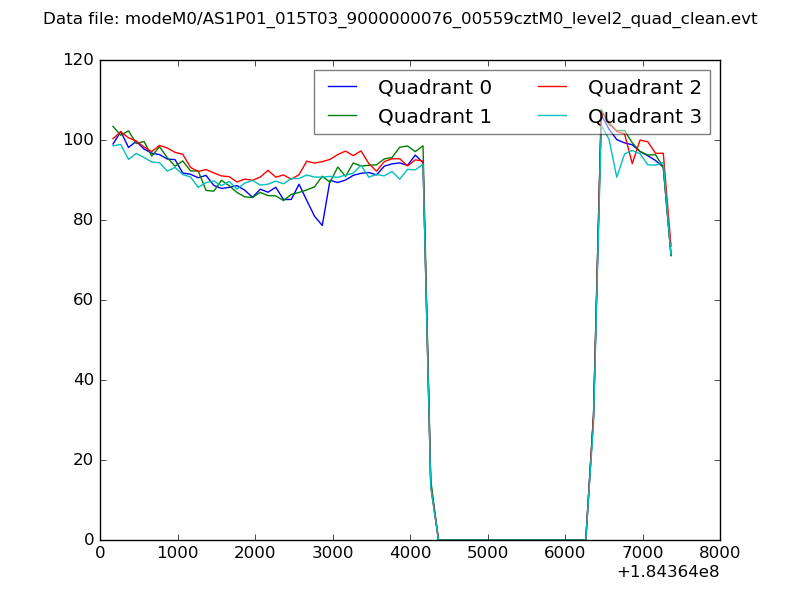 |
|
| Module-wise count rates for Quadrant A Data is divided into 100 sec bins |
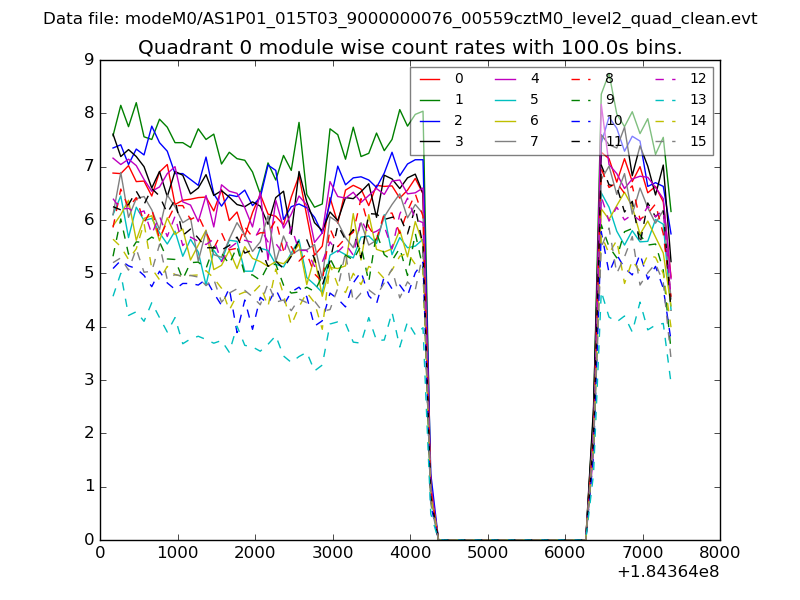 |
 |
| Module-wise count rates for Quadrant B Data is divided into 100 sec bins |
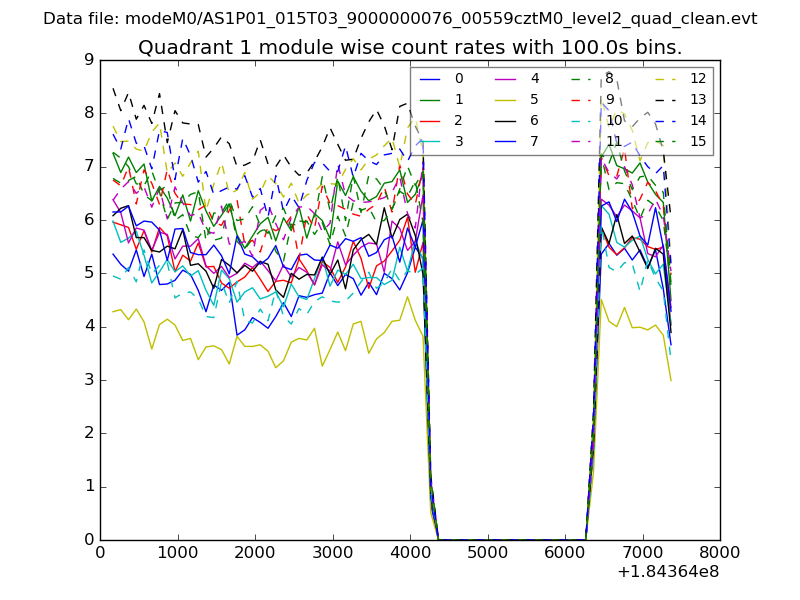 |
 |
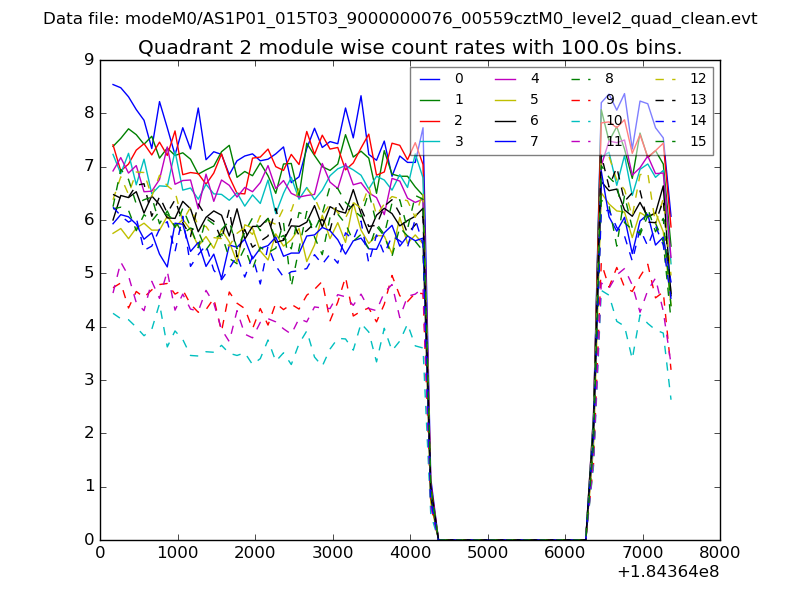
| Module-wise count rates for Quadrant C Data is divided into 100 sec bins |
 |
 |
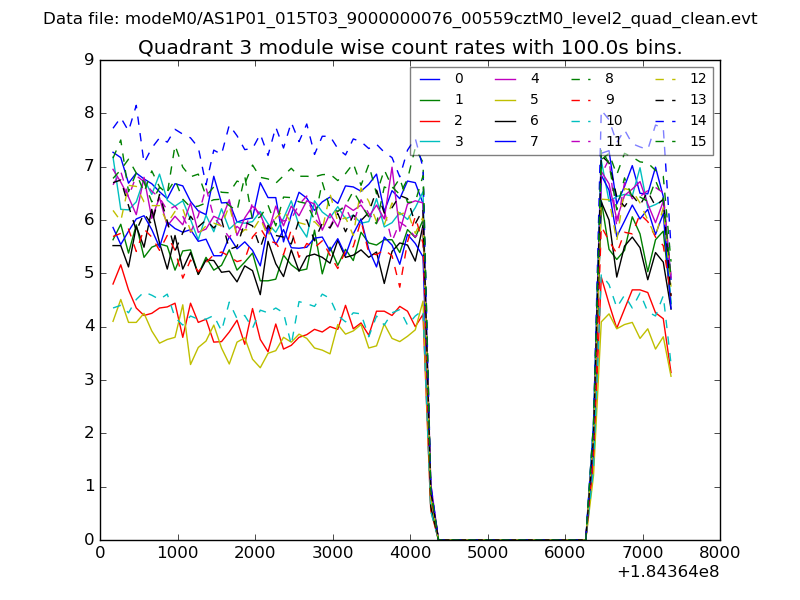
| Module-wise count rates for Quadrant D Data is divided into 100 sec bins |
 |
 |
| Parameter | Plot |
|---|---|
| CZT HV Monitor | 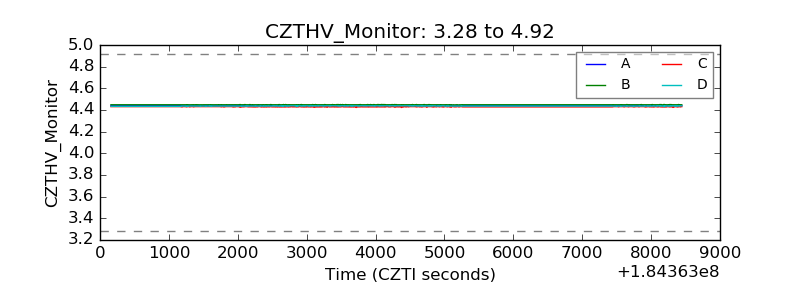 |
| D_VDD |  |
| Temperature 1 | 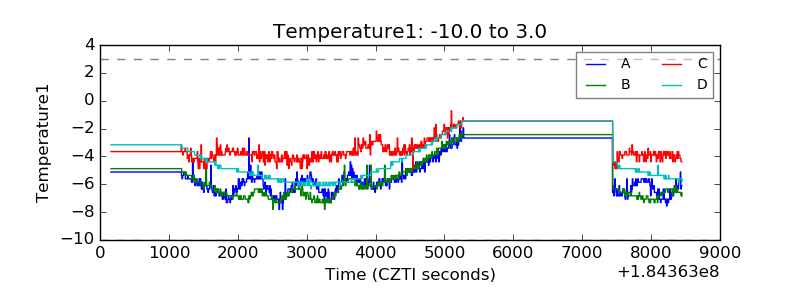 |
| Veto HV Monitor | 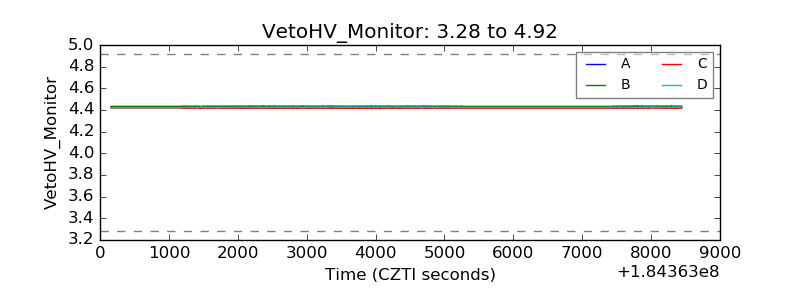 |
| Veto LLD | 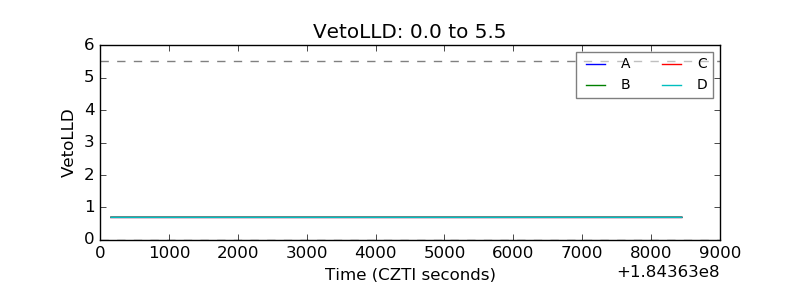 |
| Alpha Counter | 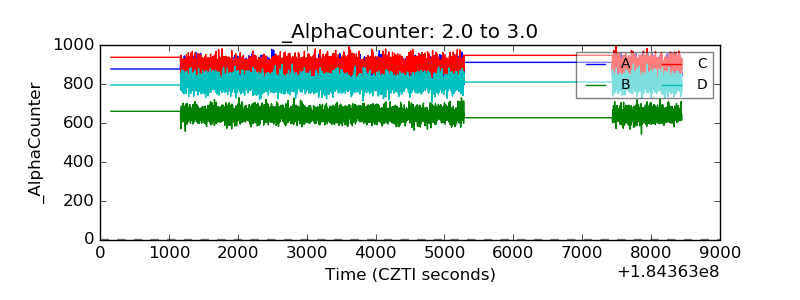 |
| _CPM_Rate | 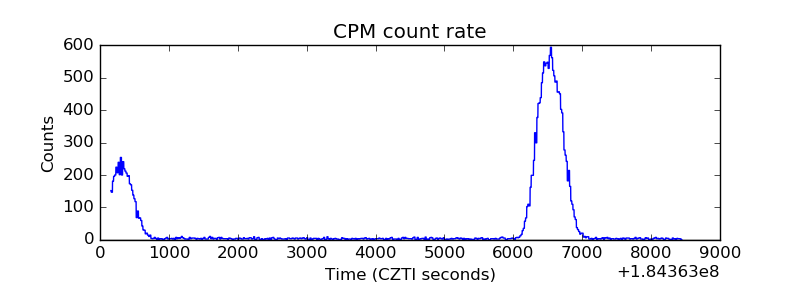 |
| CZT Counter | 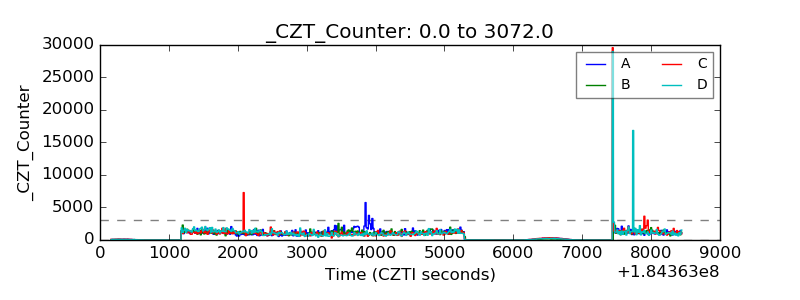 |
| +2.5 Volts monitor |  |
| +5 Volts monitor |  |
| _ROLL_ROT | 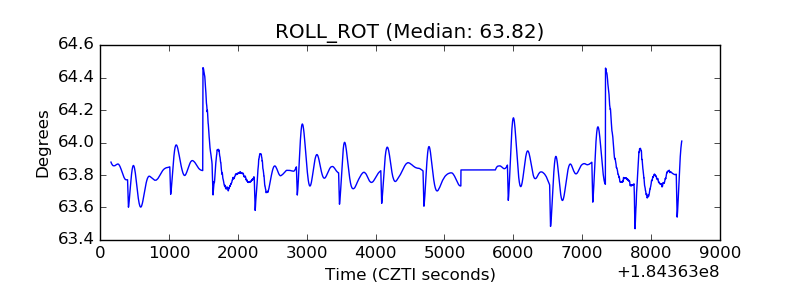 |
| _Roll_DEC | 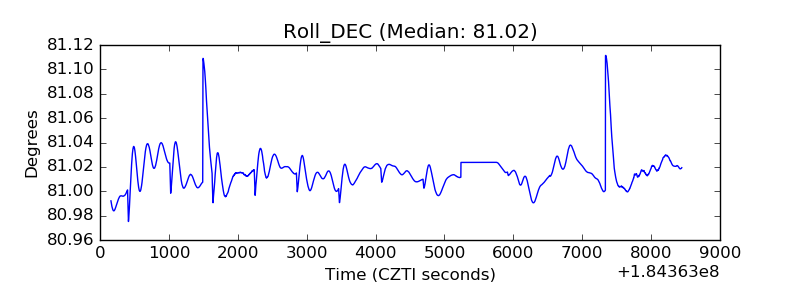 |
| _Roll_RA |  |
| Veto Counter | 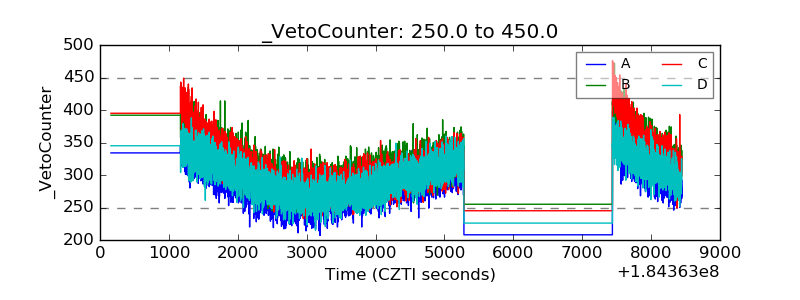 |