| Param | Original file | Final file |
|---|---|---|
| Filename | modeM0/AS1P01_015T03_9000000076_00560cztM0_level2.evt | modeM0/AS1P01_015T03_9000000076_00560cztM0_level2_quad_clean.evt |
| Size (bytes) | 750,850,560 | 74,145,600 |
| Size | 716.1 MB | 70.7 MB |
| Events in quadrant A | 5,865,550 | 467,997 |
| Events in quadrant B | 5,891,128 | 477,726 |
| Events in quadrant C | 5,342,391 | 483,925 |
| Events in quadrant D | 5,307,710 | 465,554 |
| Mode M0 | |||
|---|---|---|---|
| Quadrant | BADHDUFLAG | Total packets | Discarded packets |
| A | 0 | 20980 | 3 |
| B | 0 | 21055 | 2 |
| C | 0 | 19433 | 2 |
| D | 0 | 19371 | 2 |
| Mode M9 | |||
|---|---|---|---|
| Quadrant | BADHDUFLAG | Total packets | Discarded packets |
| A | 0 | 38 | 0 |
| B | 0 | 38 | 0 |
| C | 0 | 38 | 0 |
| D | 0 | 39 | 0 |
| Mode SS | |||
|---|---|---|---|
| Quadrant | BADHDUFLAG | Total packets | Discarded packets |
| A | 0 | 102 | 0 |
| B | 0 | 102 | 0 |
| C | 0 | 102 | 0 |
| D | 0 | 102 | 0 |
| Quadrant | Total seconds | Saturated seconds | Saturation percentage |
|---|---|---|---|
| A | 4992 | 32 | 0.641026% |
| B | 4992 | 7 | 0.140224% |
| C | 4992 | 9 | 0.180288% |
| D | 4992 | 19 | 0.380609% |
Noise dominated data is calculated using 1-second bins in cleaned event files. If a bin has >2000 counts, and if more than 50% of those come from <1% of pixels, then it is considered to be noise-dominated and hence unusable.
| Quadrant | # 1 sec bins | Bins with >0 counts | Bins with >2000 counts | High rate bins dominated by noise | Noise dominated (total time) | Noise dominated (detector-on time) | Marked lightcurve |
|---|---|---|---|---|---|---|---|
| A | 7146 | 4993 | 172 | 172 | 2.41% | 3.44% |  |
| B | 7146 | 4993 | 76 | 76 | 1.06% | 1.52% |  |
| C | 7146 | 4993 | 84 | 84 | 1.18% | 1.68% | 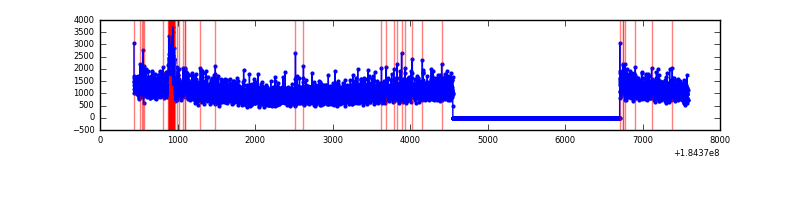 |
| D | 7146 | 4993 | 75 | 75 | 1.05% | 1.50% |  |
Top three noisy pixels from each quadrant. If the there are fewer than three noisy pixels in the level2.evt file, extra rows are filled as -1
| Pixel properties | Quadrant properties | ||||||
|---|---|---|---|---|---|---|---|
| Quadrant | DetID | PixID | Counts | Sigma | Mean | Median | Sigma |
| A | 12 | 133 | 160386 | 483.29 | 1459 | 1439 | 328.9 |
| A | 0 | 238 | 28326 | 81.75 | 1459 | 1439 | 328.9 |
| A | 15 | 249 | 17308 | 48.25 | 1459 | 1439 | 328.9 |
| B | 4 | 250 | 107232 | 306.97 | 1472 | 1482 | 344.5 |
| B | 5 | 249 | 33506 | 92.96 | 1472 | 1482 | 344.5 |
| B | 15 | 185 | 30166 | 83.26 | 1472 | 1482 | 344.5 |
| C | 10 | 17 | 114277 | 310.26 | 1313 | 1358 | 364.0 |
| C | 1 | 1 | 26328 | 68.61 | 1313 | 1358 | 364.0 |
| C | 9 | 206 | 16772 | 42.35 | 1313 | 1358 | 364.0 |
| D | 1 | 4 | 196383 | 488.59 | 1246 | 1292 | 399.3 |
| D | 13 | 221 | 103920 | 257.02 | 1246 | 1292 | 399.3 |
| D | 12 | 22 | 42378 | 102.9 | 1246 | 1292 | 399.3 |
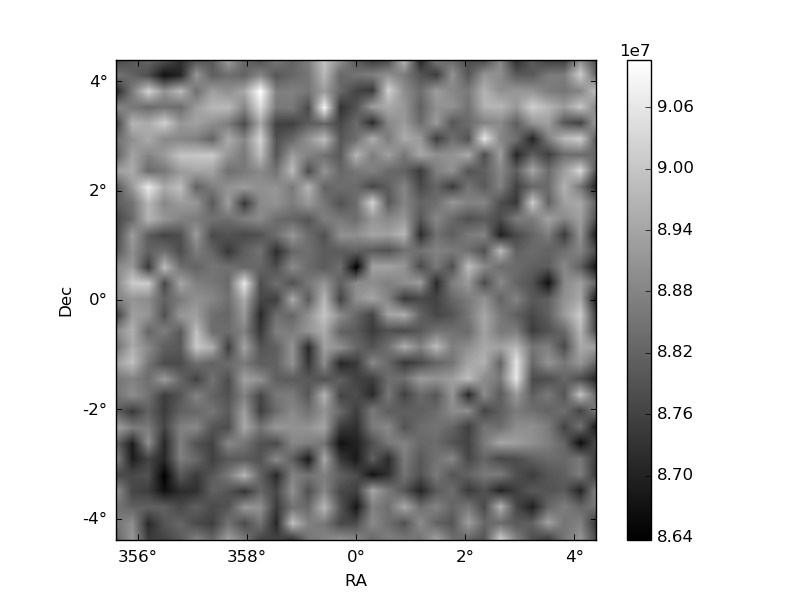
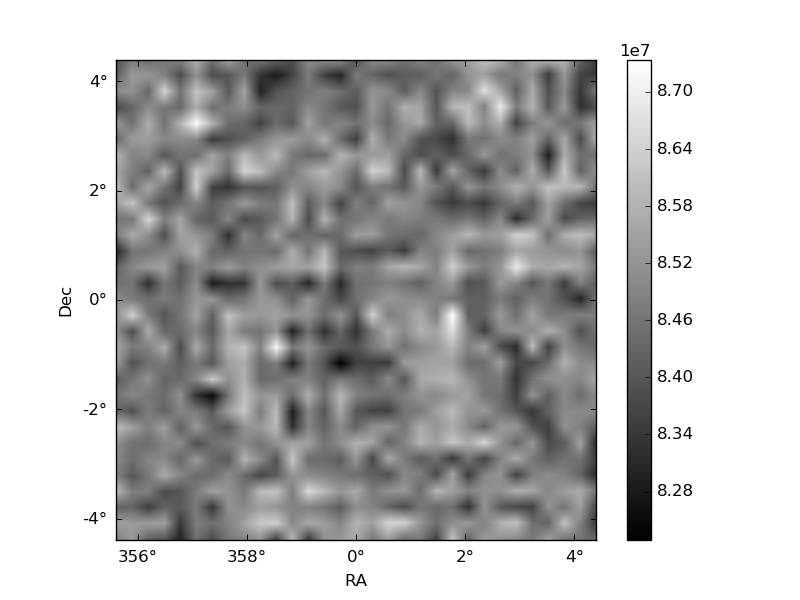
Histogram calculated using DETX and DETY for each event in the final _common_clean file
| Quadrant A | 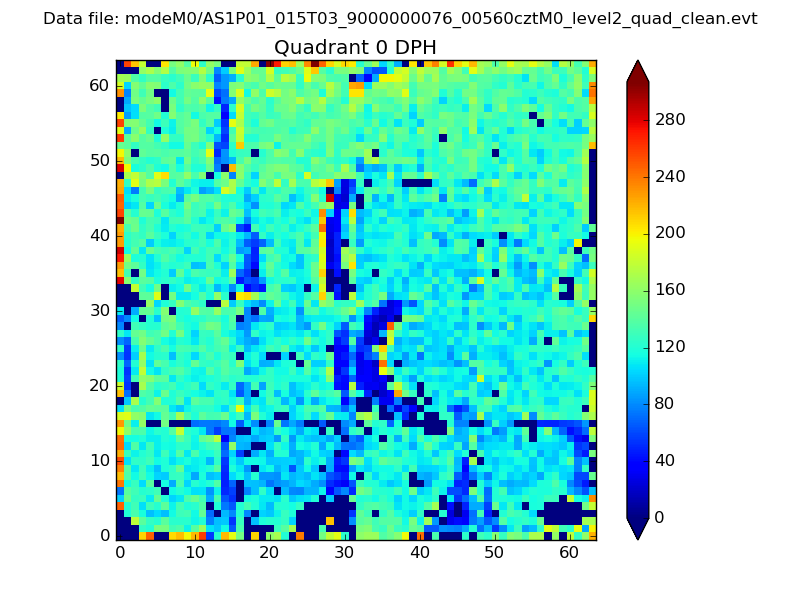 |
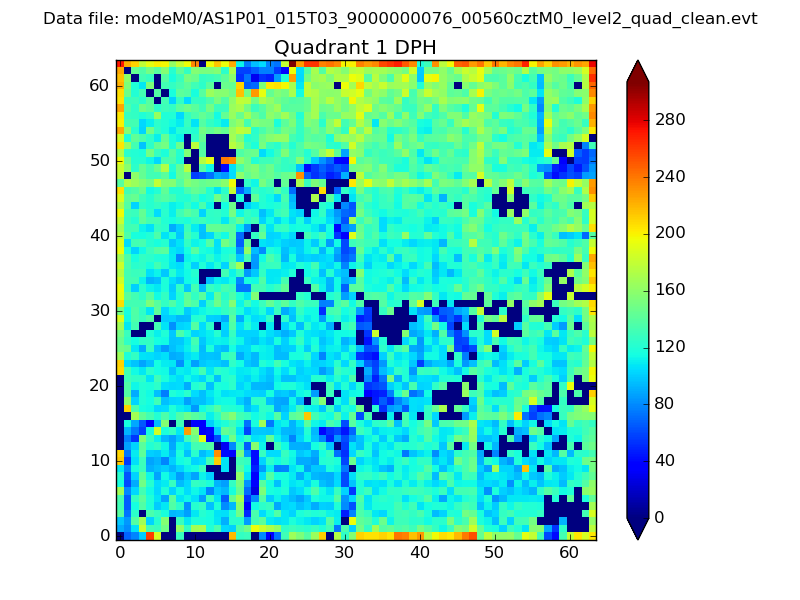 |
Quadrant B |
|---|---|---|---|
| Quadrant D | 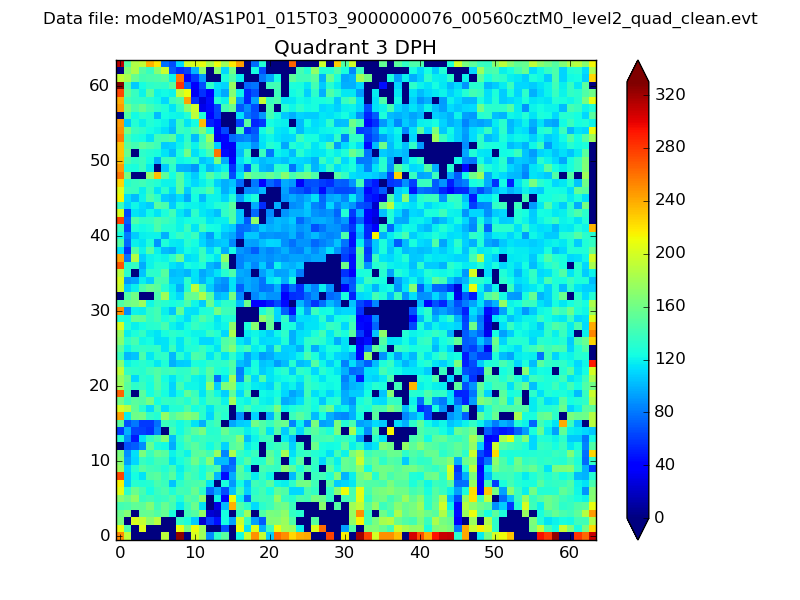 |
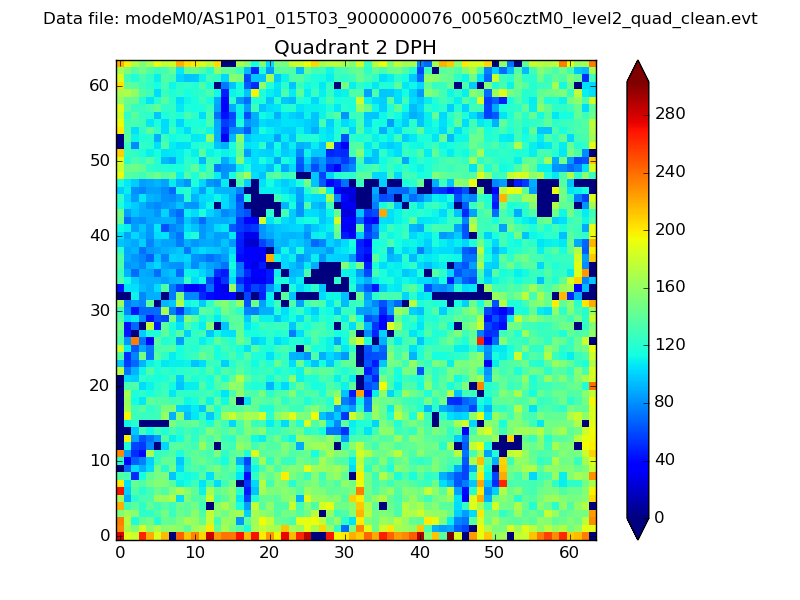 |
Quadrant C |
| Plot type | Count rate plots | Images |
|---|---|---|
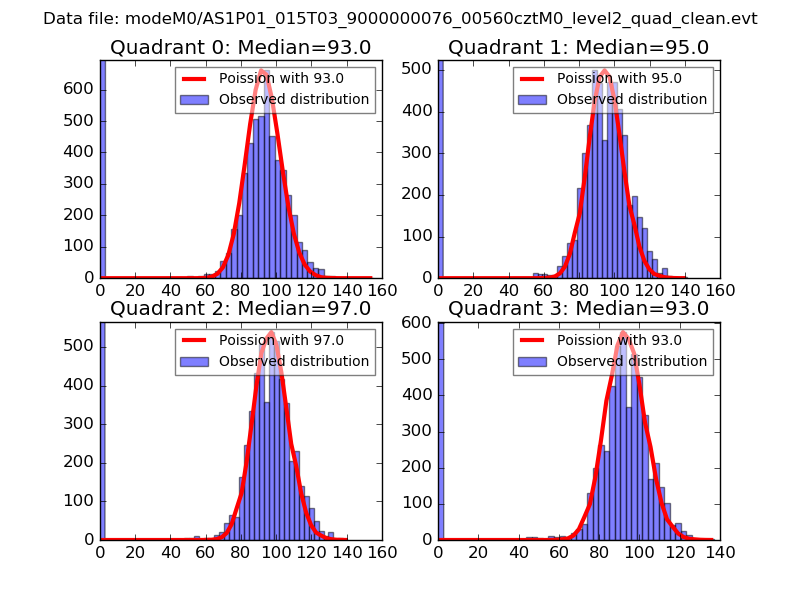
| Comparison with Poisson distribution Blue bars denote a histogram of data divided into 1 sec bins. Red curve is a Poisson curve with rate = median count rate of data. |
 |
 |
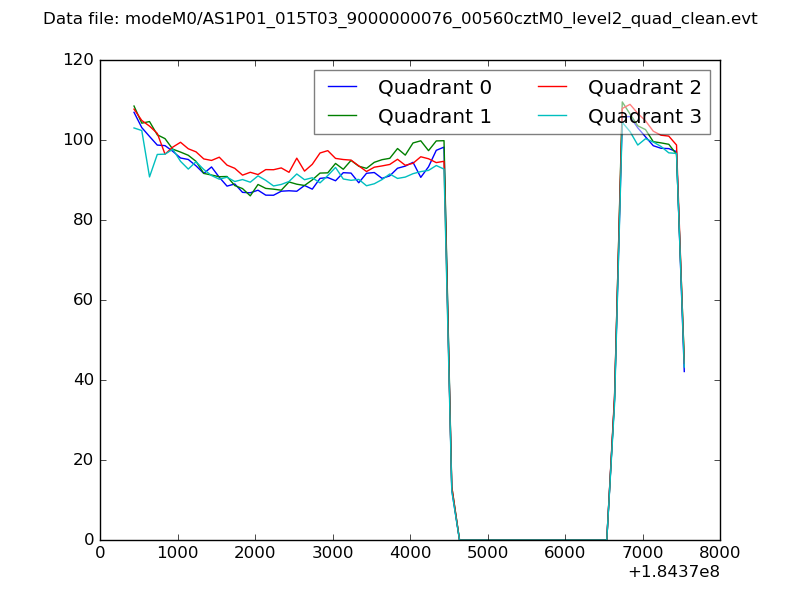
| Quadrant-wise count rates Data is divided into 100 sec bins |
 |
|
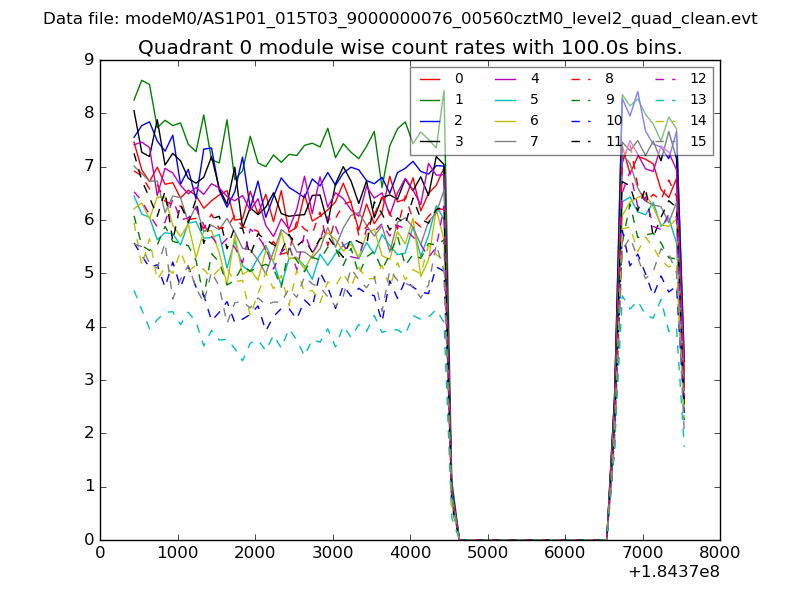
| Module-wise count rates for Quadrant A Data is divided into 100 sec bins |
 |
 |
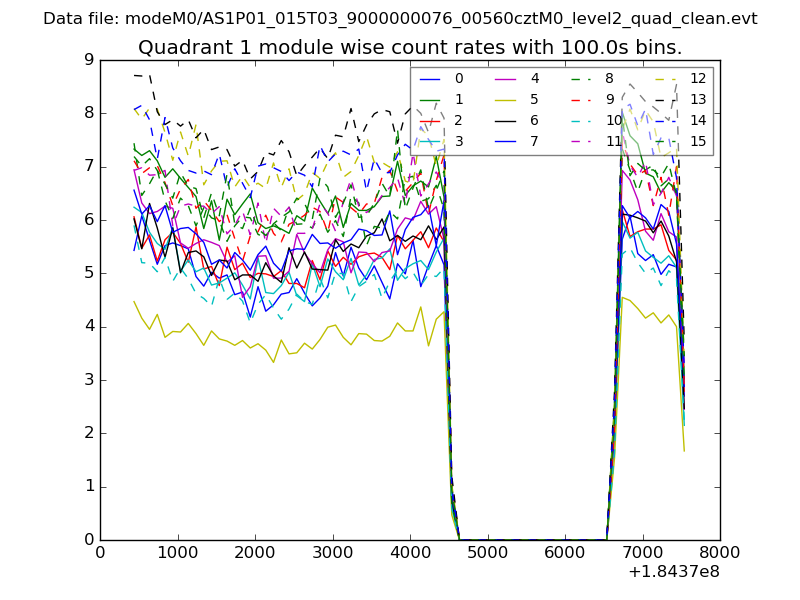
| Module-wise count rates for Quadrant B Data is divided into 100 sec bins |
 |
 |
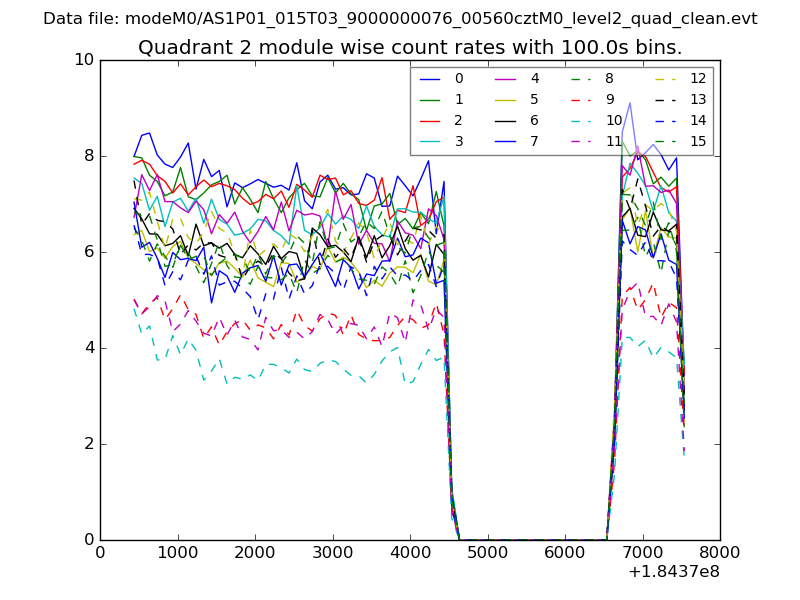
| Module-wise count rates for Quadrant C Data is divided into 100 sec bins |
 |
 |
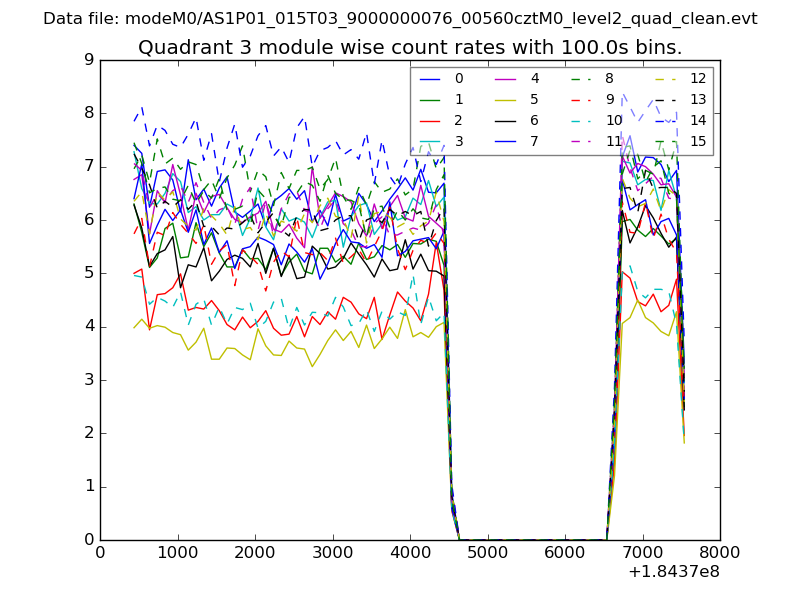
| Module-wise count rates for Quadrant D Data is divided into 100 sec bins |
 |
 |
| Parameter | Plot |
|---|---|
| CZT HV Monitor | 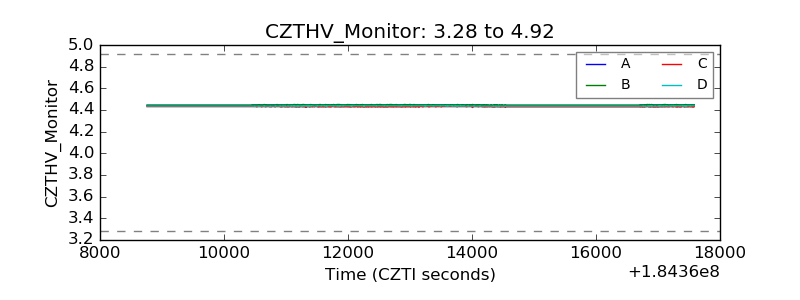 |
| D_VDD | 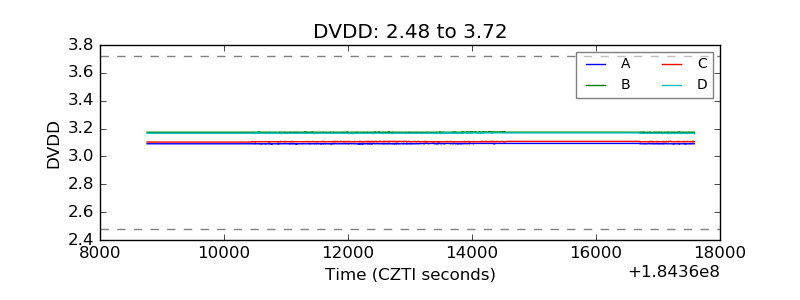 |
| Temperature 1 | 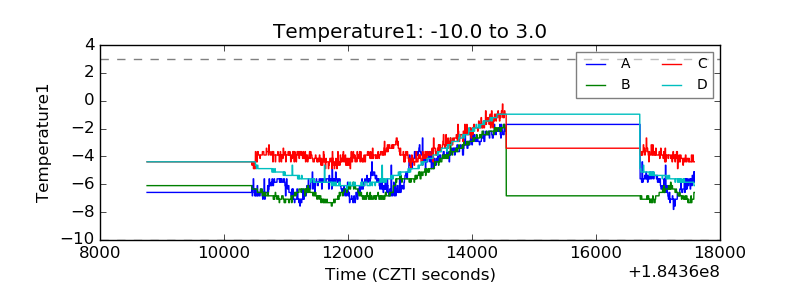 |
| Veto HV Monitor | 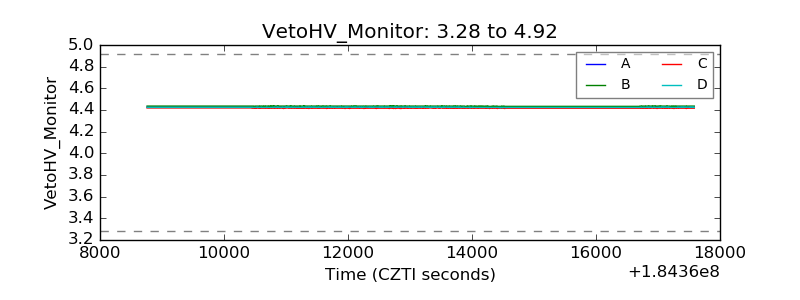 |
| Veto LLD | 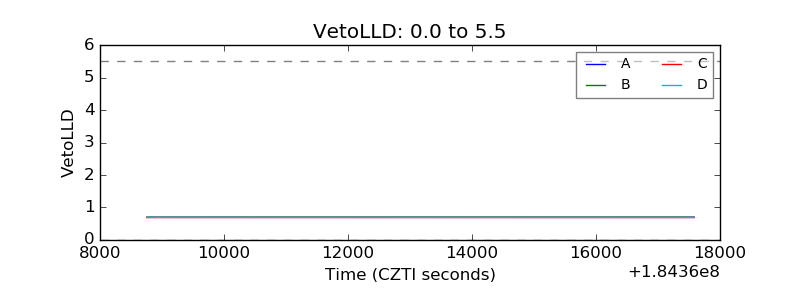 |
| Alpha Counter | 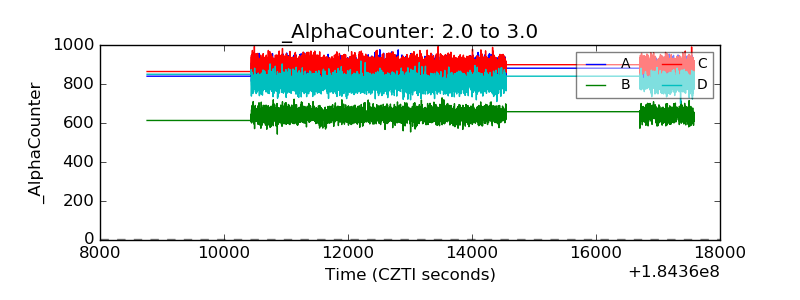 |
| _CPM_Rate | 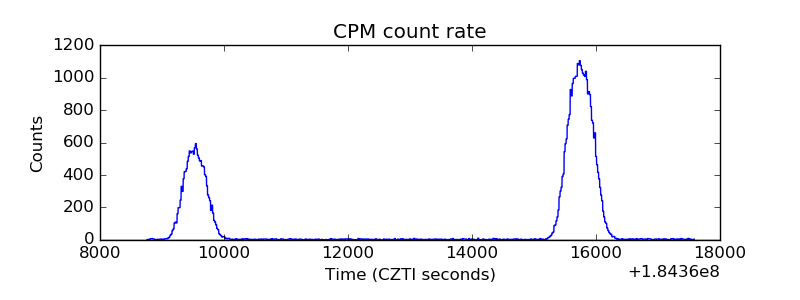 |
| CZT Counter | 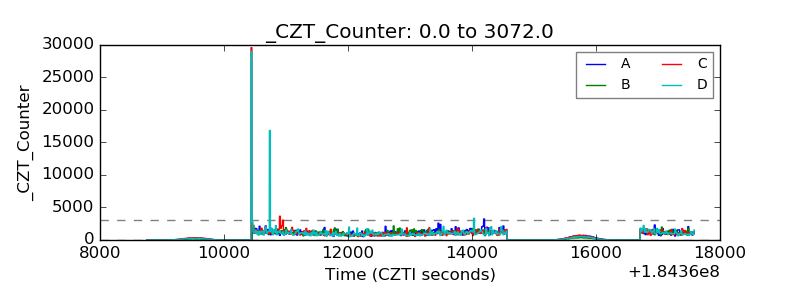 |
| +2.5 Volts monitor |  |
| +5 Volts monitor |  |
| _ROLL_ROT | 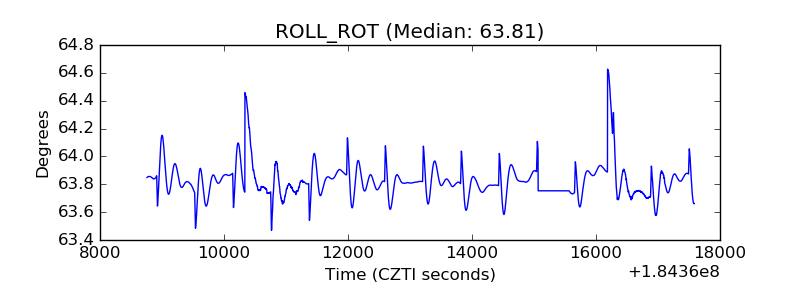 |
| _Roll_DEC | 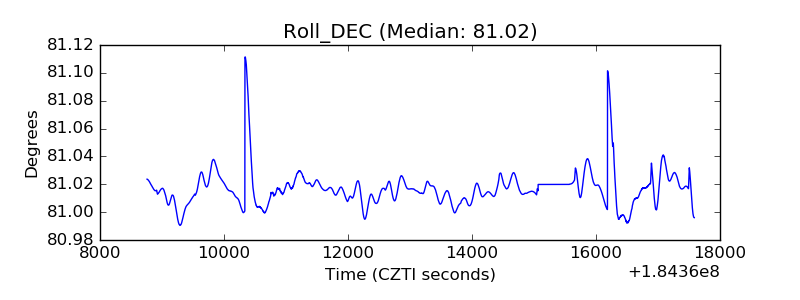 |
| _Roll_RA | 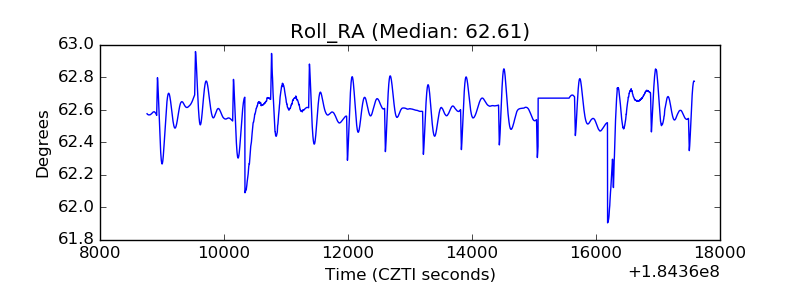 |
| Veto Counter | 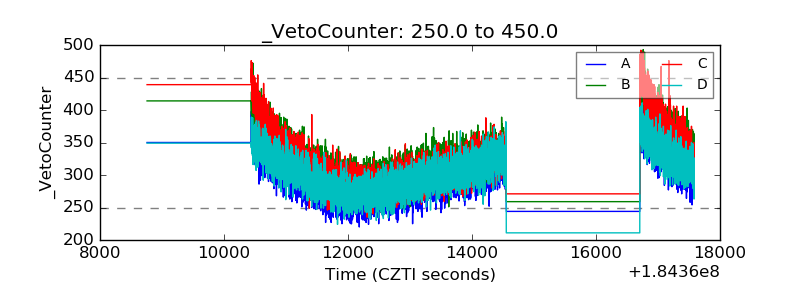 |