| Param | Original file | Final file |
|---|---|---|
| Filename | modeM0/AS1P01_015T03_9000000076_00562cztM0_level2.evt | modeM0/AS1P01_015T03_9000000076_00562cztM0_level2_quad_clean.evt |
| Size (bytes) | 804,015,360 | 79,519,680 |
| Size | 766.8 MB | 75.8 MB |
| Events in quadrant A | 6,880,137 | 503,037 |
| Events in quadrant B | 6,242,618 | 517,880 |
| Events in quadrant C | 5,455,590 | 521,067 |
| Events in quadrant D | 5,421,817 | 498,187 |
| Mode M0 | |||
|---|---|---|---|
| Quadrant | BADHDUFLAG | Total packets | Discarded packets |
| A | 0 | 24171 | 3 |
| B | 0 | 22277 | 2 |
| C | 0 | 19965 | 2 |
| D | 0 | 19857 | 2 |
| Mode M9 | |||
|---|---|---|---|
| Quadrant | BADHDUFLAG | Total packets | Discarded packets |
| A | 0 | 32 | 0 |
| B | 0 | 32 | 0 |
| C | 0 | 32 | 0 |
| D | 0 | 33 | 0 |
| Mode SS | |||
|---|---|---|---|
| Quadrant | BADHDUFLAG | Total packets | Discarded packets |
| A | 0 | 106 | 0 |
| B | 0 | 106 | 0 |
| C | 0 | 106 | 0 |
| D | 0 | 106 | 0 |
| Quadrant | Total seconds | Saturated seconds | Saturation percentage |
|---|---|---|---|
| A | 5256 | 120 | 2.283105% |
| B | 5256 | 4 | 0.076104% |
| C | 5256 | 2 | 0.038052% |
| D | 5256 | 5 | 0.095129% |
Noise dominated data is calculated using 1-second bins in cleaned event files. If a bin has >2000 counts, and if more than 50% of those come from <1% of pixels, then it is considered to be noise-dominated and hence unusable.
| Quadrant | # 1 sec bins | Bins with >0 counts | Bins with >2000 counts | High rate bins dominated by noise | Noise dominated (total time) | Noise dominated (detector-on time) | Marked lightcurve |
|---|---|---|---|---|---|---|---|
| A | 7411 | 5257 | 469 | 469 | 6.33% | 8.92% |  |
| B | 7411 | 5257 | 101 | 101 | 1.36% | 1.92% | 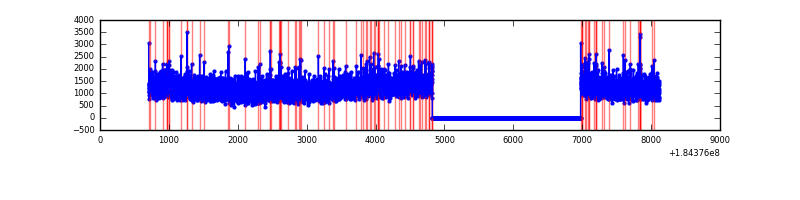 |
| C | 7411 | 5257 | 28 | 28 | 0.38% | 0.53% | 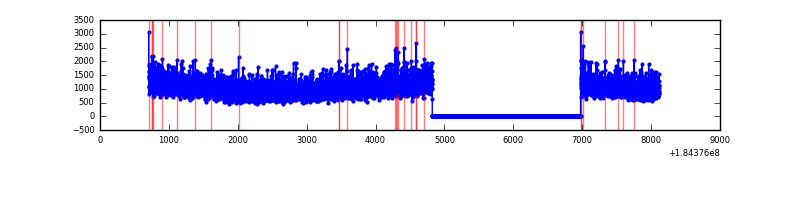 |
| D | 7411 | 5257 | 47 | 47 | 0.63% | 0.89% | 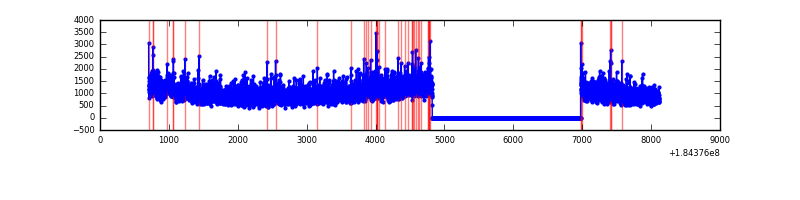 |
Top three noisy pixels from each quadrant. If the there are fewer than three noisy pixels in the level2.evt file, extra rows are filled as -1
| Pixel properties | Quadrant properties | ||||||
|---|---|---|---|---|---|---|---|
| Quadrant | DetID | PixID | Counts | Sigma | Mean | Median | Sigma |
| A | 12 | 133 | 783479 | 2282.69 | 1530 | 1514 | 342.6 |
| A | 0 | 149 | 108287 | 311.69 | 1530 | 1514 | 342.6 |
| A | 0 | 238 | 45264 | 127.71 | 1530 | 1514 | 342.6 |
| B | 4 | 250 | 121516 | 329.13 | 1555 | 1566 | 364.4 |
| B | 8 | 4 | 27112 | 70.1 | 1555 | 1566 | 364.4 |
| B | 4 | 206 | 27104 | 70.07 | 1555 | 1566 | 364.4 |
| C | 1 | 1 | 20179 | 49.46 | 1372 | 1419 | 379.3 |
| C | 15 | 241 | 13875 | 32.84 | 1372 | 1419 | 379.3 |
| C | 5 | 249 | 13372 | 31.52 | 1372 | 1419 | 379.3 |
| D | 1 | 4 | 132723 | 321.74 | 1304 | 1352 | 408.3 |
| D | 13 | 221 | 82259 | 198.15 | 1304 | 1352 | 408.3 |
| D | 2 | 45 | 36529 | 86.15 | 1304 | 1352 | 408.3 |
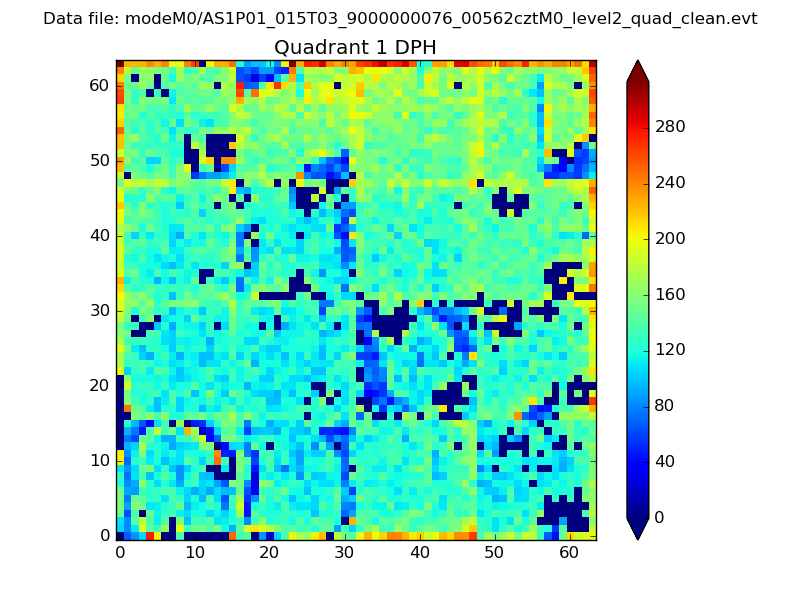
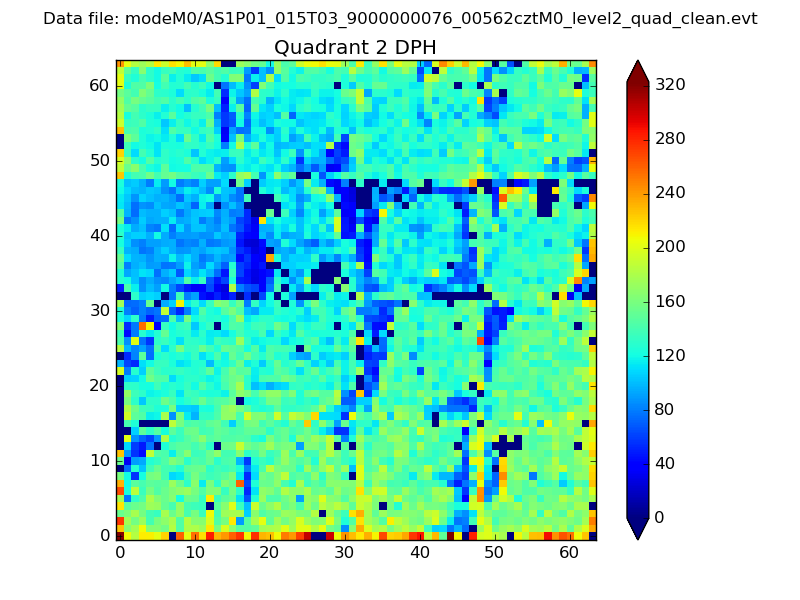
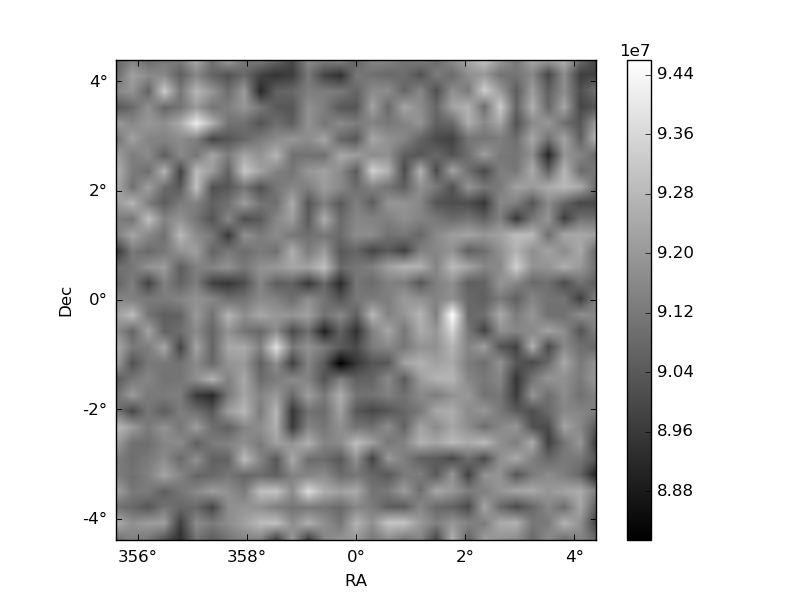
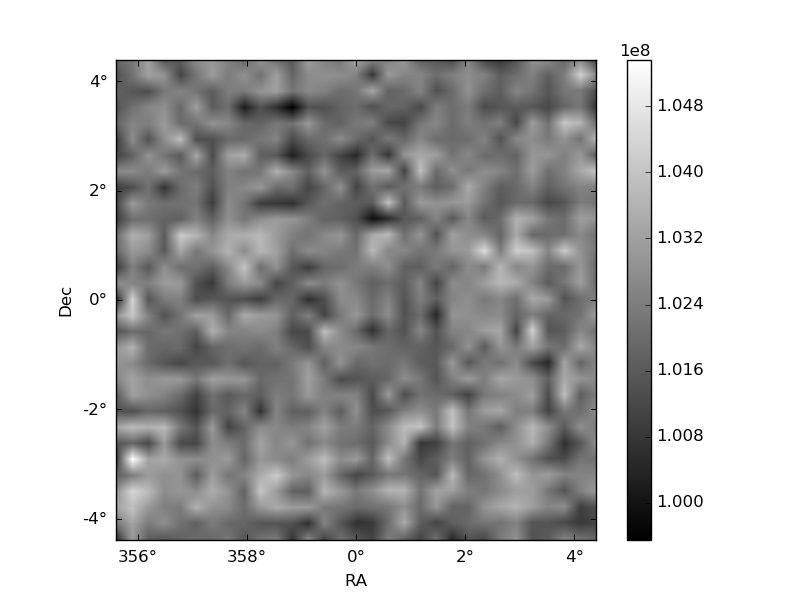
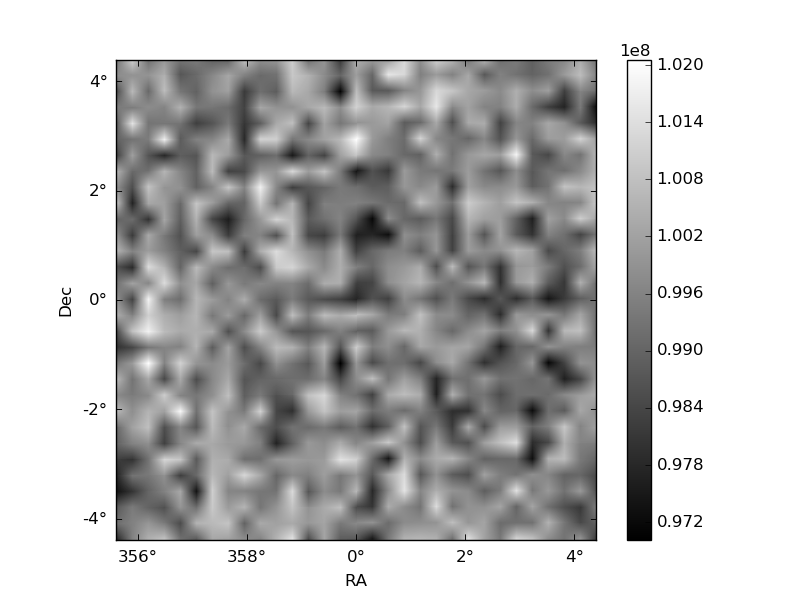
Histogram calculated using DETX and DETY for each event in the final _common_clean file
| Quadrant A | 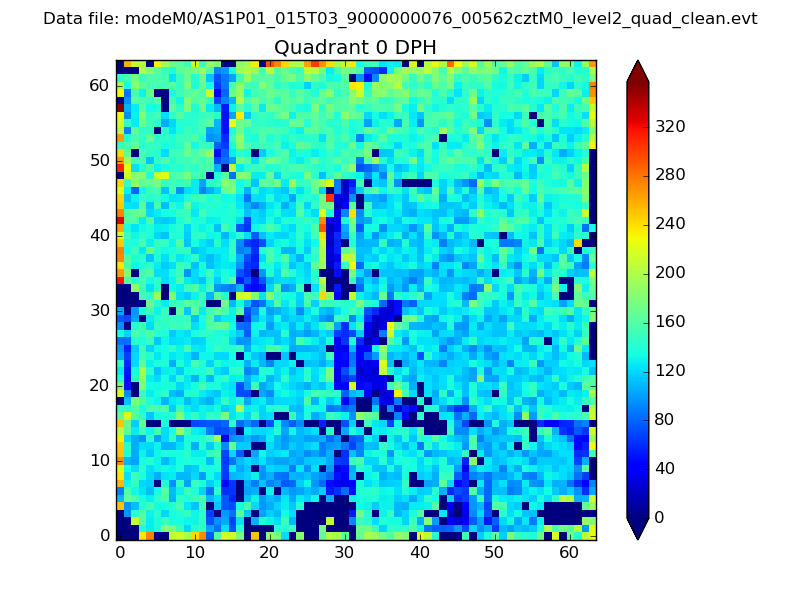 |
 |
Quadrant B |
|---|---|---|---|
| Quadrant D | 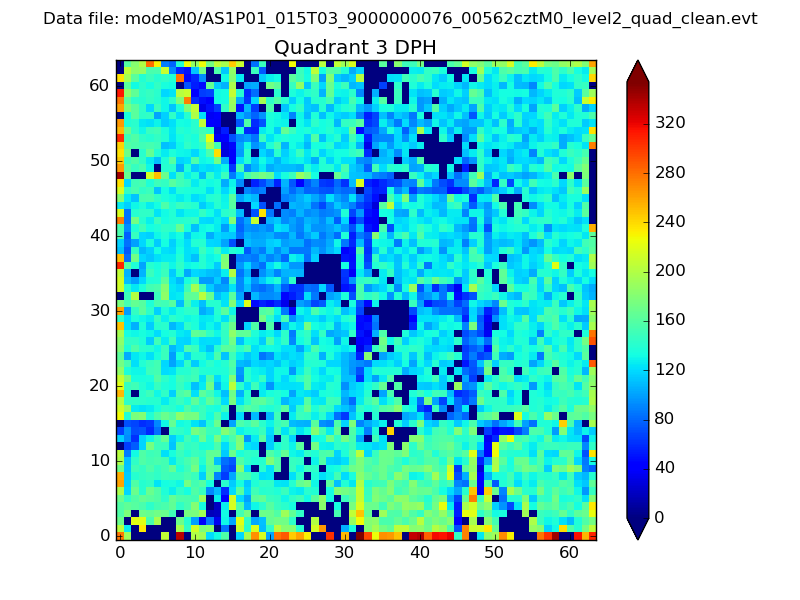 |
 |
Quadrant C |
| Plot type | Count rate plots | Images |
|---|---|---|
| Comparison with Poisson distribution Blue bars denote a histogram of data divided into 1 sec bins. Red curve is a Poisson curve with rate = median count rate of data. |
 |
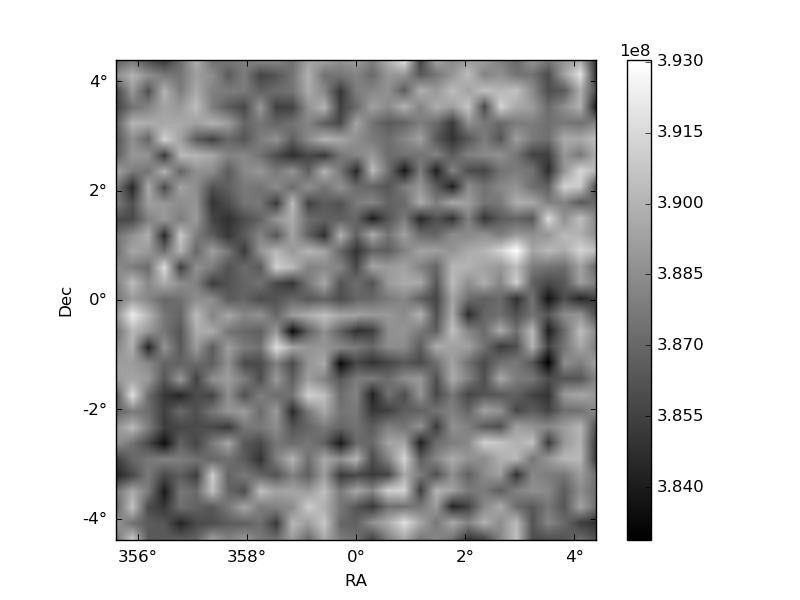 |
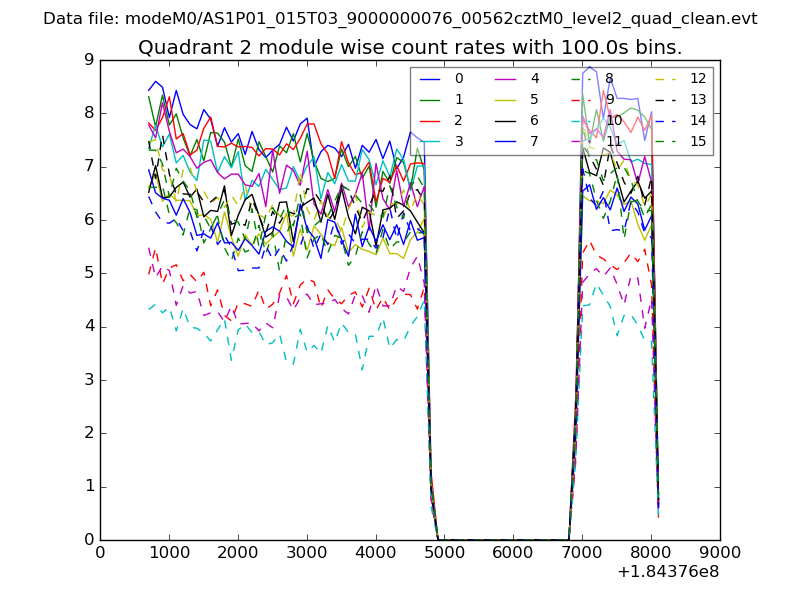
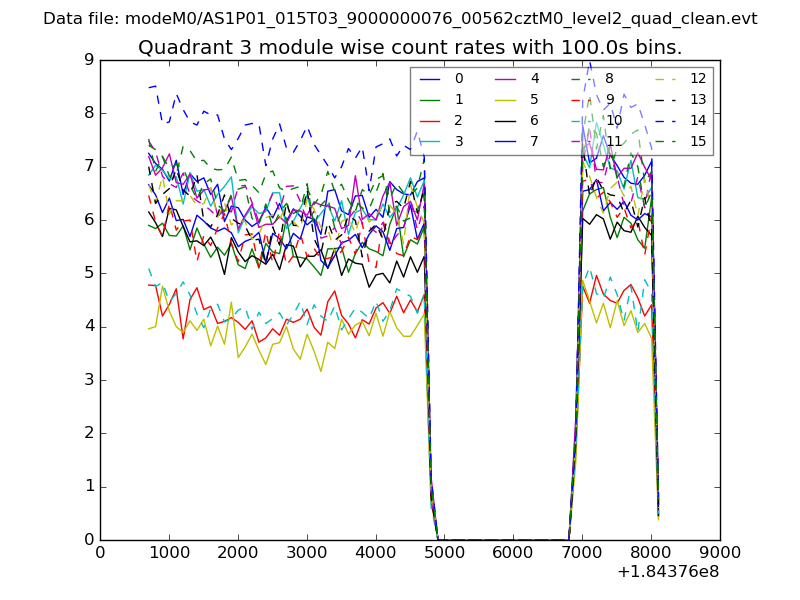
| Quadrant-wise count rates Data is divided into 100 sec bins |
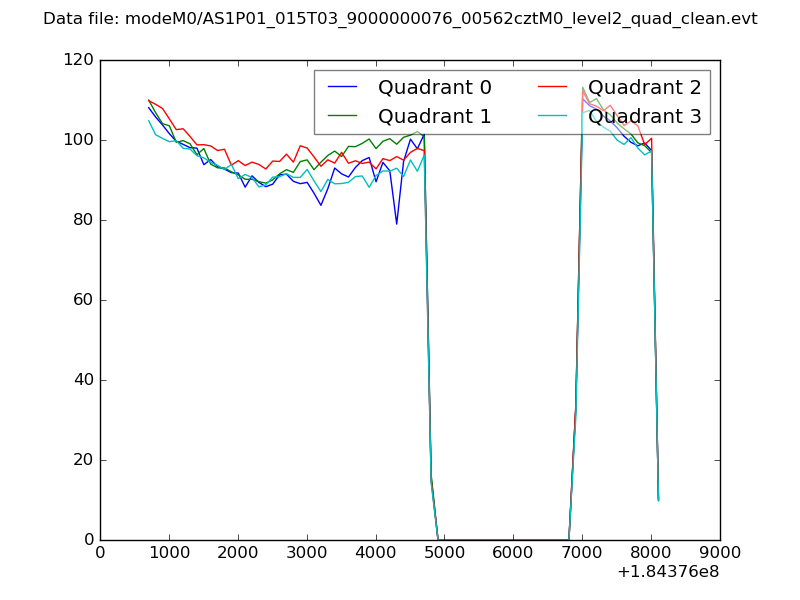 |
|
| Module-wise count rates for Quadrant A Data is divided into 100 sec bins |
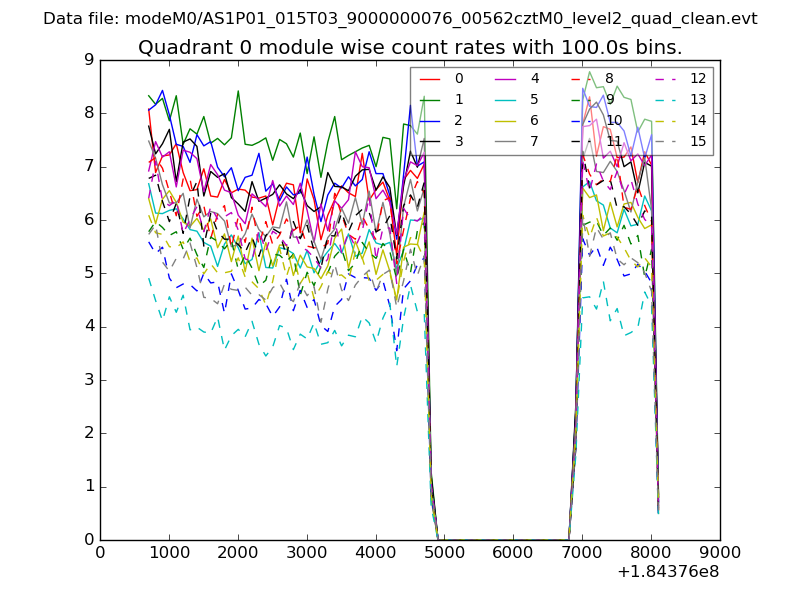 |
 |
| Module-wise count rates for Quadrant B Data is divided into 100 sec bins |
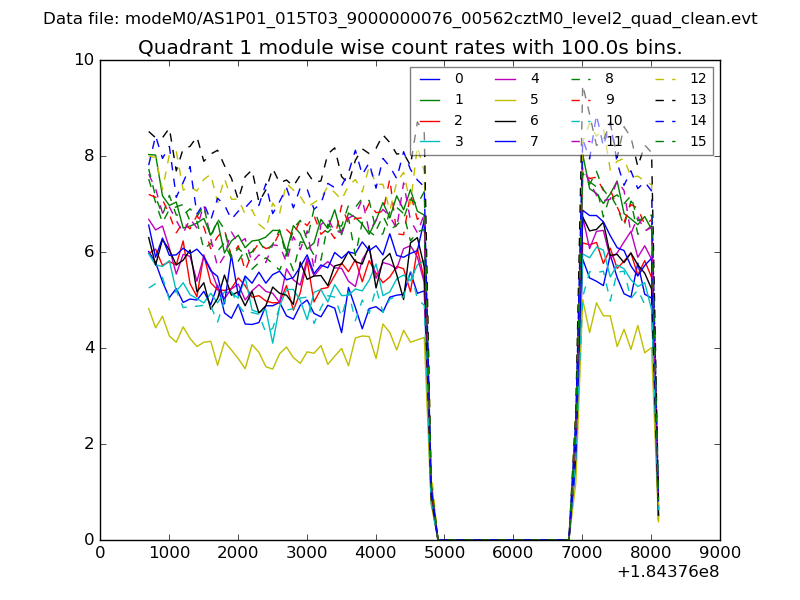 |
 |
| Module-wise count rates for Quadrant C Data is divided into 100 sec bins |
 |
 |
| Module-wise count rates for Quadrant D Data is divided into 100 sec bins |
 |
 |
| Parameter | Plot |
|---|---|
| CZT HV Monitor | 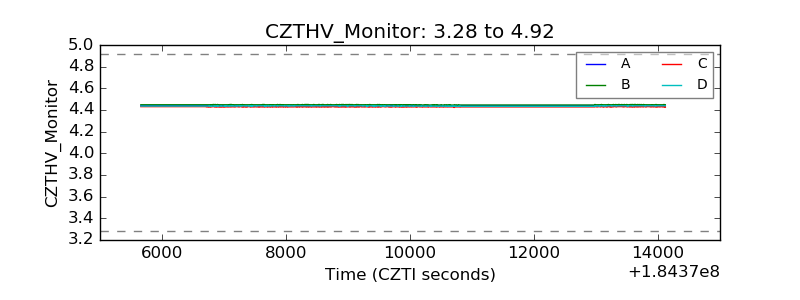 |
| D_VDD | 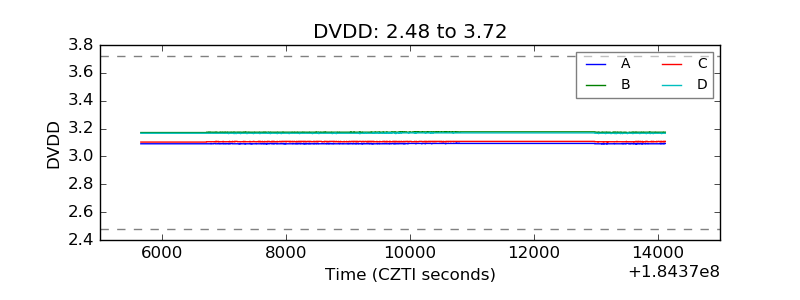 |
| Temperature 1 | 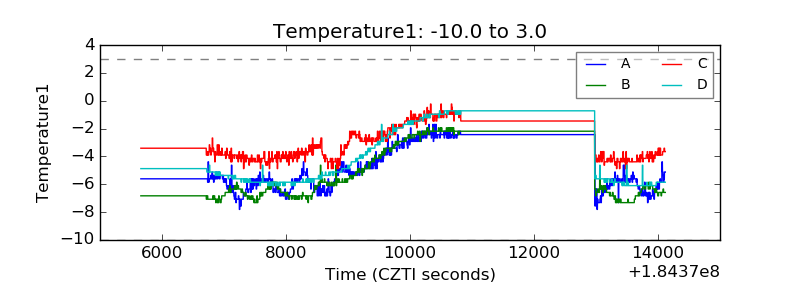 |
| Veto HV Monitor | 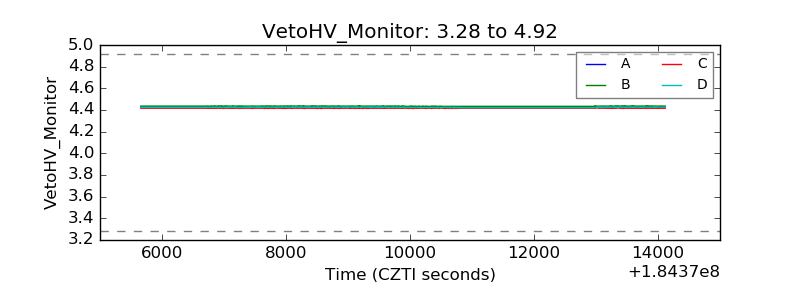 |
| Veto LLD | 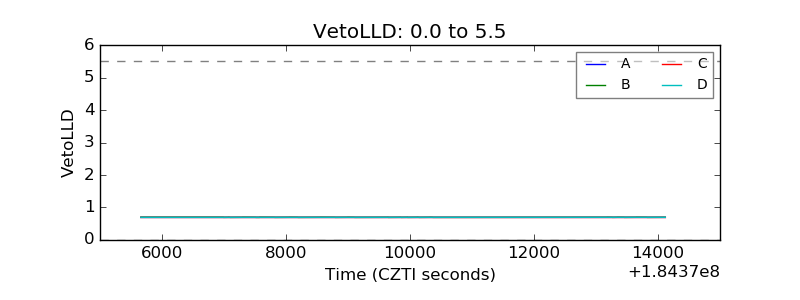 |
| Alpha Counter | 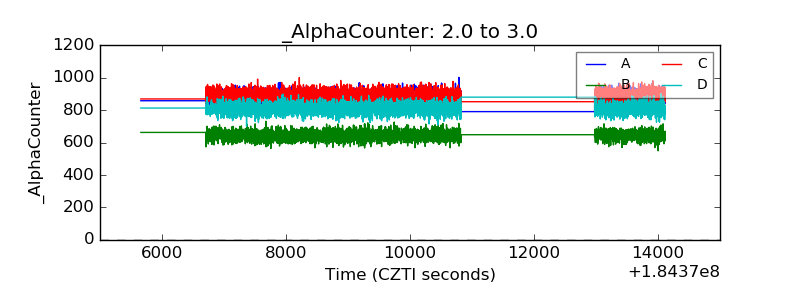 |
| _CPM_Rate | 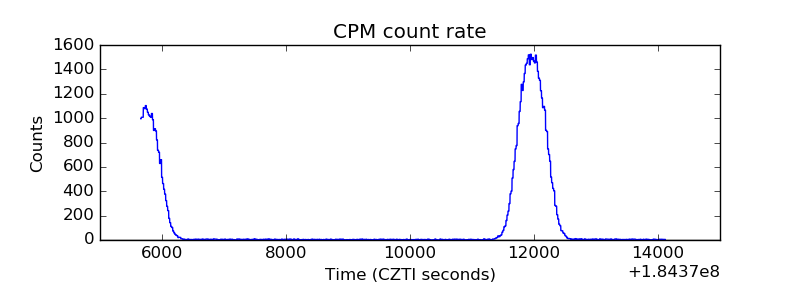 |
| CZT Counter | 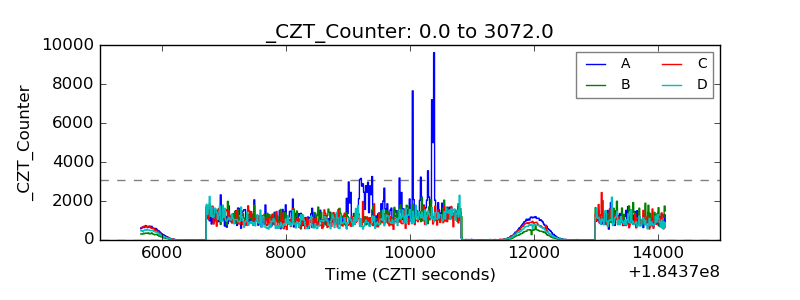 |
| +2.5 Volts monitor |  |
| +5 Volts monitor |  |
| _ROLL_ROT | 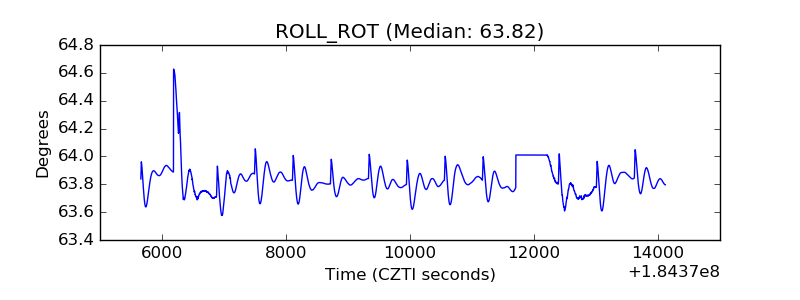 |
| _Roll_DEC | 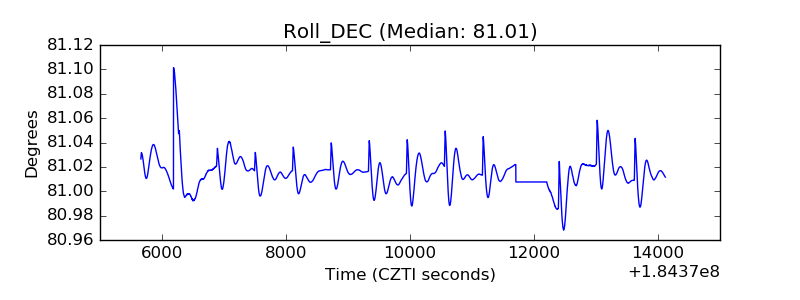 |
| _Roll_RA | 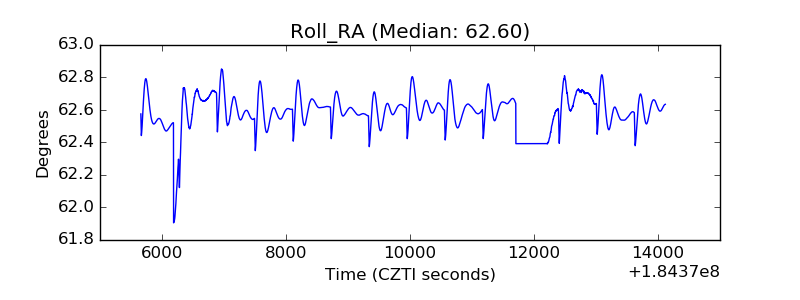 |
| Veto Counter | 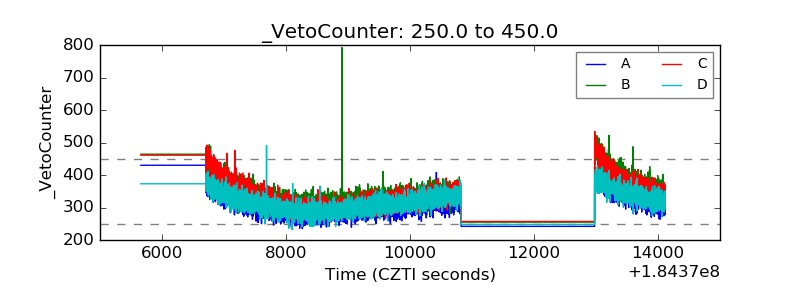 |