| Param | Original file | Final file |
|---|---|---|
| Filename | modeM0/AS1P01_015T03_9000000076_00564cztM0_level2.evt | modeM0/AS1P01_015T03_9000000076_00564cztM0_level2_quad_clean.evt |
| Size (bytes) | 929,940,480 | 92,900,160 |
| Size | 886.9 MB | 88.6 MB |
| Events in quadrant A | 7,055,070 | 598,613 |
| Events in quadrant B | 7,462,745 | 610,892 |
| Events in quadrant C | 6,347,276 | 605,909 |
| Events in quadrant D | 6,896,670 | 576,247 |
| Mode M0 | |||
|---|---|---|---|
| Quadrant | BADHDUFLAG | Total packets | Discarded packets |
| A | 0 | 25201 | 2 |
| B | 0 | 26459 | 2 |
| C | 0 | 23191 | 2 |
| D | 0 | 24797 | 2 |
| Mode M9 | |||
|---|---|---|---|
| Quadrant | BADHDUFLAG | Total packets | Discarded packets |
| A | 0 | 28 | 0 |
| B | 0 | 28 | 0 |
| C | 0 | 28 | 0 |
| D | 0 | 29 | 0 |
| Mode SS | |||
|---|---|---|---|
| Quadrant | BADHDUFLAG | Total packets | Discarded packets |
| A | 0 | 124 | 0 |
| B | 0 | 124 | 0 |
| C | 0 | 124 | 0 |
| D | 0 | 124 | 0 |
| Quadrant | Total seconds | Saturated seconds | Saturation percentage |
|---|---|---|---|
| A | 6035 | 4 | 0.066280% |
| B | 6035 | 29 | 0.480530% |
| C | 6035 | 13 | 0.215410% |
| D | 6035 | 85 | 1.408451% |
Noise dominated data is calculated using 1-second bins in cleaned event files. If a bin has >2000 counts, and if more than 50% of those come from <1% of pixels, then it is considered to be noise-dominated and hence unusable.
| Quadrant | # 1 sec bins | Bins with >0 counts | Bins with >2000 counts | High rate bins dominated by noise | Noise dominated (total time) | Noise dominated (detector-on time) | Marked lightcurve |
|---|---|---|---|---|---|---|---|
| A | 8190 | 6036 | 103 | 103 | 1.26% | 1.71% | 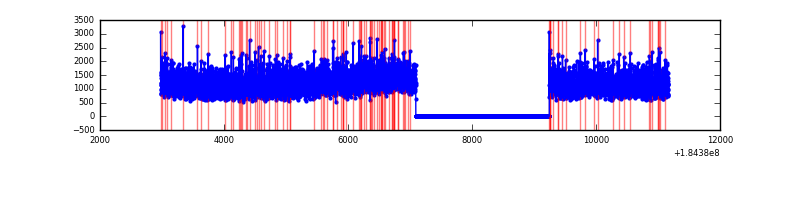 |
| B | 8190 | 6036 | 190 | 190 | 2.32% | 3.15% | 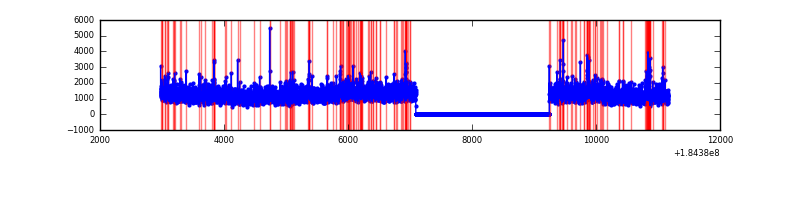 |
| C | 8190 | 6036 | 80 | 80 | 0.98% | 1.33% | 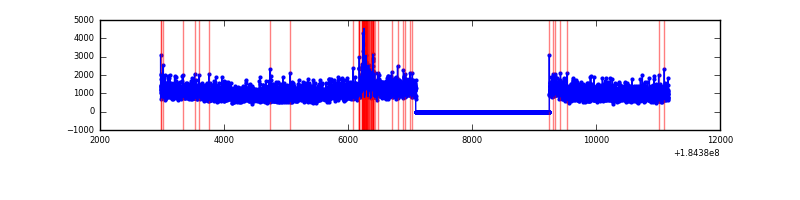 |
| D | 8190 | 6036 | 343 | 343 | 4.19% | 5.68% | 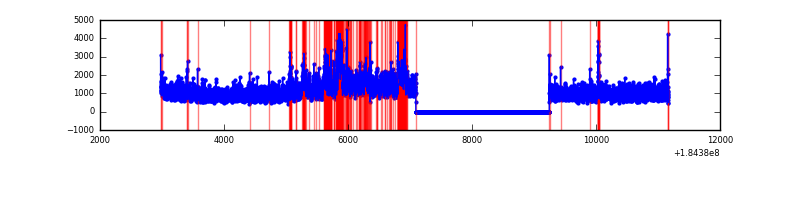 |
Top three noisy pixels from each quadrant. If the there are fewer than three noisy pixels in the level2.evt file, extra rows are filled as -1
| Pixel properties | Quadrant properties | ||||||
|---|---|---|---|---|---|---|---|
| Quadrant | DetID | PixID | Counts | Sigma | Mean | Median | Sigma |
| A | 0 | 238 | 51995 | 126.03 | 1789 | 1768 | 398.5 |
| A | 13 | 160 | 34573 | 82.31 | 1789 | 1768 | 398.5 |
| A | 12 | 133 | 28104 | 66.08 | 1789 | 1768 | 398.5 |
| B | 4 | 250 | 189740 | 454.03 | 1783 | 1796 | 413.9 |
| B | 8 | 4 | 188008 | 449.85 | 1783 | 1796 | 413.9 |
| B | 4 | 232 | 53727 | 125.45 | 1783 | 1796 | 413.9 |
| C | 0 | 221 | 133139 | 304.09 | 1561 | 1612 | 432.5 |
| C | 3 | 159 | 49925 | 111.7 | 1561 | 1612 | 432.5 |
| C | 15 | 241 | 15557 | 32.24 | 1561 | 1612 | 432.5 |
| D | 12 | 237 | 373383 | 790.21 | 1509 | 1569 | 470.5 |
| D | 13 | 41 | 213868 | 451.2 | 1509 | 1569 | 470.5 |
| D | 1 | 4 | 213167 | 449.71 | 1509 | 1569 | 470.5 |
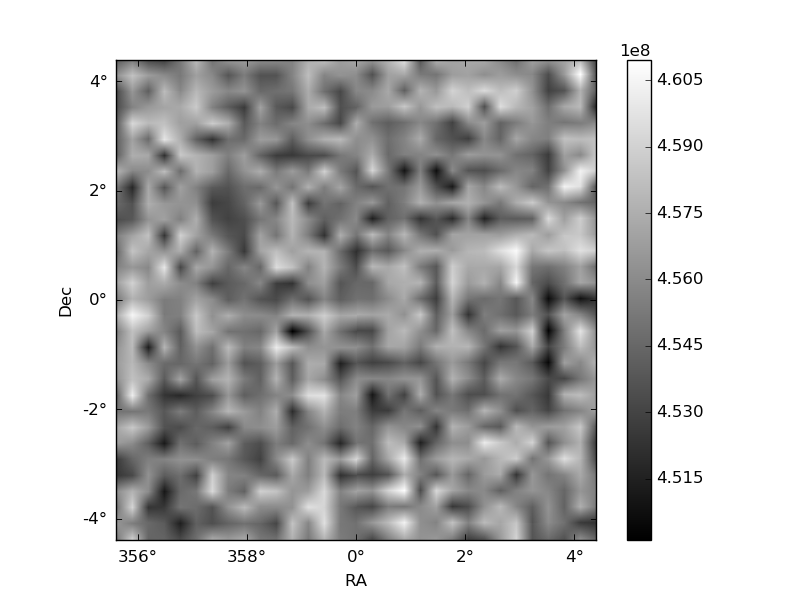
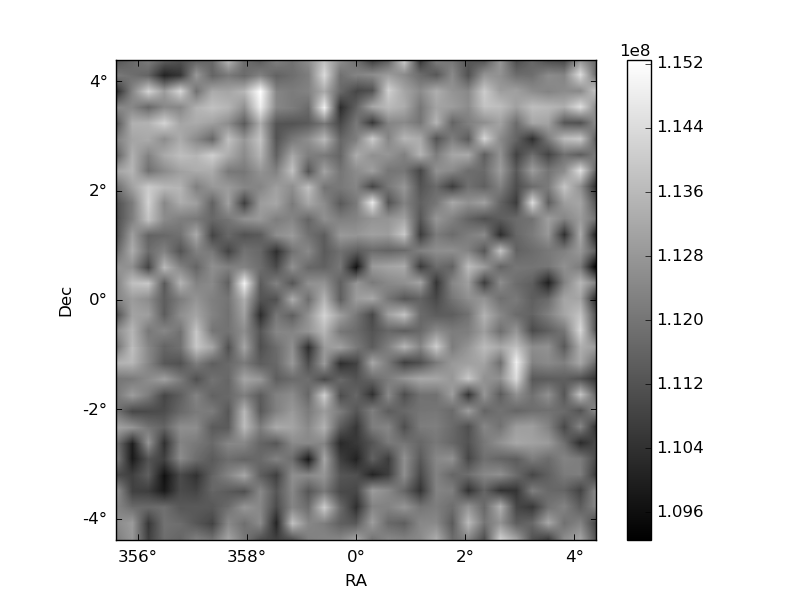
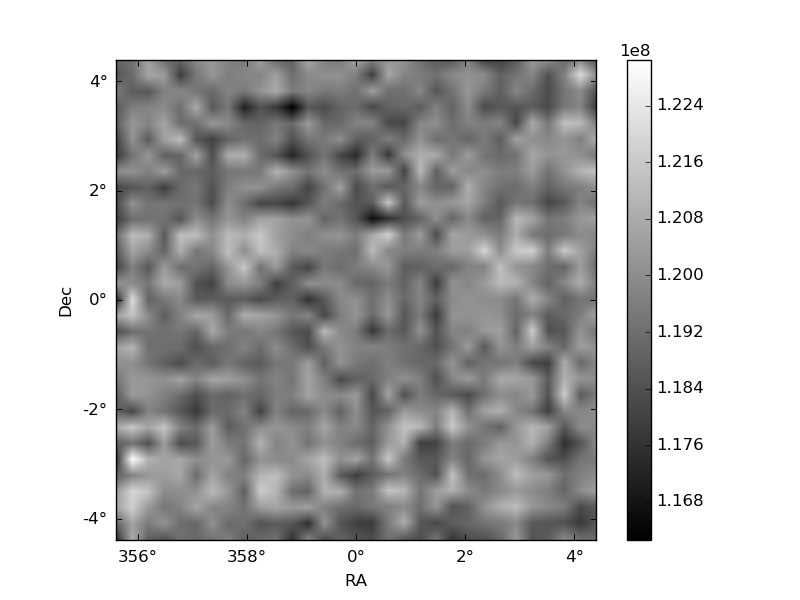
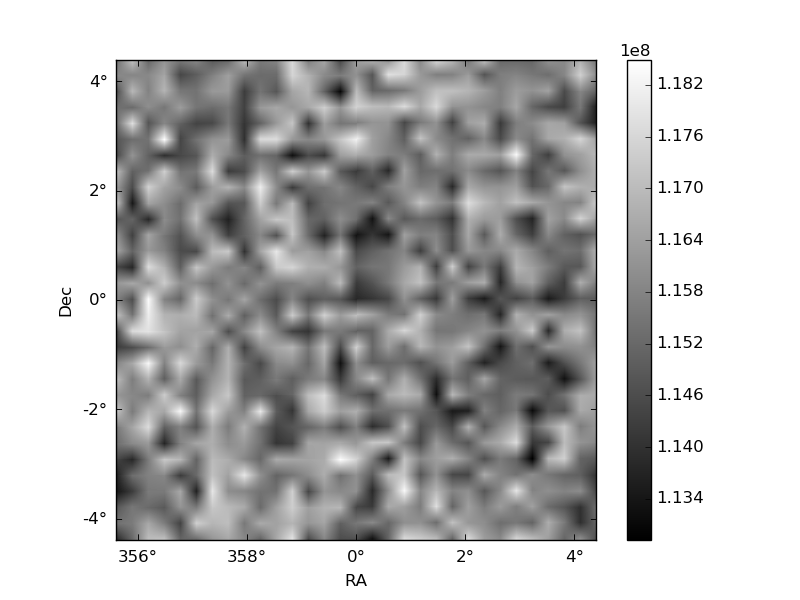
Histogram calculated using DETX and DETY for each event in the final _common_clean file
| Quadrant A | 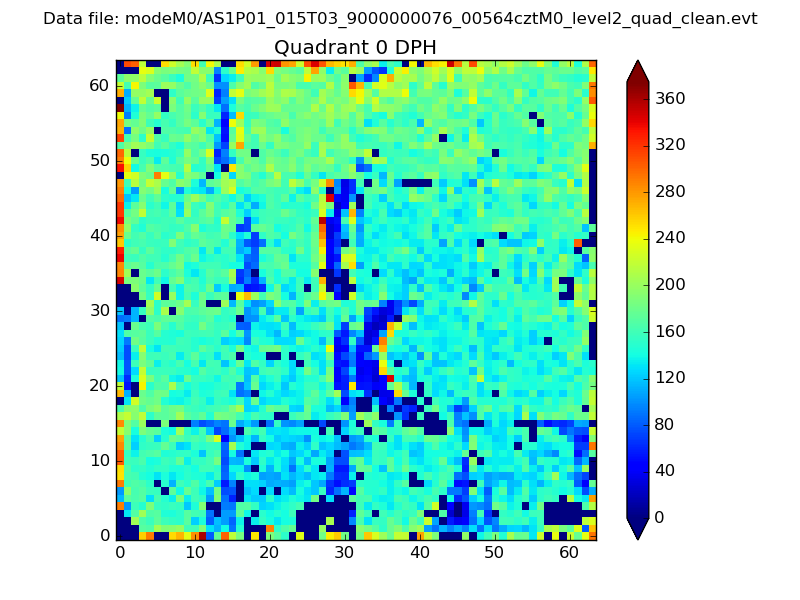 |
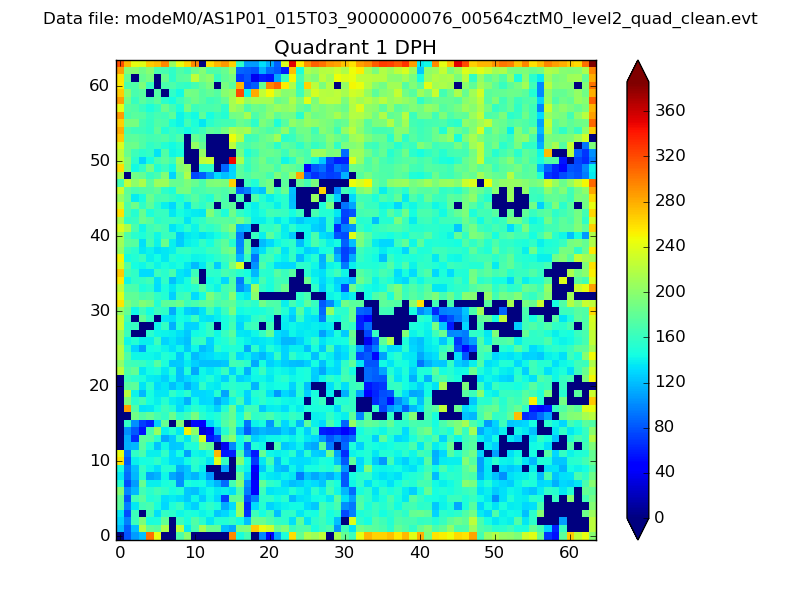 |
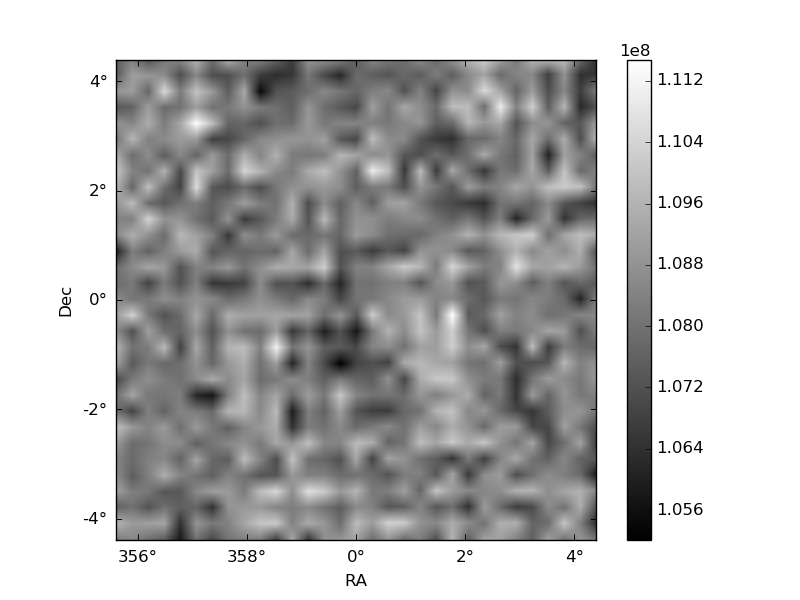
Quadrant B |
|---|---|---|---|
| Quadrant D | 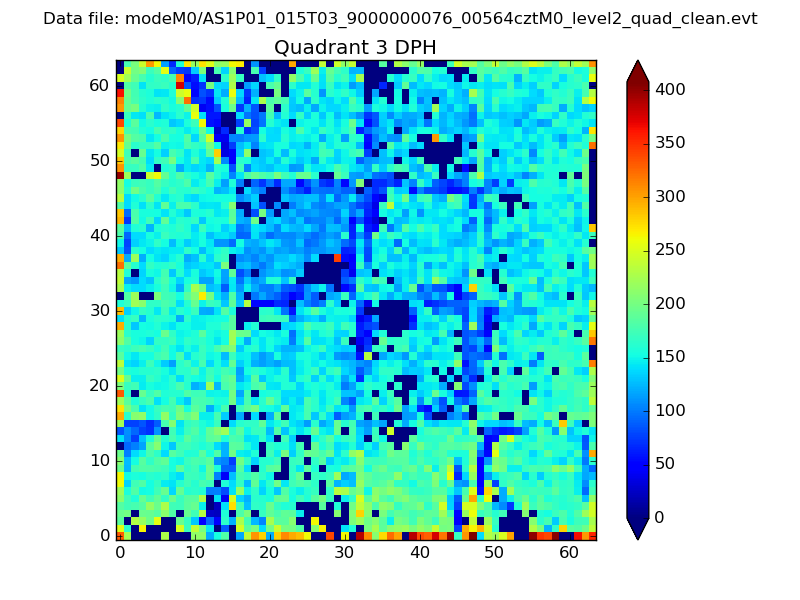 |
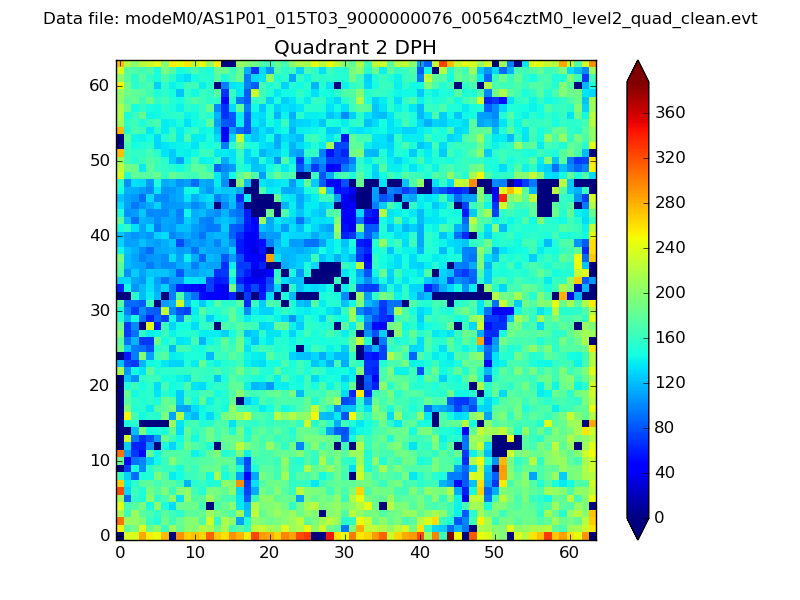 |
Quadrant C |
| Plot type | Count rate plots | Images |
|---|---|---|
| Comparison with Poisson distribution Blue bars denote a histogram of data divided into 1 sec bins. Red curve is a Poisson curve with rate = median count rate of data. |
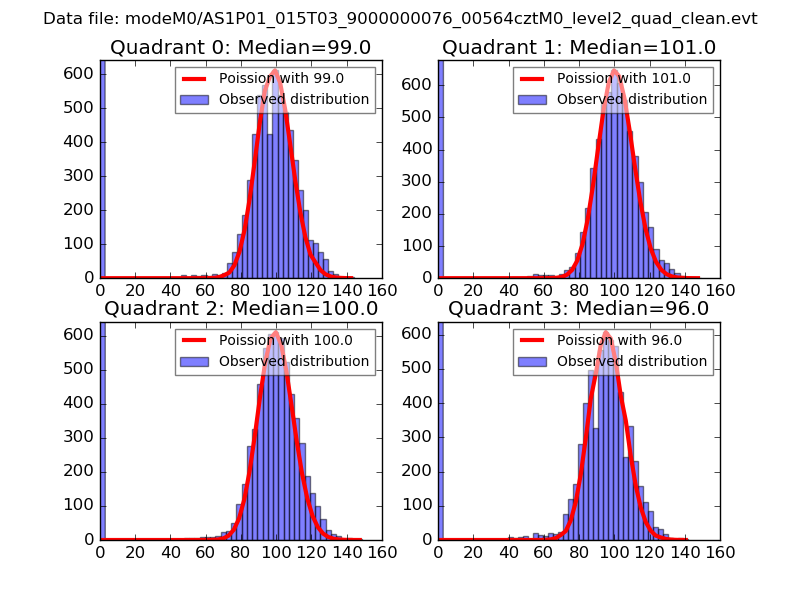 |
 |
| Quadrant-wise count rates Data is divided into 100 sec bins |
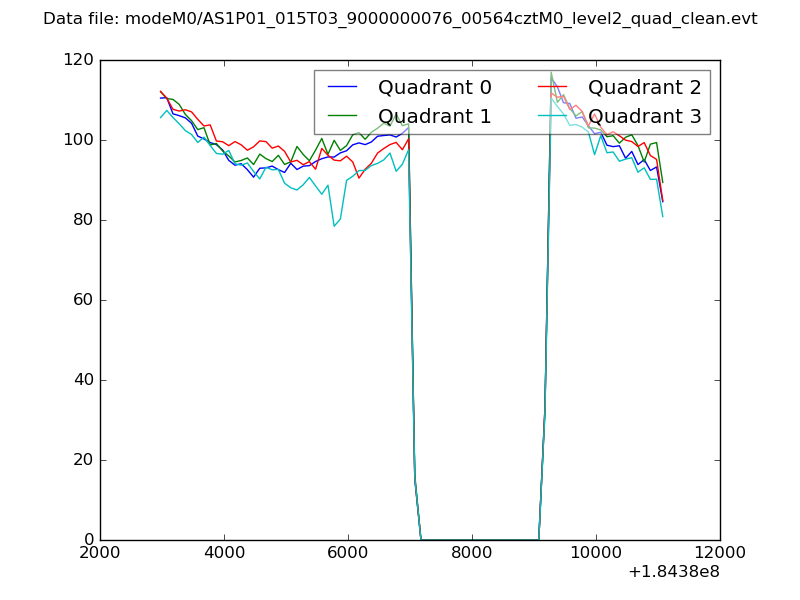 |
|
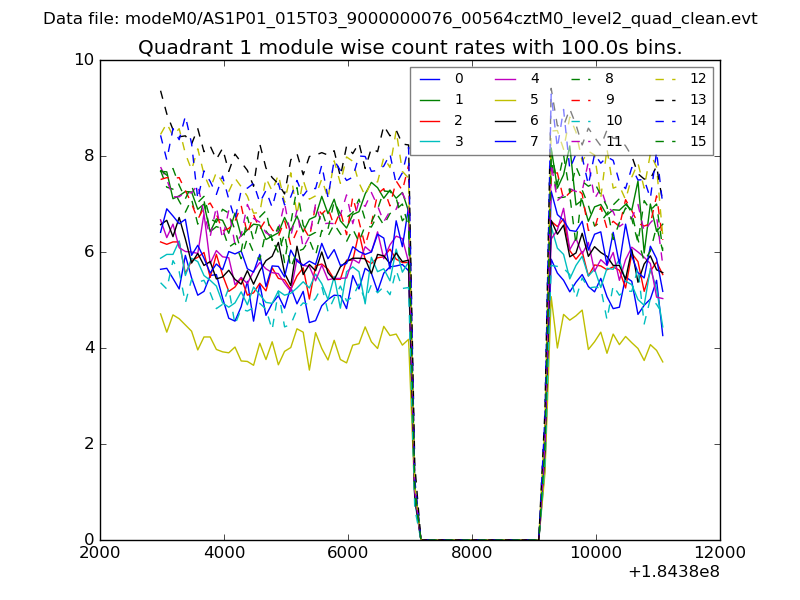
| Module-wise count rates for Quadrant A Data is divided into 100 sec bins |
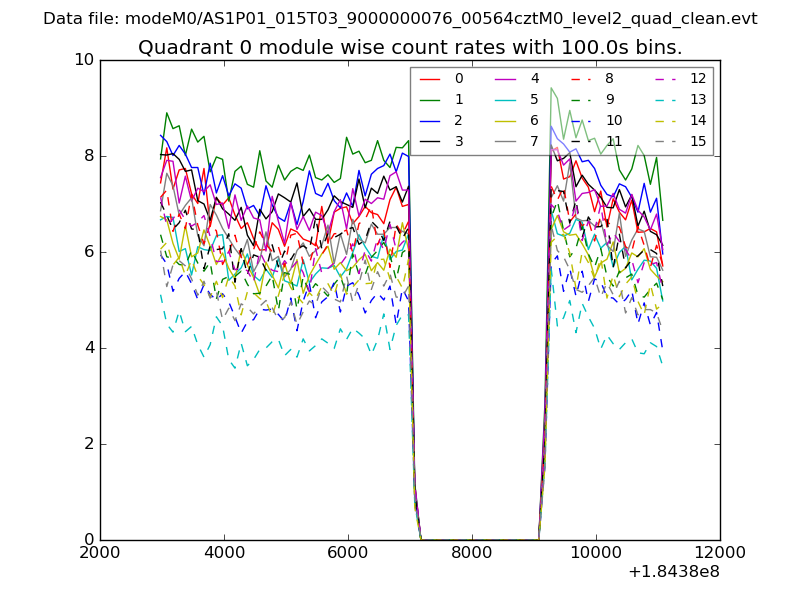 |
 |
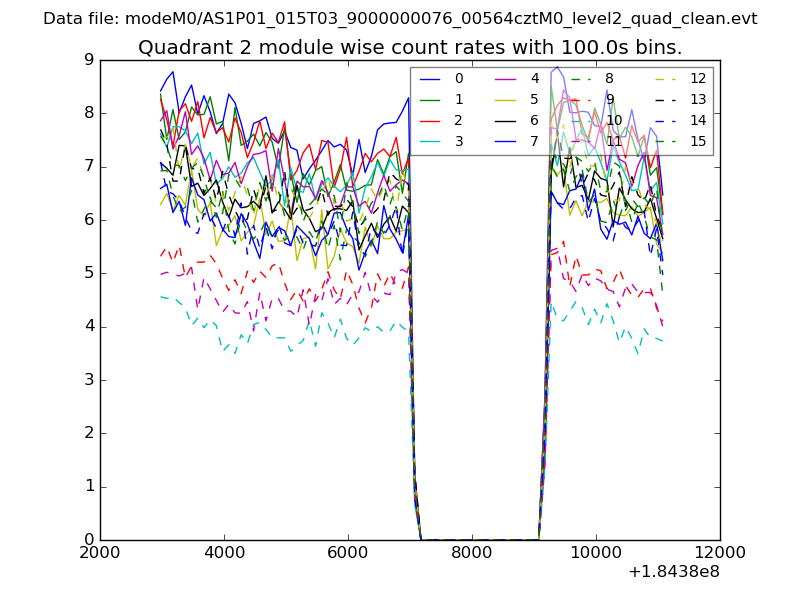
| Module-wise count rates for Quadrant B Data is divided into 100 sec bins |
 |
 |
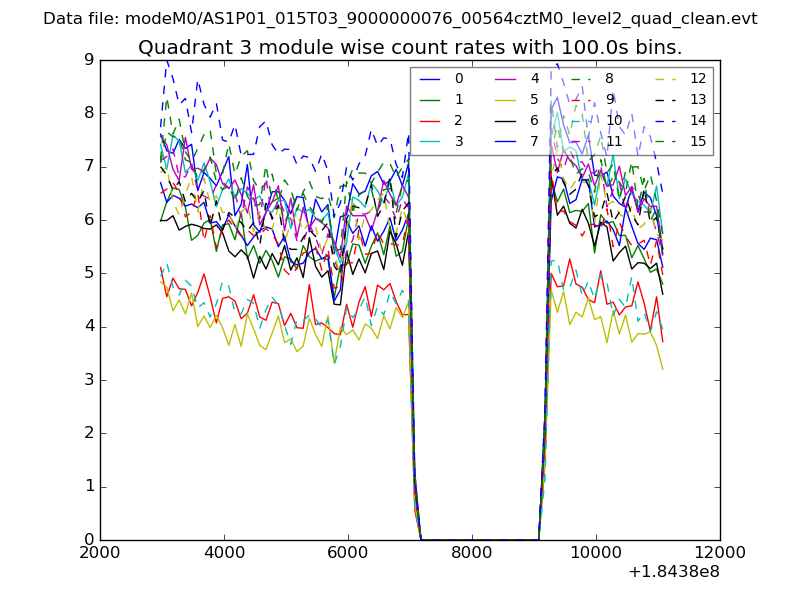
| Module-wise count rates for Quadrant C Data is divided into 100 sec bins |
 |
 |
| Module-wise count rates for Quadrant D Data is divided into 100 sec bins |
 |
 |
| Parameter | Plot |
|---|---|
| CZT HV Monitor | 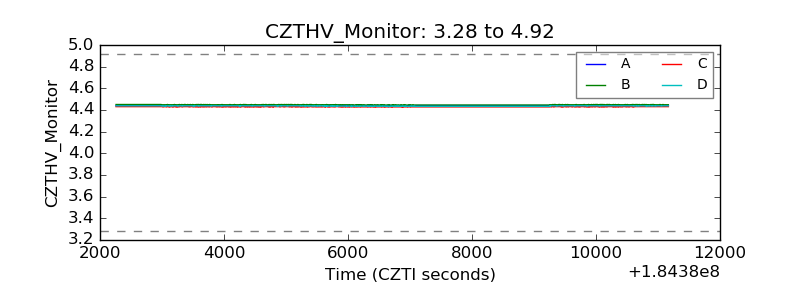 |
| D_VDD | 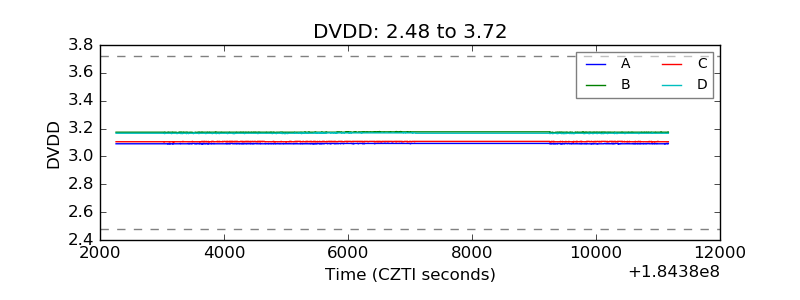 |
| Temperature 1 | 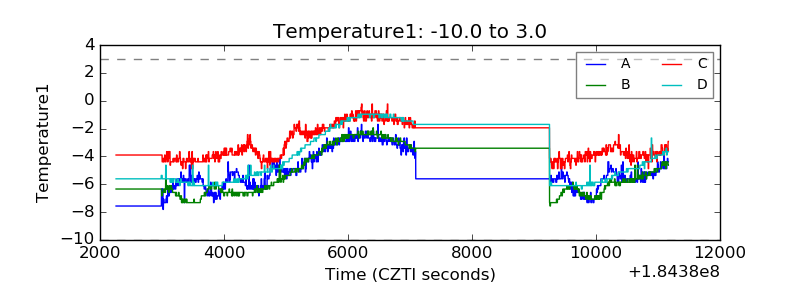 |
| Veto HV Monitor | 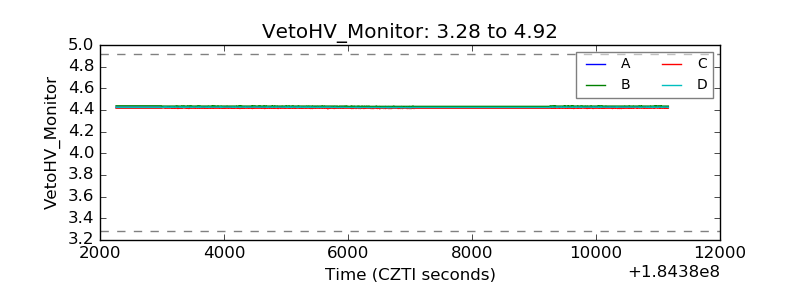 |
| Veto LLD | 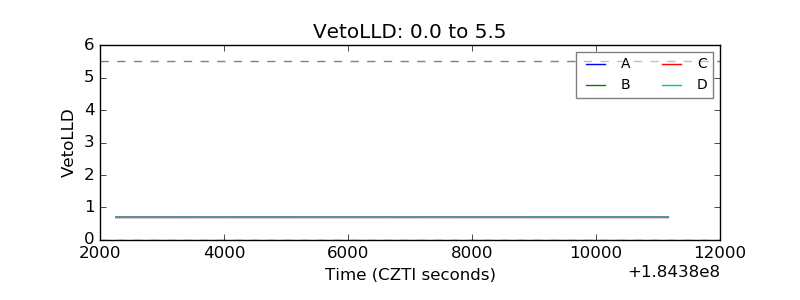 |
| Alpha Counter | 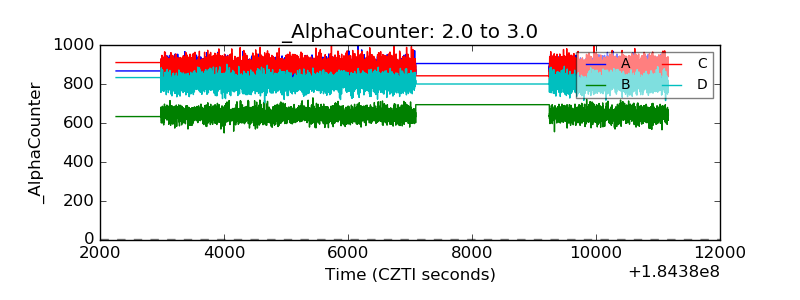 |
| _CPM_Rate | 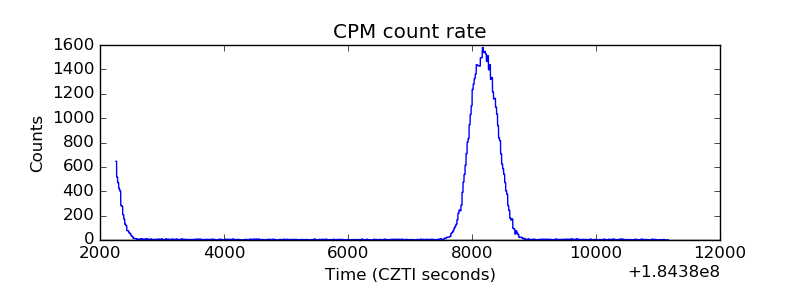 |
| CZT Counter | 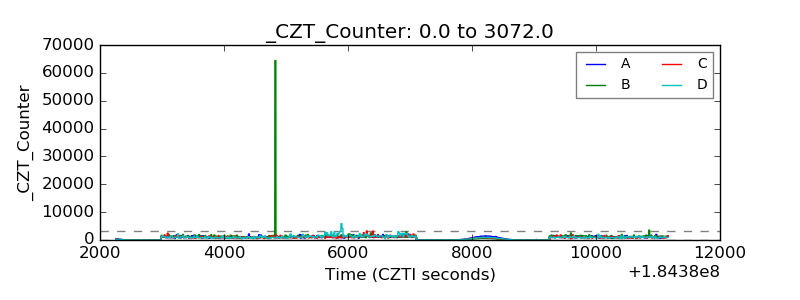 |
| +2.5 Volts monitor |  |
| +5 Volts monitor | 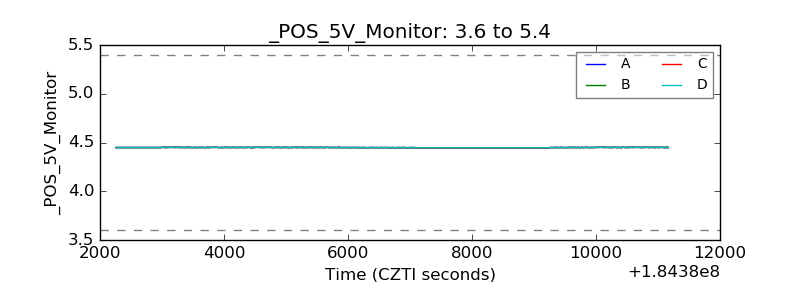 |
| _ROLL_ROT | 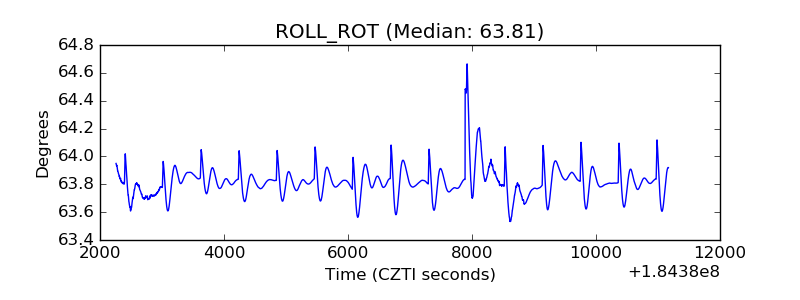 |
| _Roll_DEC | 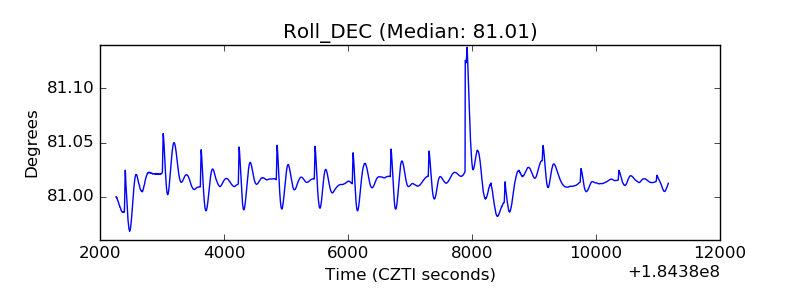 |
| _Roll_RA | 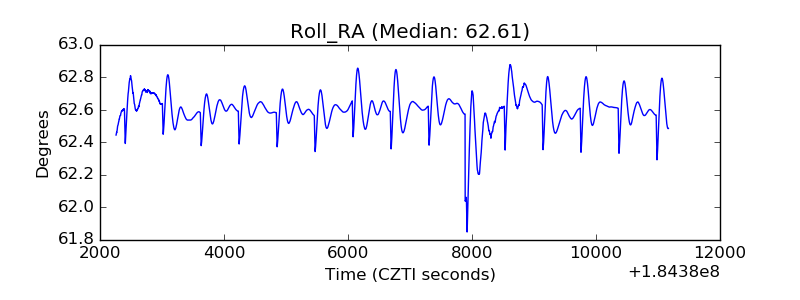 |
| Veto Counter | 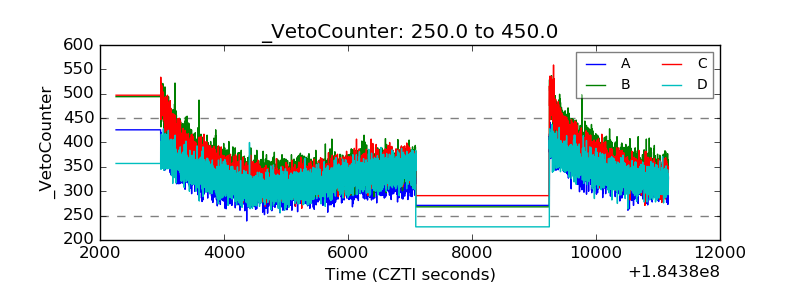 |