| Param | Original file | Final file |
|---|---|---|
| Filename | modeM0/AS1P01_014T01_9000000080cztM0_level2.fits | modeM0/AS1P01_014T01_9000000080cztM0_level2_quad_clean.evt |
| Size (bytes) | 286,473,600 | 419,892,480 |
| Size | 273.2 MB | 400.4 MB |
| Events in quadrant A | 1,596,832 | 2,594,591 |
| Events in quadrant B | 1,625,036 | 2,689,350 |
| Events in quadrant C | 1,592,716 | 2,577,039 |
| Events in quadrant D | 1,353,910 | 2,350,326 |
| Mode M0 | |||
|---|---|---|---|
| Quadrant | BADHDUFLAG | Total packets | Discarded packets |
| A | 0 | 163110 | 0 |
| B | 0 | 152865 | 0 |
| C | 0 | 146336 | 0 |
| D | 0 | 154570 | 0 |
| Mode M9 | |||
|---|---|---|---|
| Quadrant | BADHDUFLAG | Total packets | Discarded packets |
| A | 0 | 173 | 0 |
| B | 0 | 173 | 0 |
| C | 0 | 173 | 0 |
| D | 0 | 173 | 0 |
| Mode SS | |||
|---|---|---|---|
| Quadrant | BADHDUFLAG | Total packets | Discarded packets |
| A | 0 | 748 | 0 |
| B | 0 | 748 | 0 |
| C | 0 | 748 | 0 |
| D | 0 | 748 | 0 |
| Quadrant | Total seconds | Saturated seconds | Saturation percentage |
|---|---|---|---|
| A | 36485 | 1280 | 3.508291% |
| B | 36485 | 76 | 0.208305% |
| C | 36485 | 573 | 1.570508% |
| D | 36485 | 490 | 1.343018% |
Noise dominated data is calculated using 1-second bins in cleaned event files. If a bin has >2000 counts, and if more than 50% of those come from <1% of pixels, then it is considered to be noise-dominated and hence unusable.
| Quadrant | # 1 sec bins | Bins with >0 counts | Bins with >2000 counts | High rate bins dominated by noise | Noise dominated (total time) | Noise dominated (detector-on time) | Marked lightcurve |
|---|---|---|---|---|---|---|---|
| A | 53728 | 36482 | 0 | 0 | 0.00% | 0.00% | 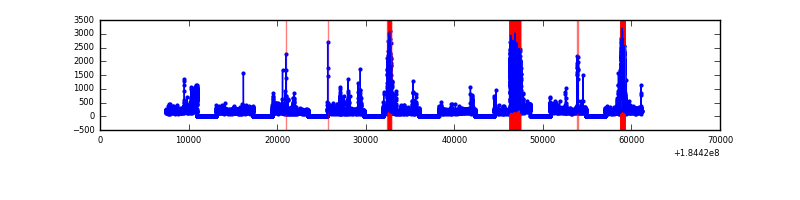 |
| B | 53728 | 36485 | 0 | 0 | 0.00% | 0.00% |  |
| C | 53728 | 36480 | 0 | 0 | 0.00% | 0.00% | 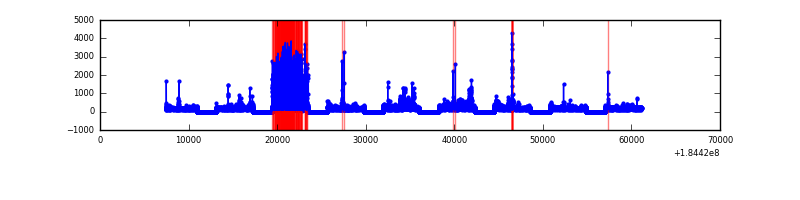 |
| D | 53728 | 36484 | 0 | 0 | 0.00% | 0.00% | 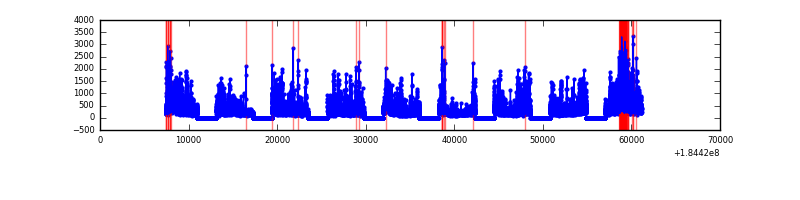 |
Top three noisy pixels from each quadrant. If the there are fewer than three noisy pixels in the level2.evt file, extra rows are filled as -1
| Pixel properties | Quadrant properties | ||||||
|---|---|---|---|---|---|---|---|
| Quadrant | DetID | PixID | Counts | Sigma | Mean | Median | Sigma |
| A | 7 | 110 | 1496 | 11.19 | 414 | 388 | 99.0 |
| A | 0 | 29 | 1471 | 10.94 | 414 | 388 | 99.0 |
| A | 0 | 30 | 1141 | 7.61 | 414 | 388 | 99.0 |
| B | 2 | 9 | 1338 | 12.34 | 429 | 411 | 75.1 |
| B | 14 | 254 | 1071 | 8.79 | 429 | 411 | 75.1 |
| B | 2 | 8 | 1044 | 8.43 | 429 | 411 | 75.1 |
| C | 12 | 241 | 1117 | 7.05 | 420 | 390 | 103.1 |
| C | 1 | 81 | 1089 | 6.78 | 420 | 390 | 103.1 |
| C | 2 | 191 | 1075 | 6.64 | 420 | 390 | 103.1 |
| D | 6 | 44 | 1053 | 7.47 | 386 | 356 | 93.3 |
| D | 6 | 231 | 1044 | 7.38 | 386 | 356 | 93.3 |
| D | 11 | 82 | 992 | 6.82 | 386 | 356 | 93.3 |
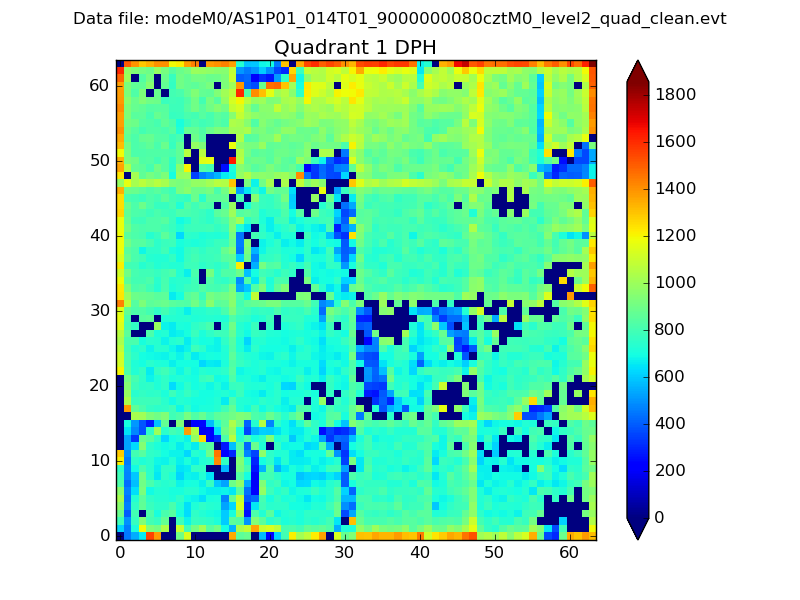
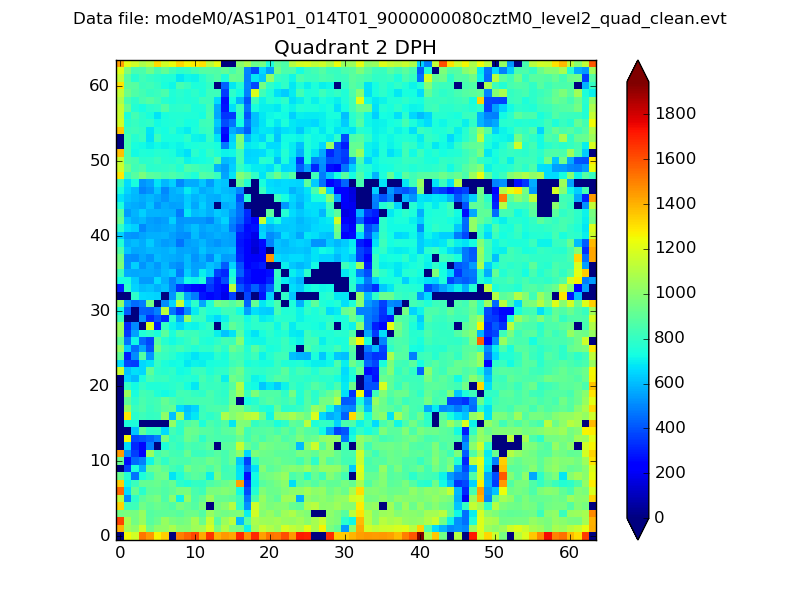
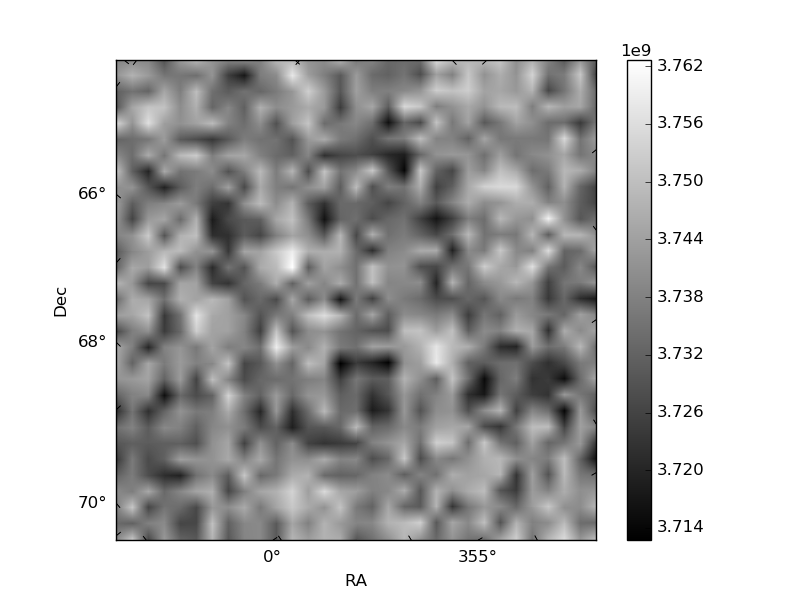
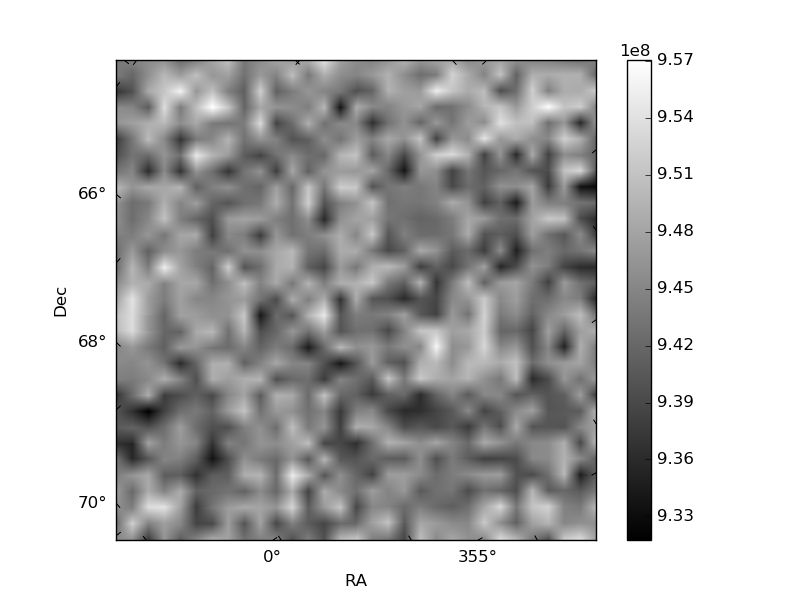
Histogram calculated using DETX and DETY for each event in the final _common_clean file
| Quadrant A | 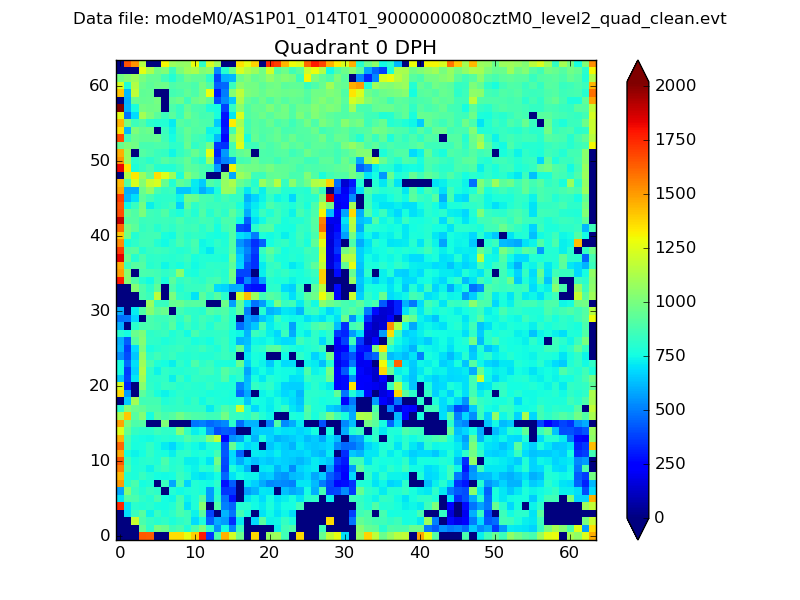 |
 |
Quadrant B |
|---|---|---|---|
| Quadrant D | 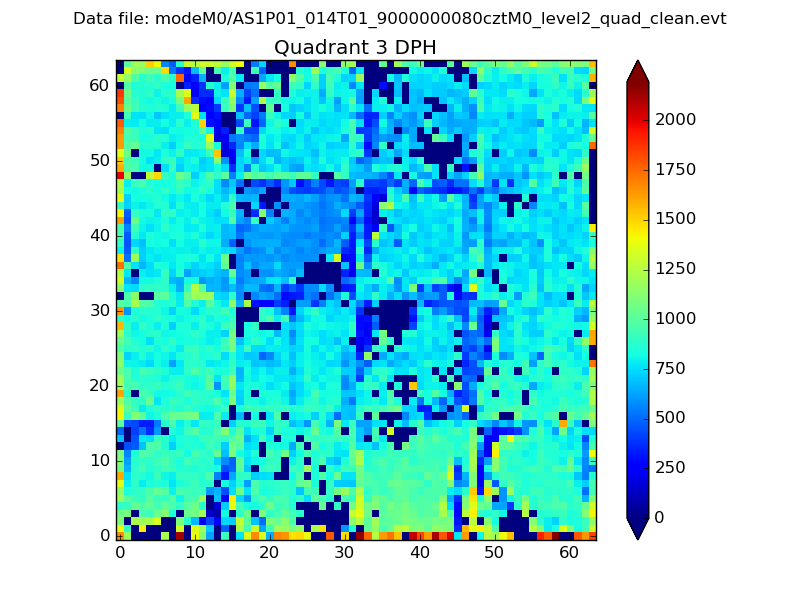 |
 |
Quadrant C |
| Plot type | Count rate plots | Images |
|---|---|---|
| Comparison with Poisson distribution Blue bars denote a histogram of data divided into 1 sec bins. Red curve is a Poisson curve with rate = median count rate of data. |
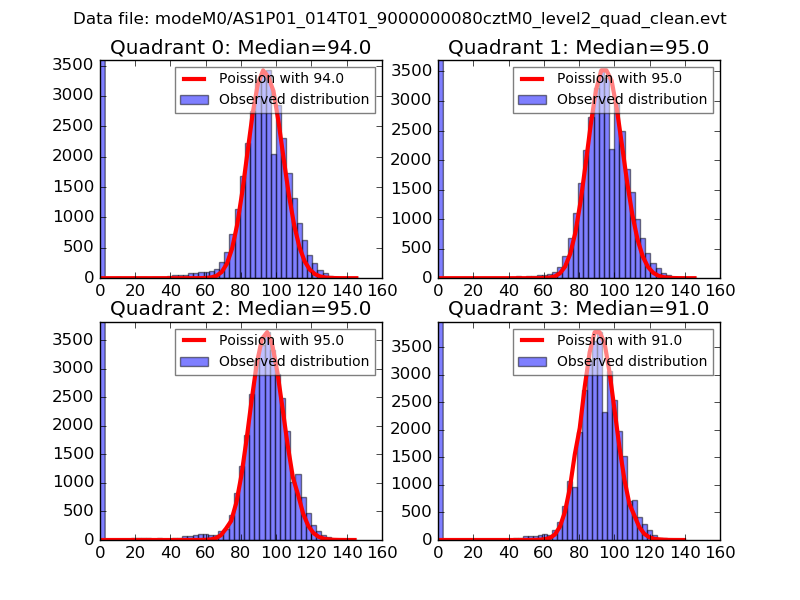 |
 |
| Quadrant-wise count rates Data is divided into 100 sec bins |
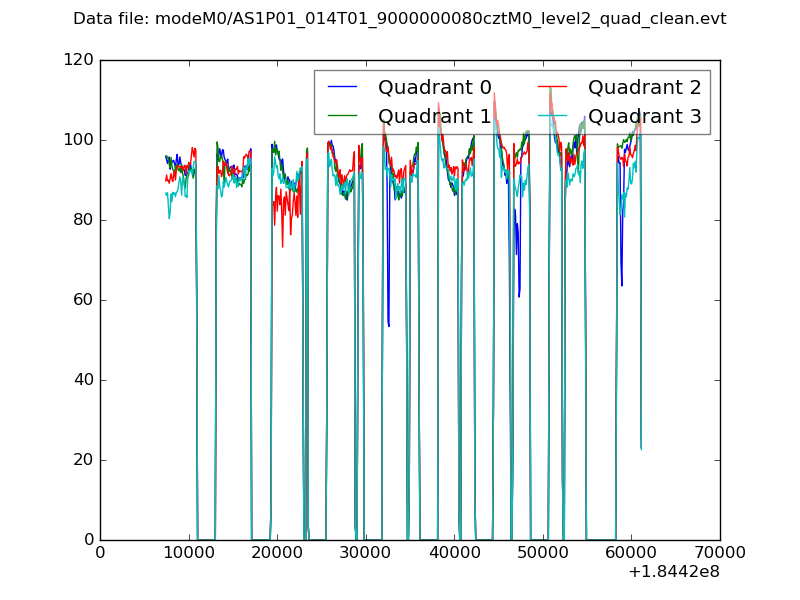 |
|
| Module-wise count rates for Quadrant A Data is divided into 100 sec bins |
 |
 |
| Module-wise count rates for Quadrant B Data is divided into 100 sec bins |
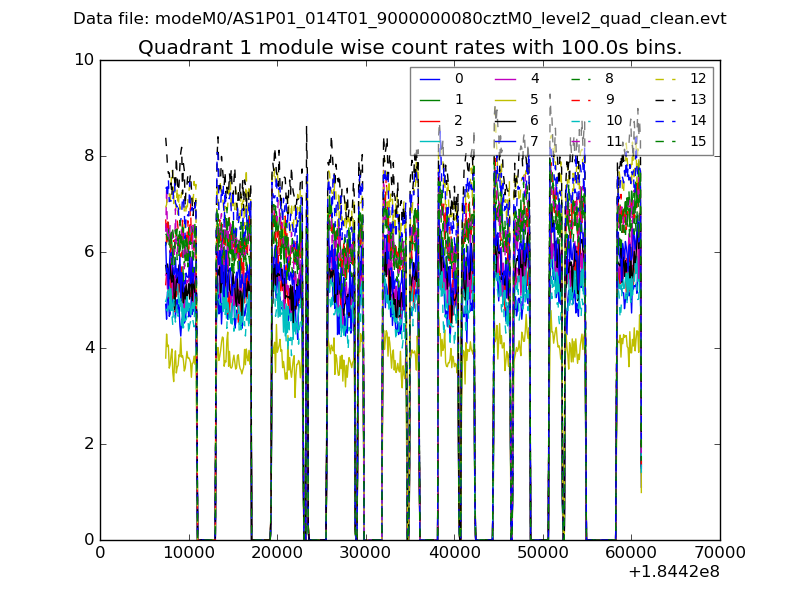 |
 |
| Module-wise count rates for Quadrant C Data is divided into 100 sec bins |
 |
 |
| Module-wise count rates for Quadrant D Data is divided into 100 sec bins |
 |
 |
| Parameter | Plot |
|---|---|
| CZT HV Monitor |  |
| D_VDD | 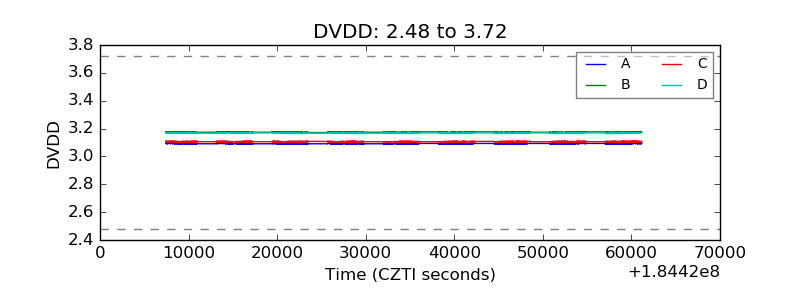 |
| Temperature 1 | 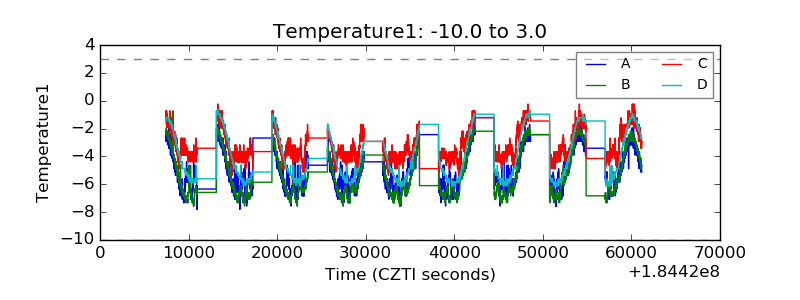 |
| Veto HV Monitor | 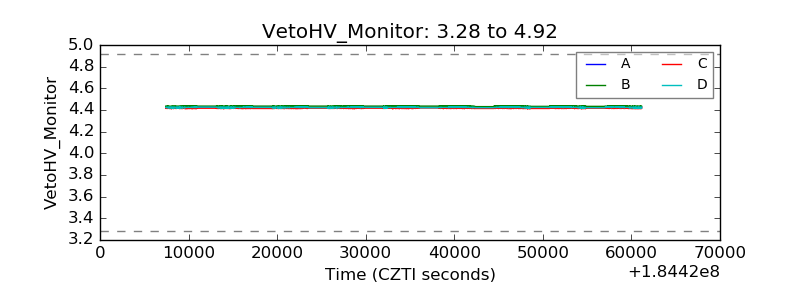 |
| Veto LLD | 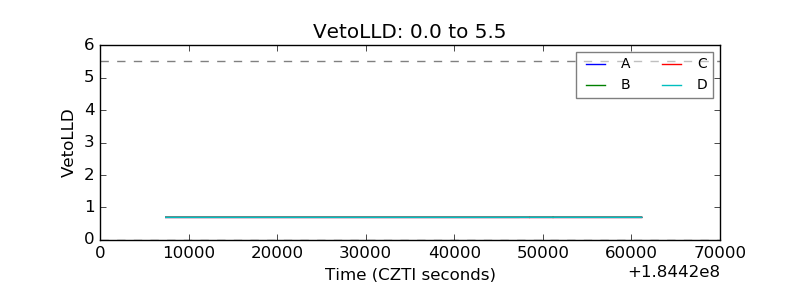 |
| Alpha Counter |  |
| _CPM_Rate |  |
| CZT Counter | 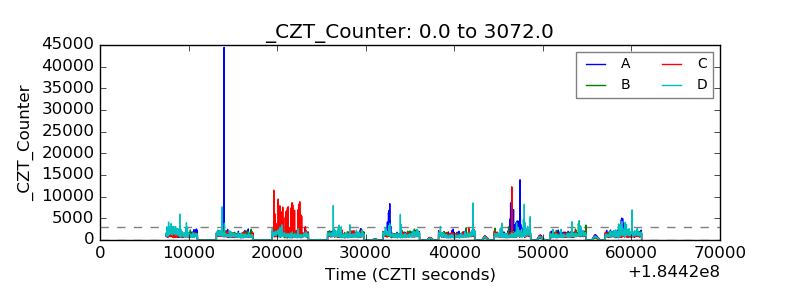 |
| +2.5 Volts monitor |  |
| +5 Volts monitor | 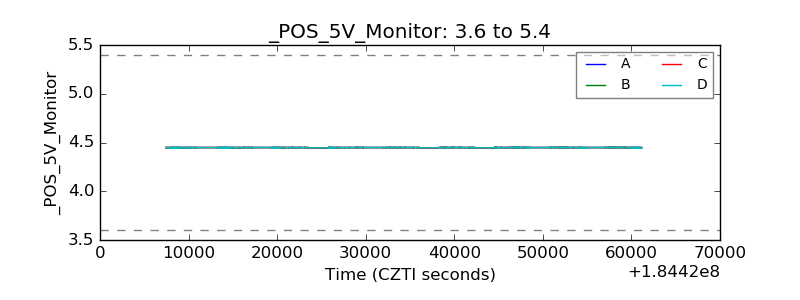 |
| _ROLL_ROT | 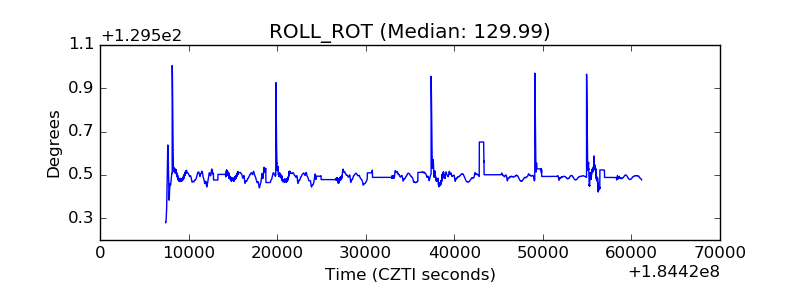 |
| _Roll_DEC |  |
| _Roll_RA | 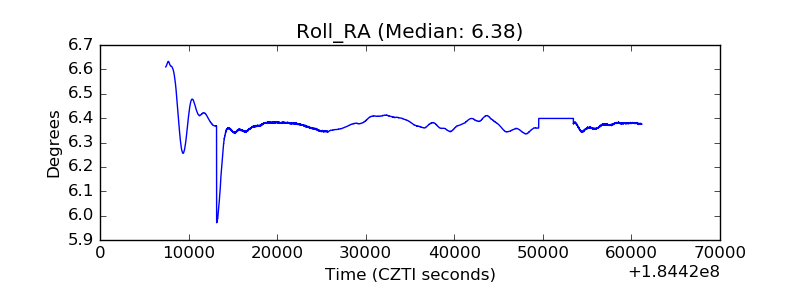 |
| Veto Counter | 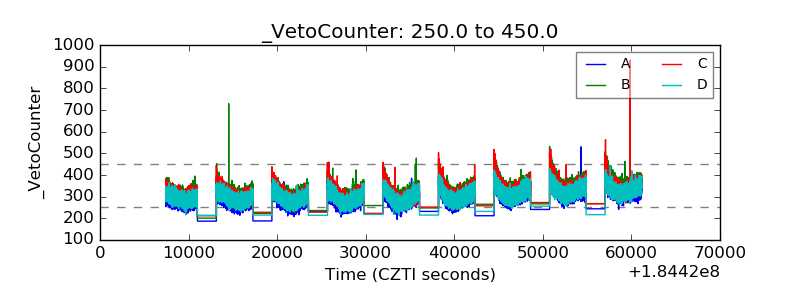 |