| Param | Original file | Final file |
|---|---|---|
| Filename | modeM0/AS1P01_014T01_9000000080_00569cztM0_level2.evt | modeM0/AS1P01_014T01_9000000080_00569cztM0_level2_quad_clean.evt |
| Size (bytes) | 99,812,160 | 8,219,520 |
| Size | 95.2 MB | 7.8 MB |
| Events in quadrant A | 716,054 | 52,226 |
| Events in quadrant B | 710,897 | 52,580 |
| Events in quadrant C | 641,448 | 49,729 |
| Events in quadrant D | 914,016 | 46,914 |
| Mode M0 | |||
|---|---|---|---|
| Quadrant | BADHDUFLAG | Total packets | Discarded packets |
| A | 0 | 2520 | 1 |
| B | 0 | 2507 | 0 |
| C | 0 | 2312 | 0 |
| D | 0 | 3115 | 0 |
| Mode SS | |||
|---|---|---|---|
| Quadrant | BADHDUFLAG | Total packets | Discarded packets |
| A | 0 | 12 | 0 |
| B | 0 | 12 | 0 |
| C | 0 | 12 | 0 |
| D | 0 | 12 | 0 |
| Quadrant | Total seconds | Saturated seconds | Saturation percentage |
|---|---|---|---|
| A | 556 | 0 | 0.000000% |
| B | 556 | 1 | 0.179856% |
| C | 556 | 0 | 0.000000% |
| D | 556 | 32 | 5.755396% |
Noise dominated data is calculated using 1-second bins in cleaned event files. If a bin has >2000 counts, and if more than 50% of those come from <1% of pixels, then it is considered to be noise-dominated and hence unusable.
| Quadrant | # 1 sec bins | Bins with >0 counts | Bins with >2000 counts | High rate bins dominated by noise | Noise dominated (total time) | Noise dominated (detector-on time) | Marked lightcurve |
|---|---|---|---|---|---|---|---|
| A | 556 | 556 | 15 | 15 | 2.70% | 2.70% | 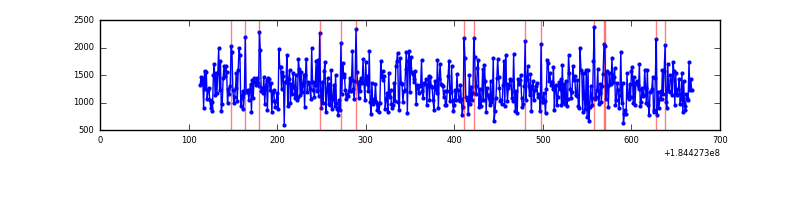 |
| B | 556 | 556 | 14 | 14 | 2.52% | 2.52% | 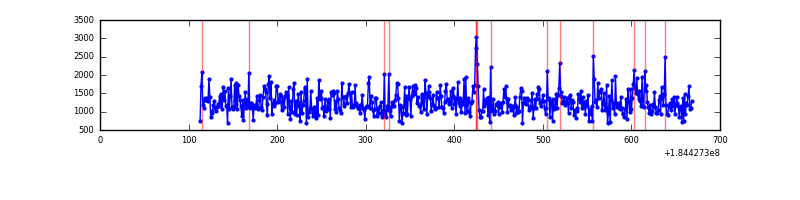 |
| C | 556 | 556 | 10 | 10 | 1.80% | 1.80% | 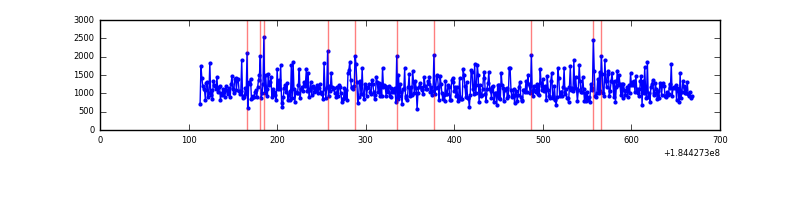 |
| D | 556 | 556 | 117 | 117 | 21.04% | 21.04% | 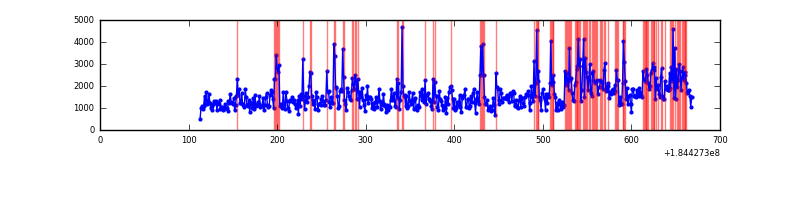 |
Top three noisy pixels from each quadrant. If the there are fewer than three noisy pixels in the level2.evt file, extra rows are filled as -1
| Pixel properties | Quadrant properties | ||||||
|---|---|---|---|---|---|---|---|
| Quadrant | DetID | PixID | Counts | Sigma | Mean | Median | Sigma |
| A | 0 | 238 | 5101 | 116.42 | 182 | 180 | 42.3 |
| A | 13 | 17 | 2183 | 47.39 | 182 | 180 | 42.3 |
| A | 13 | 190 | 1170 | 23.42 | 182 | 180 | 42.3 |
| B | 4 | 250 | 12879 | 290.13 | 175 | 175 | 43.8 |
| B | 8 | 234 | 10234 | 229.72 | 175 | 175 | 43.8 |
| B | 15 | 33 | 3288 | 71.09 | 175 | 175 | 43.8 |
| C | 3 | 159 | 3575 | 73.44 | 161 | 166 | 46.4 |
| C | 1 | 1 | 2866 | 58.17 | 161 | 166 | 46.4 |
| C | 15 | 241 | 1112 | 20.38 | 161 | 166 | 46.4 |
| D | 13 | 216 | 82181 | 1583.05 | 160 | 165 | 51.8 |
| D | 10 | 167 | 71520 | 1377.27 | 160 | 165 | 51.8 |
| D | 12 | 237 | 57678 | 1110.1 | 160 | 165 | 51.8 |
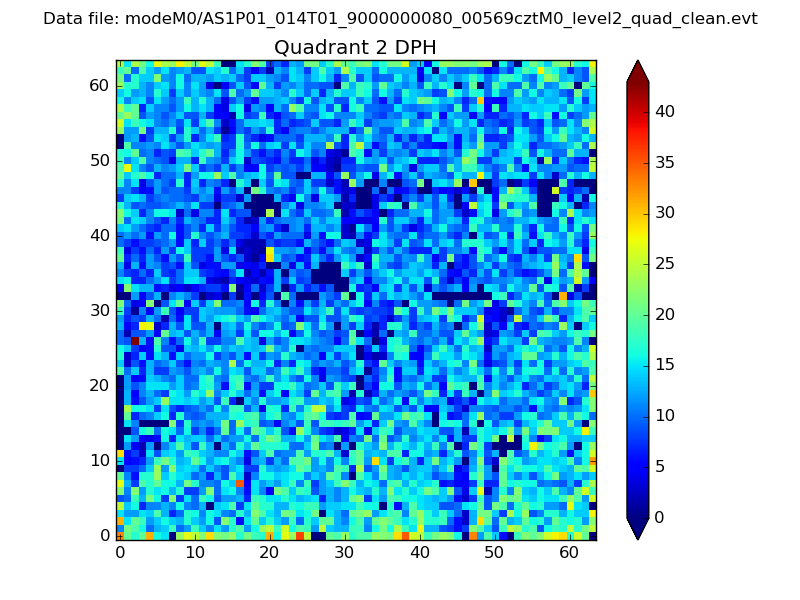
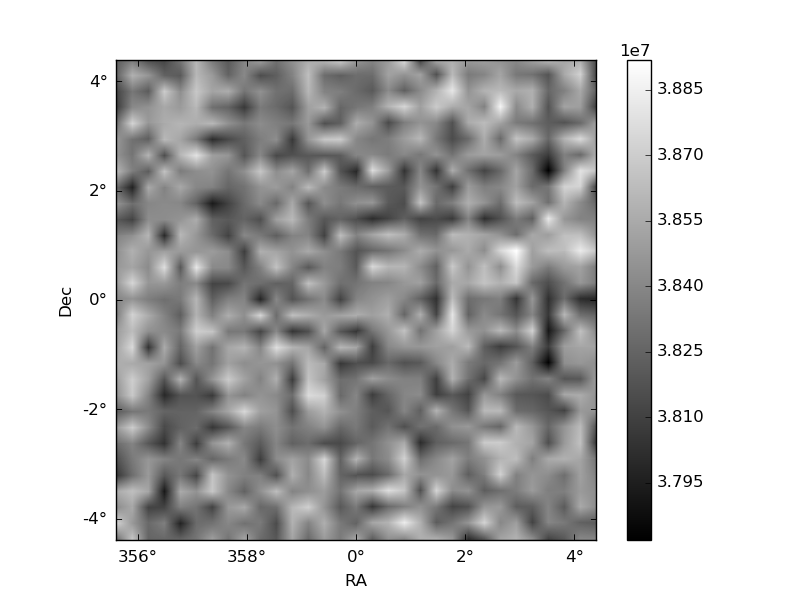
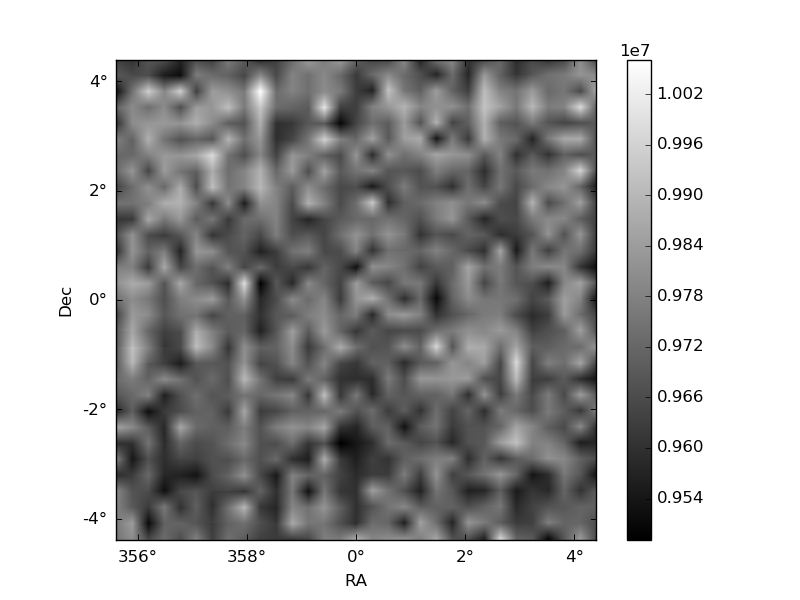
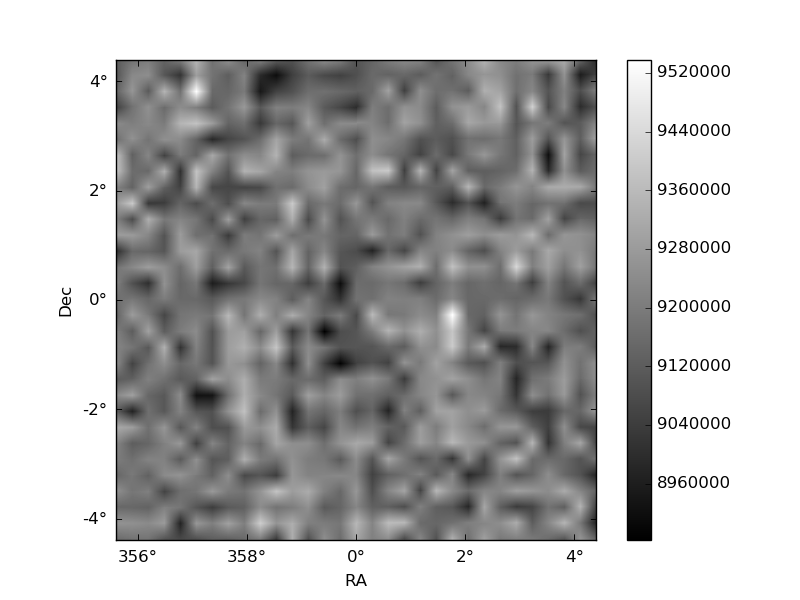
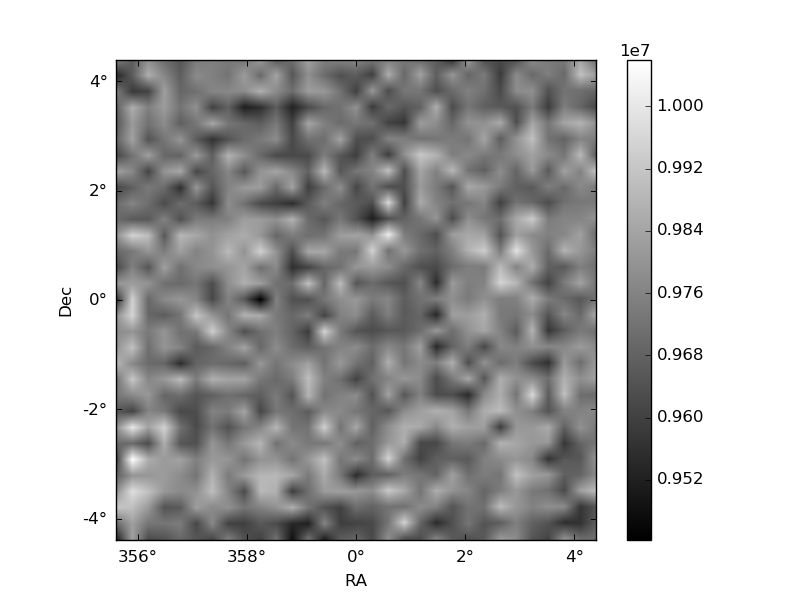
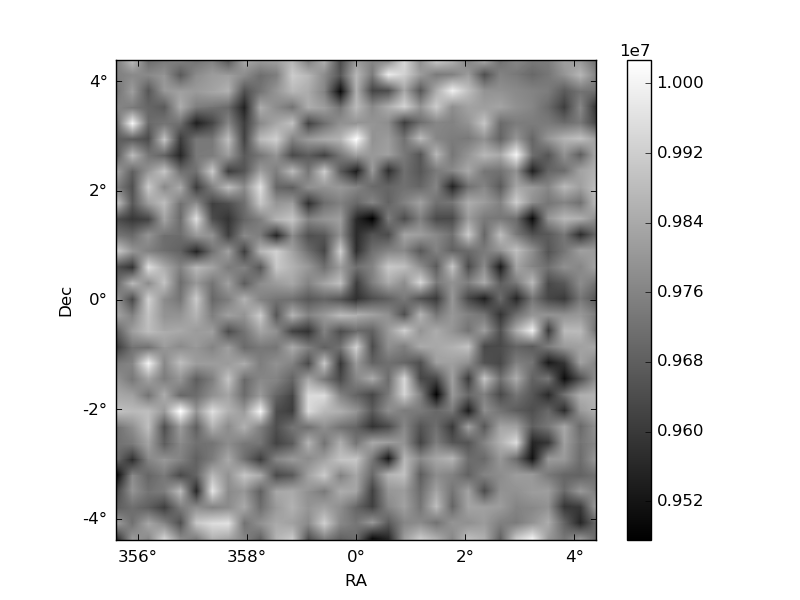
Histogram calculated using DETX and DETY for each event in the final _common_clean file
| Quadrant A | 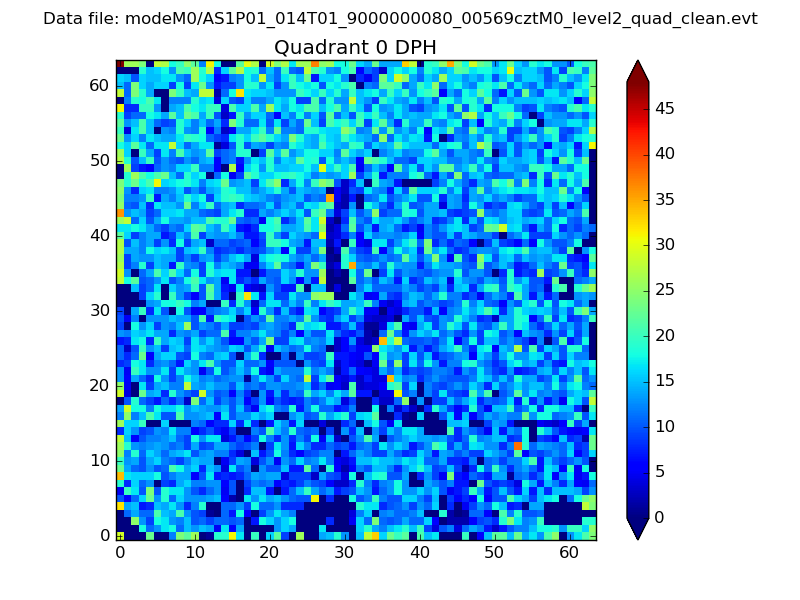 |
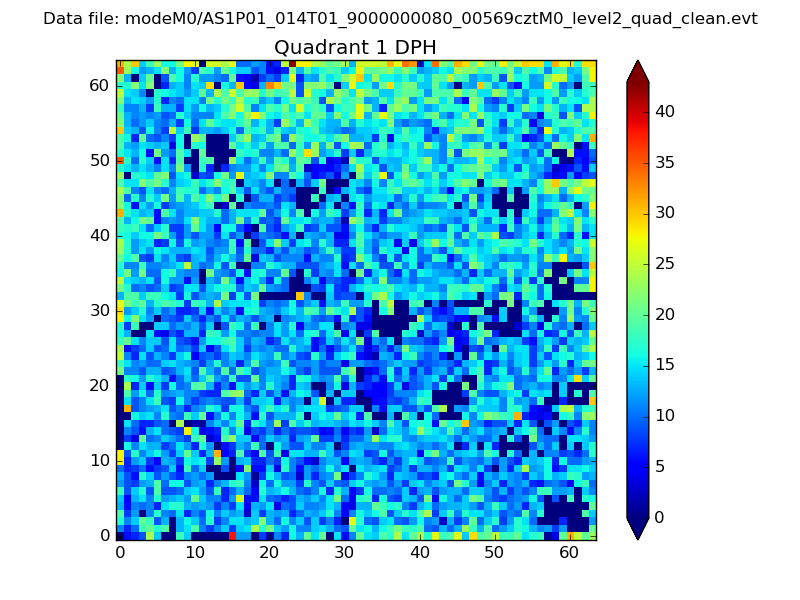 |
Quadrant B |
|---|---|---|---|
| Quadrant D | 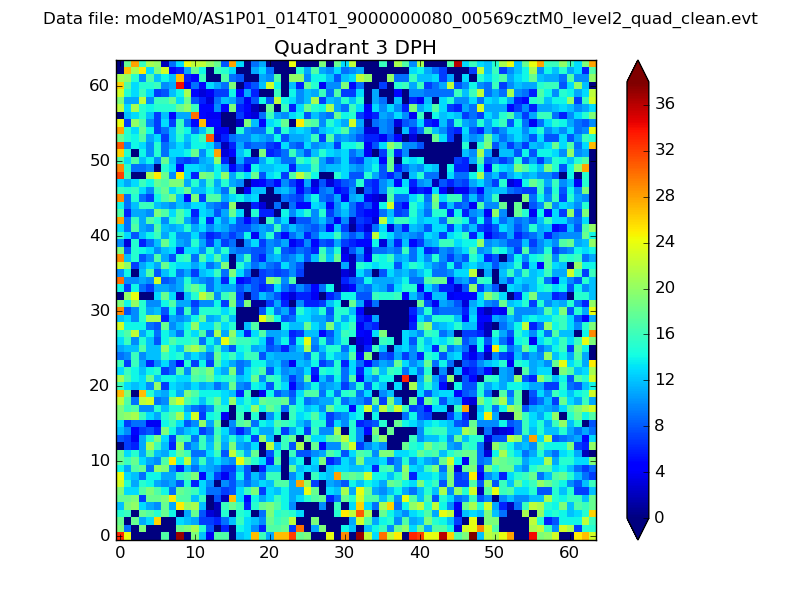 |
 |
Quadrant C |
| Plot type | Count rate plots | Images |
|---|---|---|
| Comparison with Poisson distribution Blue bars denote a histogram of data divided into 1 sec bins. Red curve is a Poisson curve with rate = median count rate of data. |
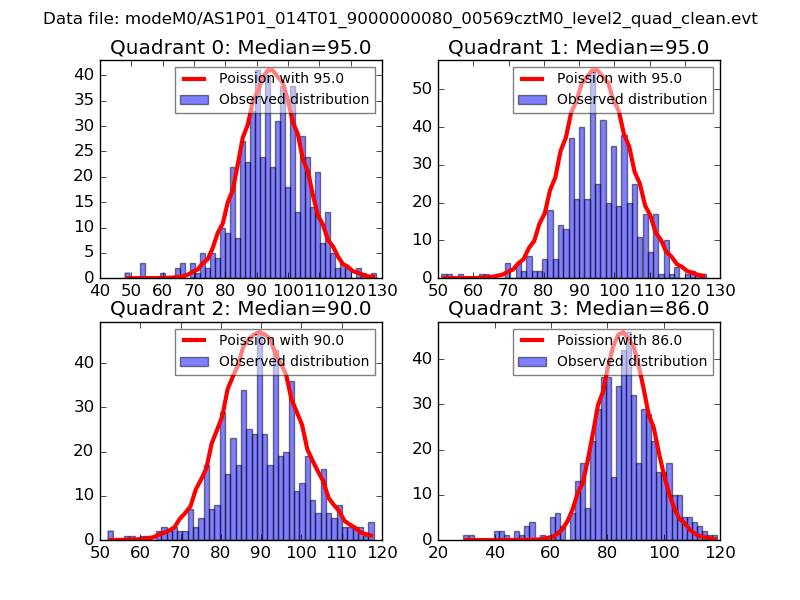 |
 |
| Quadrant-wise count rates Data is divided into 100 sec bins |
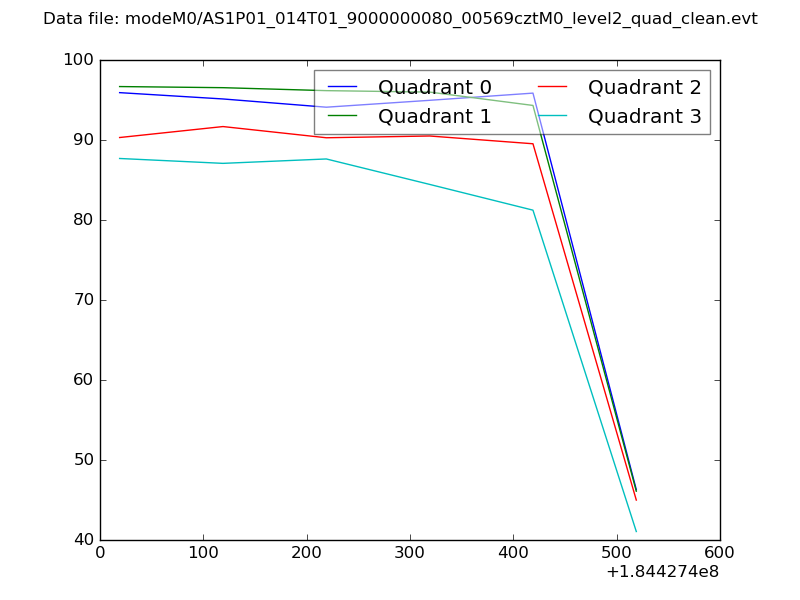 |
|
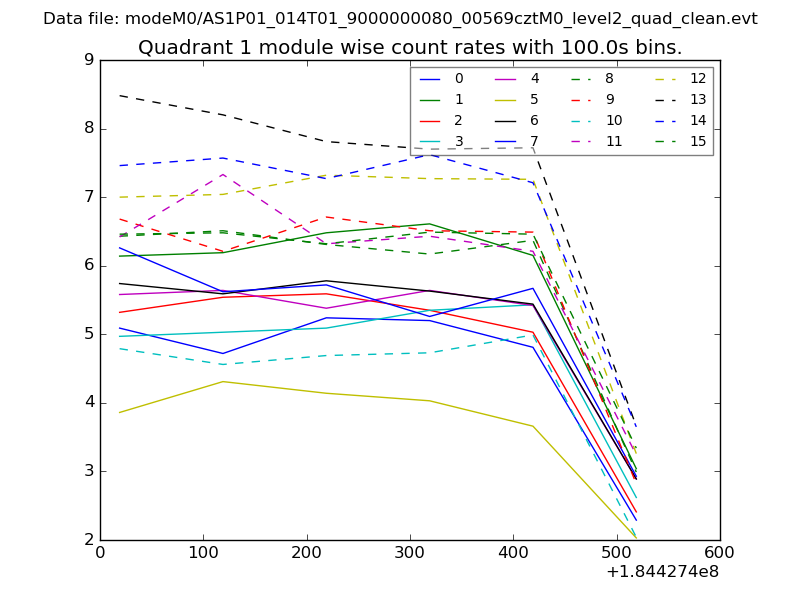
| Module-wise count rates for Quadrant A Data is divided into 100 sec bins |
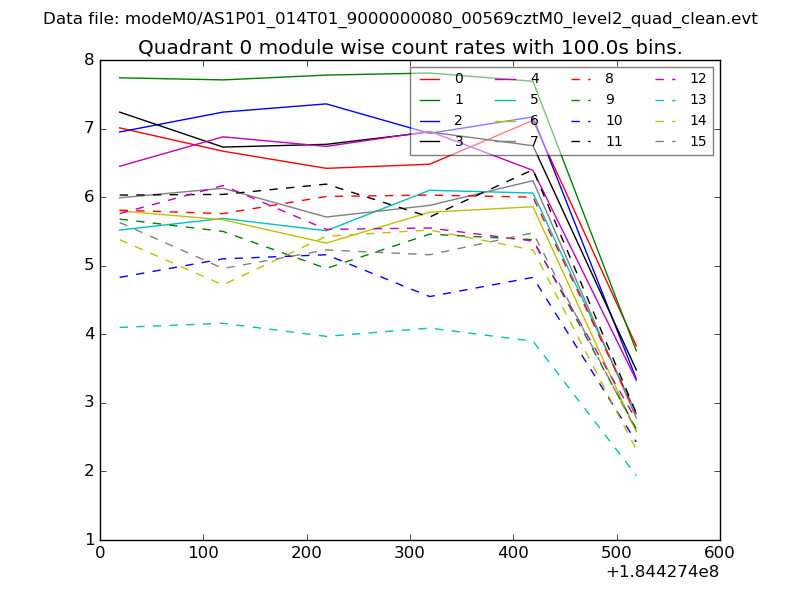 |
 |
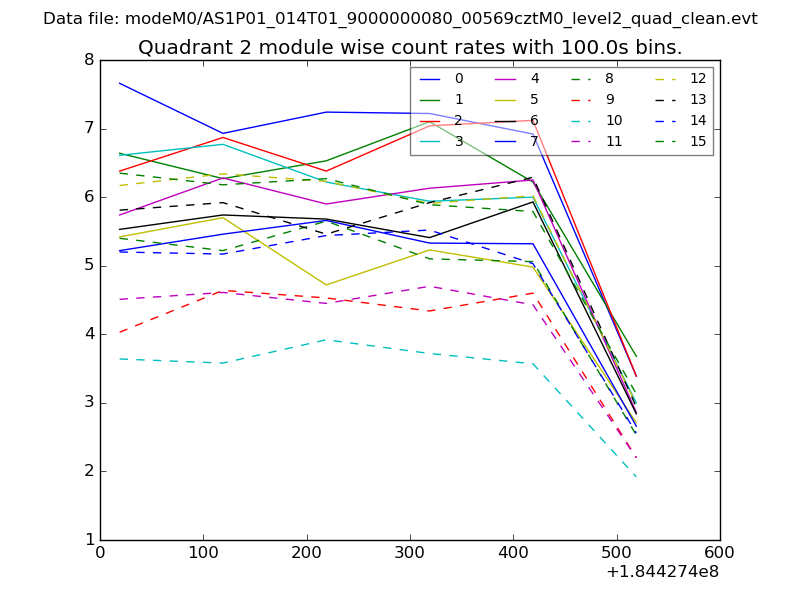
| Module-wise count rates for Quadrant B Data is divided into 100 sec bins |
 |
 |
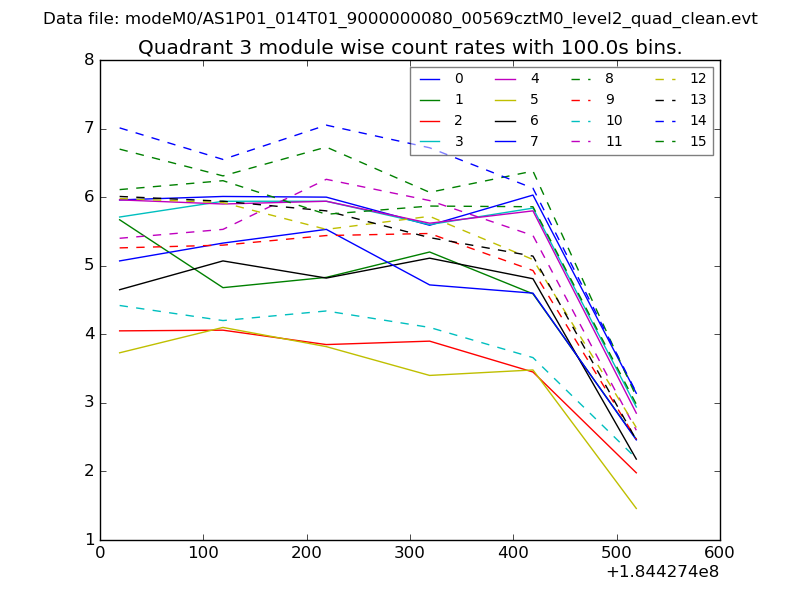
| Module-wise count rates for Quadrant C Data is divided into 100 sec bins |
 |
 |
| Module-wise count rates for Quadrant D Data is divided into 100 sec bins |
 |
 |
| Parameter | Plot |
|---|---|
| CZT HV Monitor | 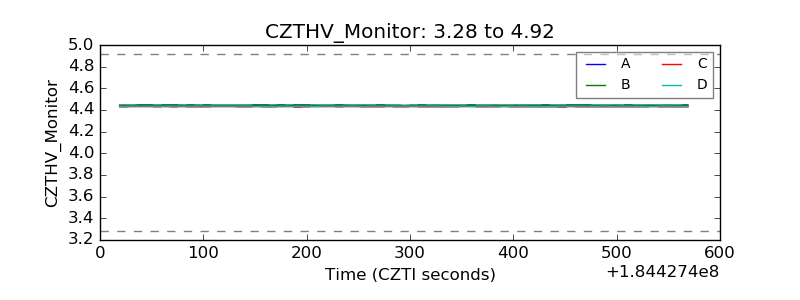 |
| D_VDD | 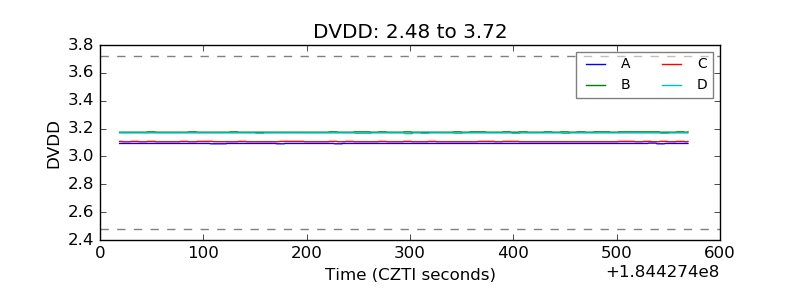 |
| Temperature 1 | 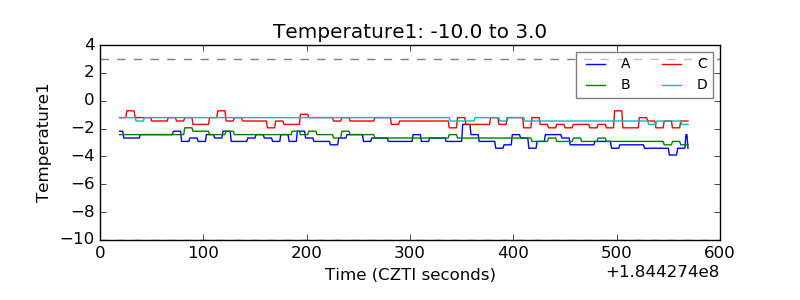 |
| Veto HV Monitor | 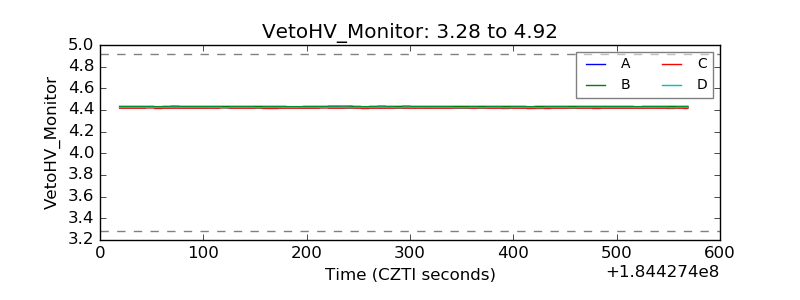 |
| Veto LLD | 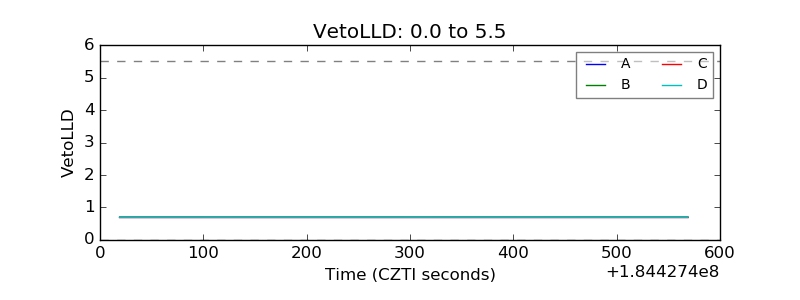 |
| Alpha Counter | 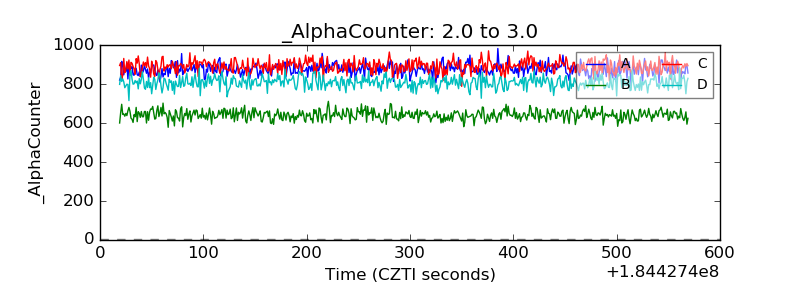 |
| _CPM_Rate | 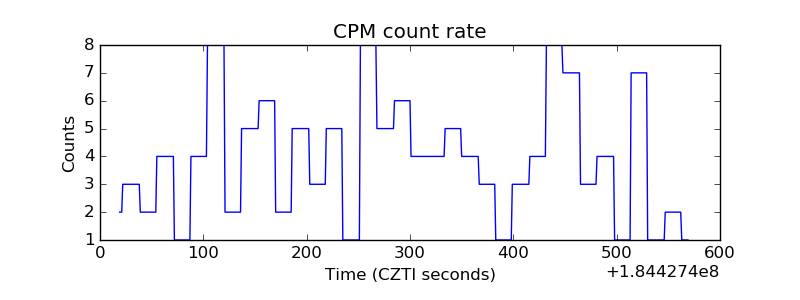 |
| CZT Counter | 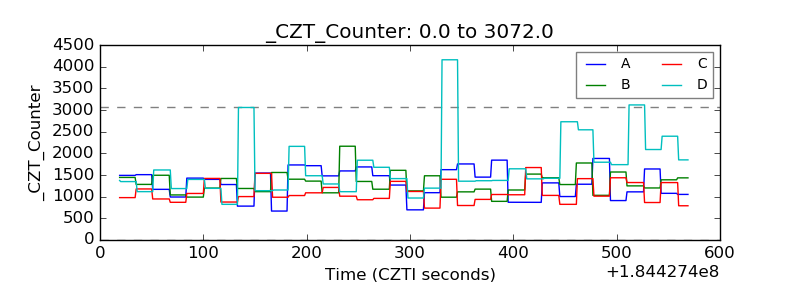 |
| +2.5 Volts monitor |  |
| +5 Volts monitor |  |
| _ROLL_ROT | 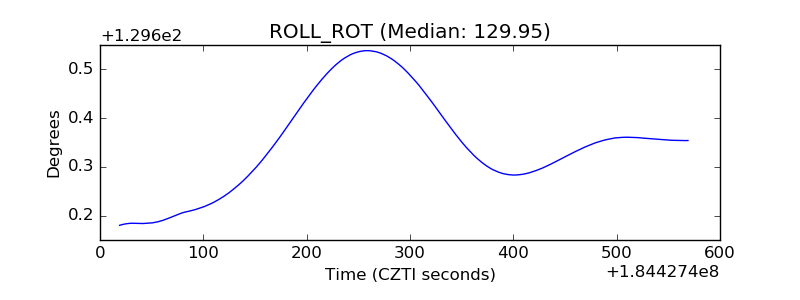 |
| _Roll_DEC | 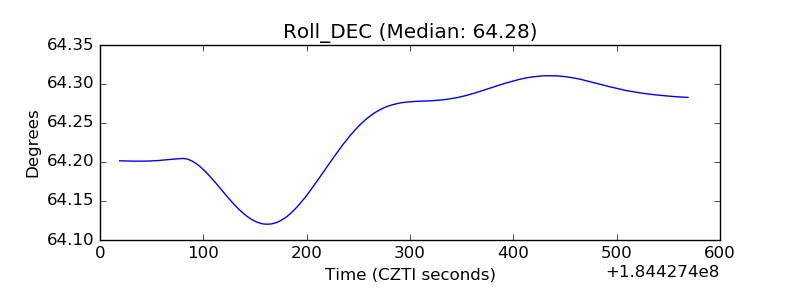 |
| _Roll_RA | 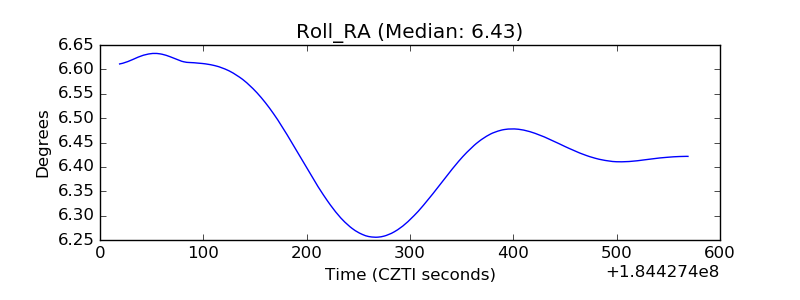 |
| Veto Counter | 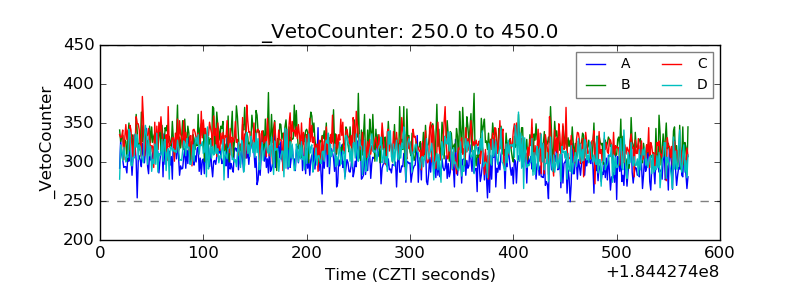 |