| Param | Original file | Final file |
|---|---|---|
| Filename | modeM0/AS1P01_014T01_9000000080_00570cztM0_level2.evt | modeM0/AS1P01_014T01_9000000080_00570cztM0_level2_quad_clean.evt |
| Size (bytes) | 761,420,160 | 66,795,840 |
| Size | 726.1 MB | 63.7 MB |
| Events in quadrant A | 5,650,918 | 430,916 |
| Events in quadrant B | 5,590,049 | 429,097 |
| Events in quadrant C | 5,028,276 | 428,888 |
| Events in quadrant D | 6,483,766 | 409,617 |
| Mode M0 | |||
|---|---|---|---|
| Quadrant | BADHDUFLAG | Total packets | Discarded packets |
| A | 0 | 20037 | 2 |
| B | 0 | 19886 | 1 |
| C | 0 | 18223 | 1 |
| D | 0 | 22525 | 1 |
| Mode M9 | |||
|---|---|---|---|
| Quadrant | BADHDUFLAG | Total packets | Discarded packets |
| A | 0 | 21 | 0 |
| B | 0 | 21 | 0 |
| C | 0 | 21 | 0 |
| D | 0 | 21 | 0 |
| Mode SS | |||
|---|---|---|---|
| Quadrant | BADHDUFLAG | Total packets | Discarded packets |
| A | 0 | 96 | 0 |
| B | 0 | 96 | 0 |
| C | 0 | 96 | 0 |
| D | 0 | 96 | 0 |
| Quadrant | Total seconds | Saturated seconds | Saturation percentage |
|---|---|---|---|
| A | 4605 | 4 | 0.086862% |
| B | 4605 | 15 | 0.325733% |
| C | 4605 | 1 | 0.021716% |
| D | 4605 | 128 | 2.779587% |
Noise dominated data is calculated using 1-second bins in cleaned event files. If a bin has >2000 counts, and if more than 50% of those come from <1% of pixels, then it is considered to be noise-dominated and hence unusable.
| Quadrant | # 1 sec bins | Bins with >0 counts | Bins with >2000 counts | High rate bins dominated by noise | Noise dominated (total time) | Noise dominated (detector-on time) | Marked lightcurve |
|---|---|---|---|---|---|---|---|
| A | 6760 | 4606 | 145 | 145 | 2.14% | 3.15% | 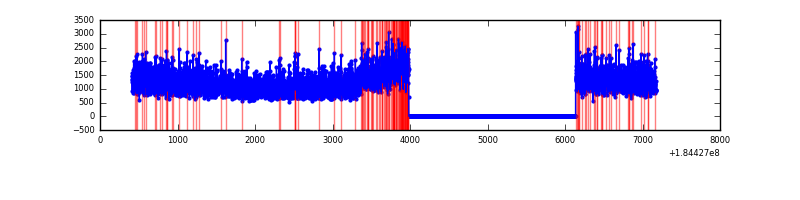 |
| B | 6760 | 4606 | 108 | 108 | 1.60% | 2.34% | 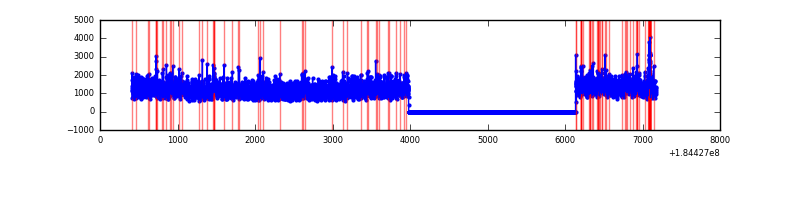 |
| C | 6760 | 4606 | 38 | 38 | 0.56% | 0.83% | 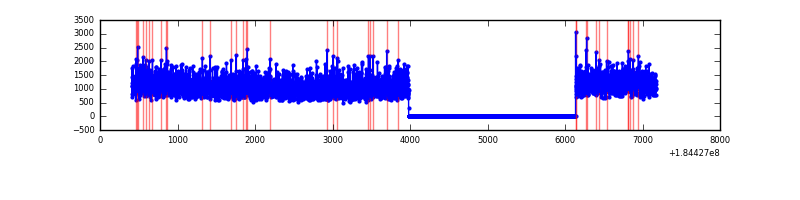 |
| D | 6760 | 4606 | 577 | 577 | 8.54% | 12.53% | 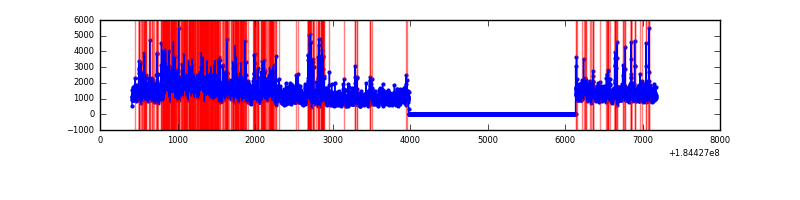 |
Top three noisy pixels from each quadrant. If the there are fewer than three noisy pixels in the level2.evt file, extra rows are filled as -1
| Pixel properties | Quadrant properties | ||||||
|---|---|---|---|---|---|---|---|
| Quadrant | DetID | PixID | Counts | Sigma | Mean | Median | Sigma |
| A | 0 | 149 | 338588 | 1139.89 | 1347 | 1332 | 295.9 |
| A | 0 | 238 | 60521 | 200.05 | 1347 | 1332 | 295.9 |
| A | 0 | 69 | 13076 | 39.69 | 1347 | 1332 | 295.9 |
| B | 4 | 250 | 169762 | 530.18 | 1351 | 1355 | 317.6 |
| B | 8 | 4 | 58247 | 179.11 | 1351 | 1355 | 317.6 |
| B | 4 | 206 | 48872 | 149.59 | 1351 | 1355 | 317.6 |
| C | 0 | 64 | 12218 | 30.55 | 1269 | 1320 | 356.8 |
| C | 5 | 249 | 8914 | 21.28 | 1269 | 1320 | 356.8 |
| C | 15 | 241 | 8639 | 20.51 | 1269 | 1320 | 356.8 |
| D | 13 | 216 | 931725 | 2471.58 | 1198 | 1241 | 376.5 |
| D | 1 | 4 | 378365 | 1001.73 | 1198 | 1241 | 376.5 |
| D | 13 | 221 | 129743 | 341.33 | 1198 | 1241 | 376.5 |
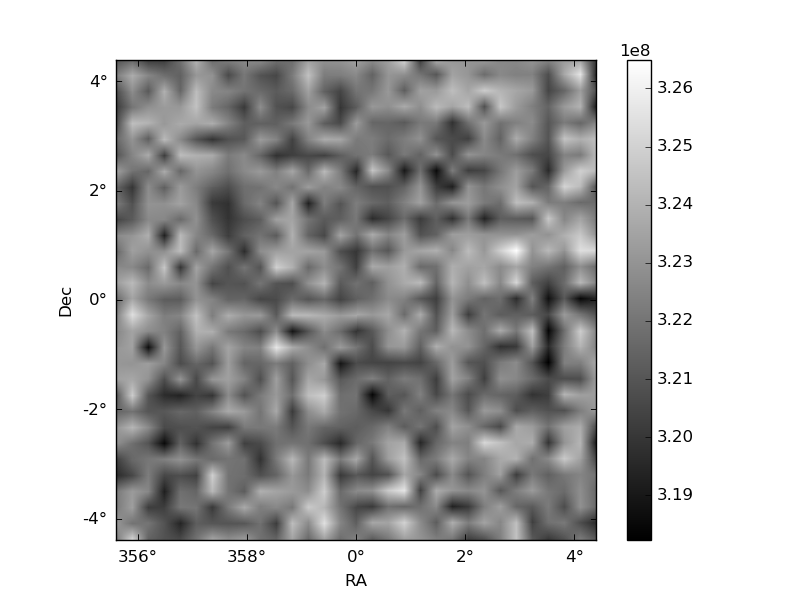
Histogram calculated using DETX and DETY for each event in the final _common_clean file
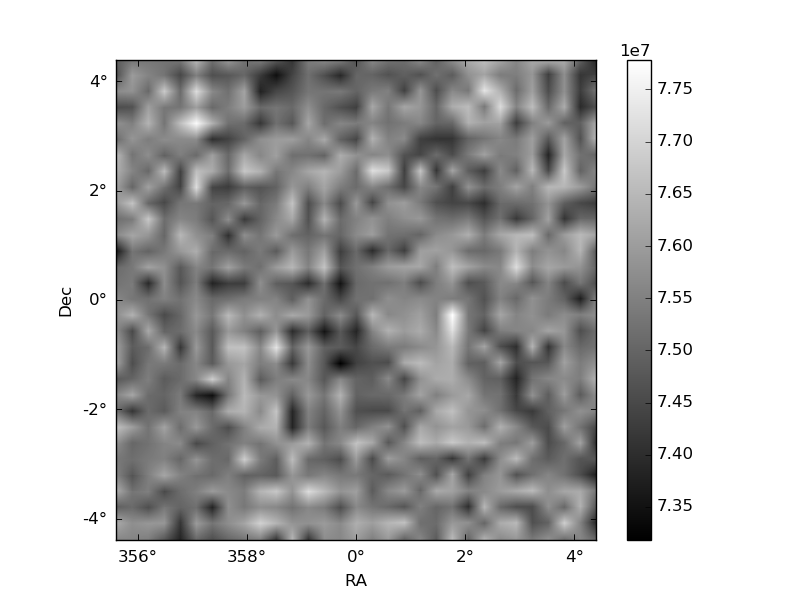
| Quadrant A |  |
 |
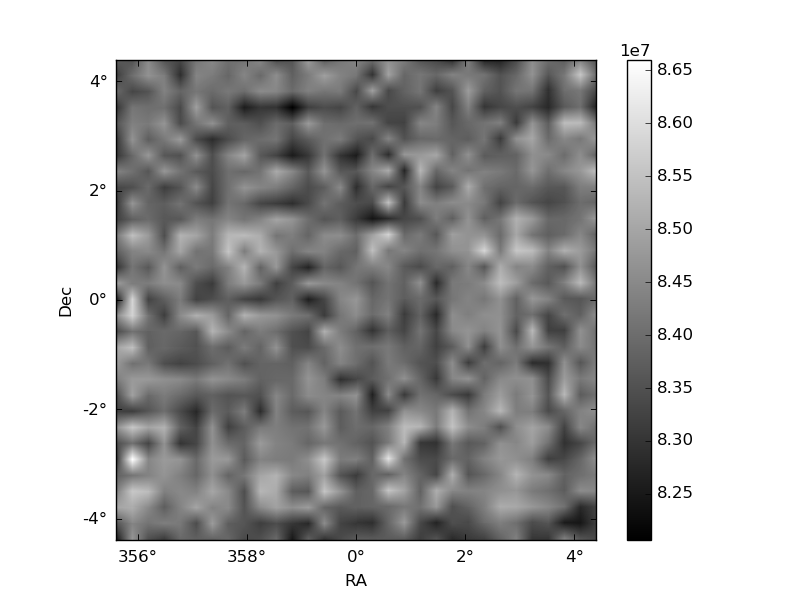
Quadrant B |
|---|---|---|---|
| Quadrant D |  |
 |
Quadrant C |
| Plot type | Count rate plots | Images |
|---|---|---|
| Comparison with Poisson distribution Blue bars denote a histogram of data divided into 1 sec bins. Red curve is a Poisson curve with rate = median count rate of data. |
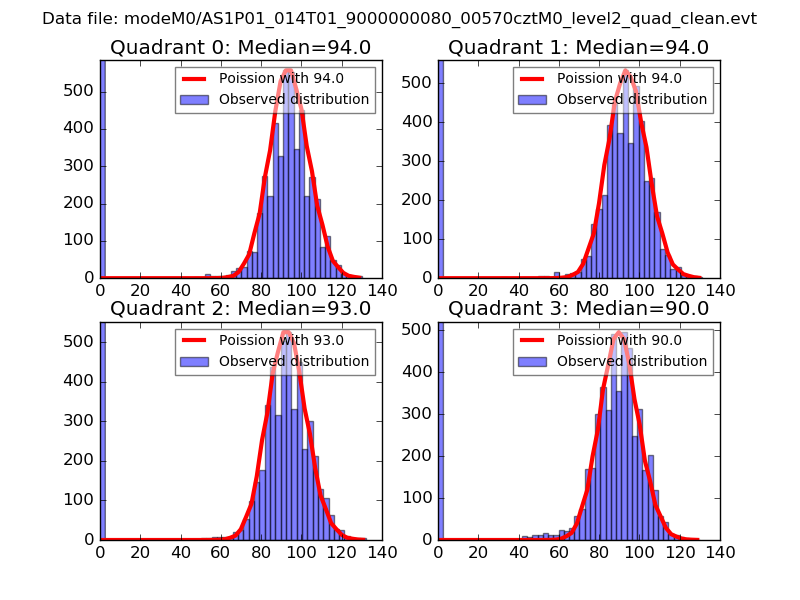 |
 |
| Quadrant-wise count rates Data is divided into 100 sec bins |
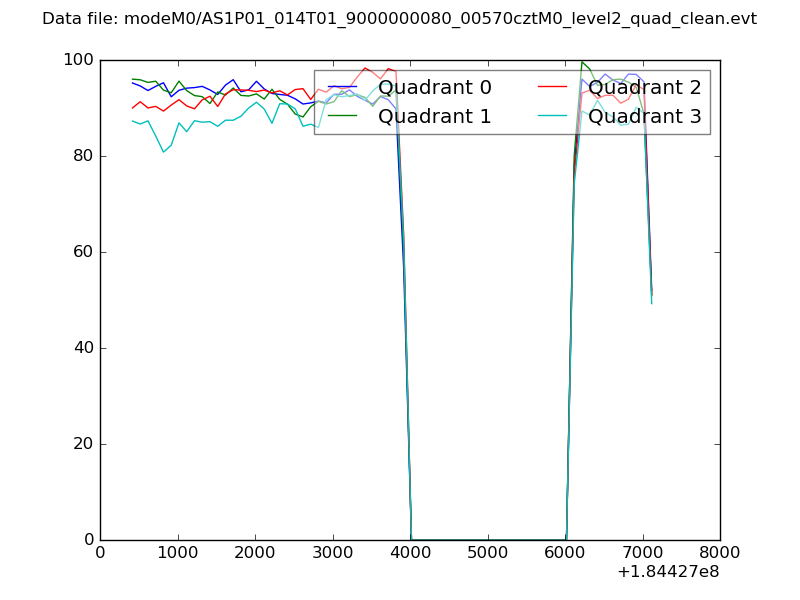 |
|
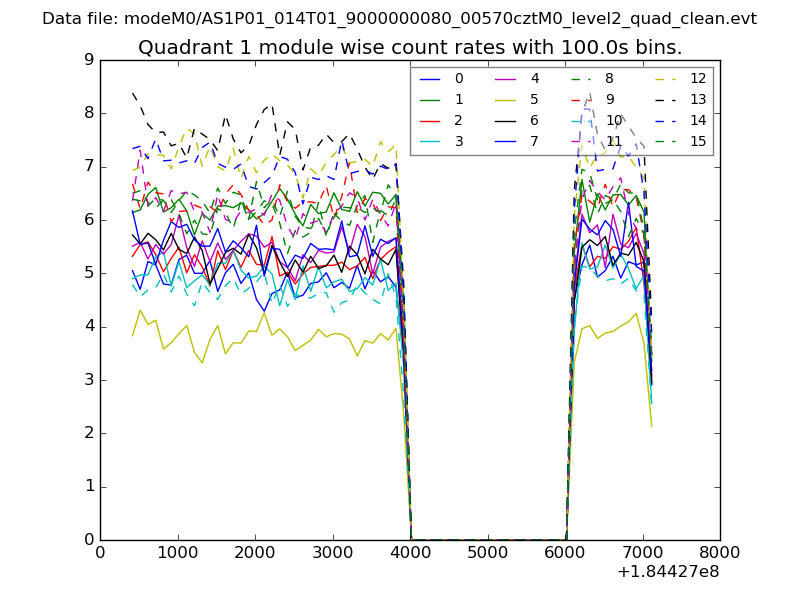
| Module-wise count rates for Quadrant A Data is divided into 100 sec bins |
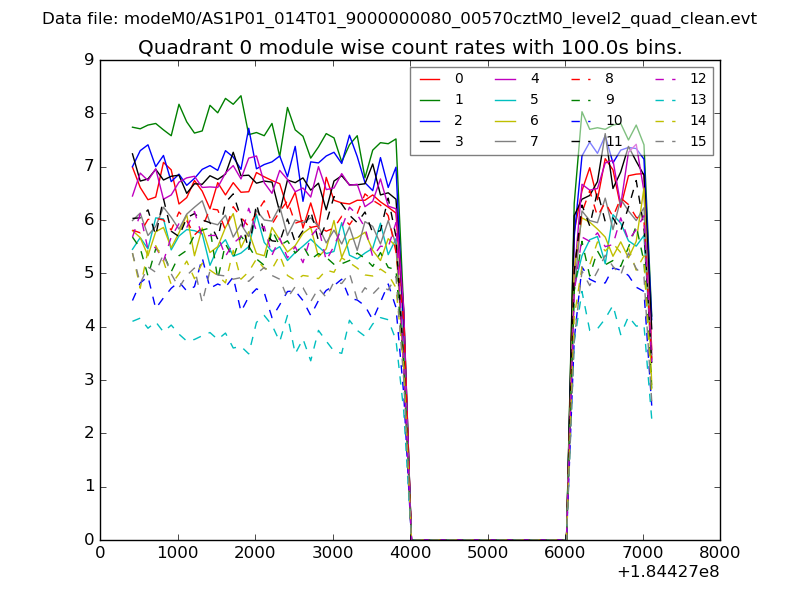 |
 |
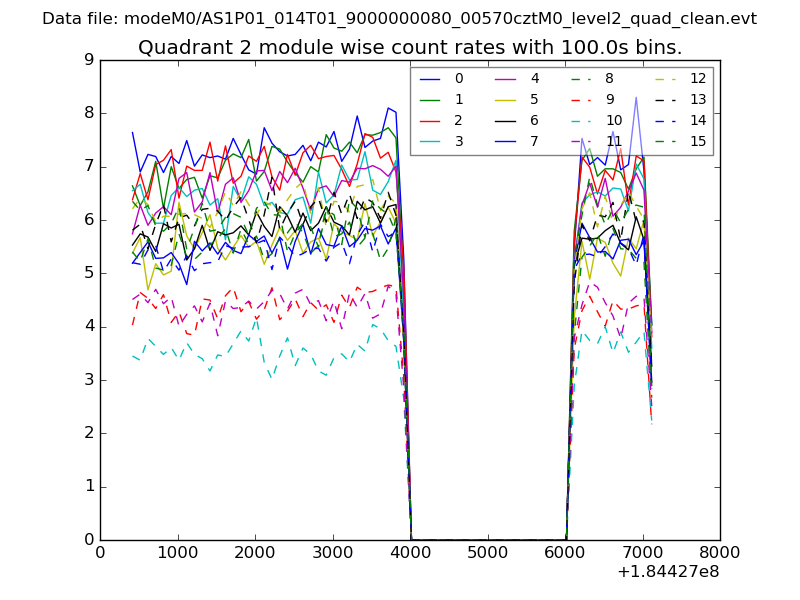
| Module-wise count rates for Quadrant B Data is divided into 100 sec bins |
 |
 |
| Module-wise count rates for Quadrant C Data is divided into 100 sec bins |
 |
 |
| Module-wise count rates for Quadrant D Data is divided into 100 sec bins |
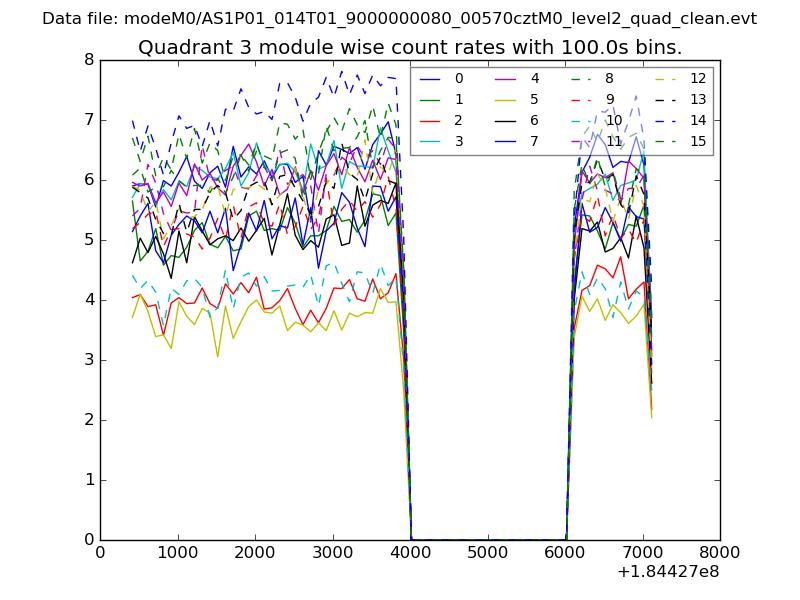 |
 |
| Parameter | Plot |
|---|---|
| CZT HV Monitor | 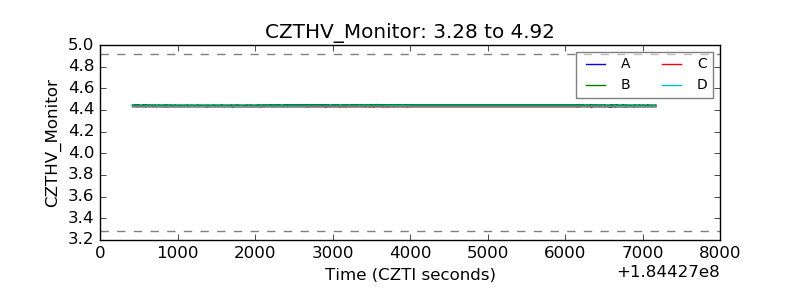 |
| D_VDD | 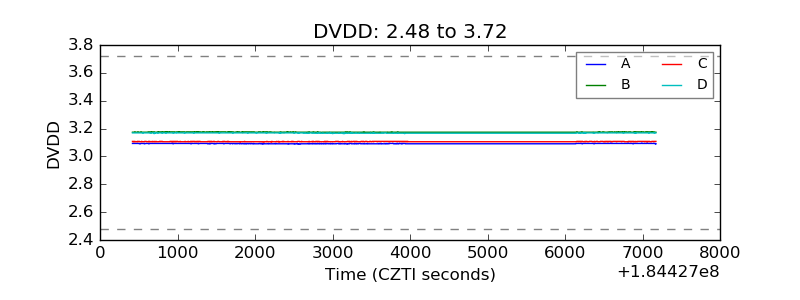 |
| Temperature 1 | 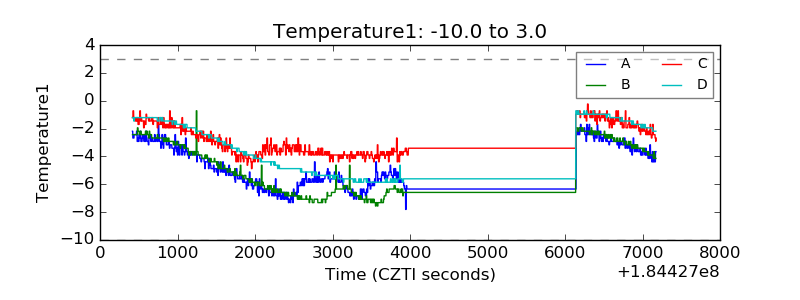 |
| Veto HV Monitor | 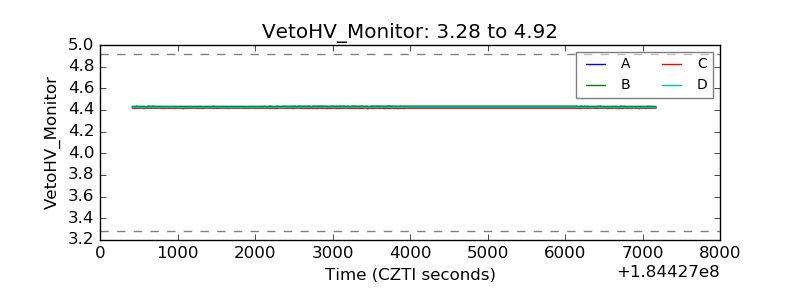 |
| Veto LLD | 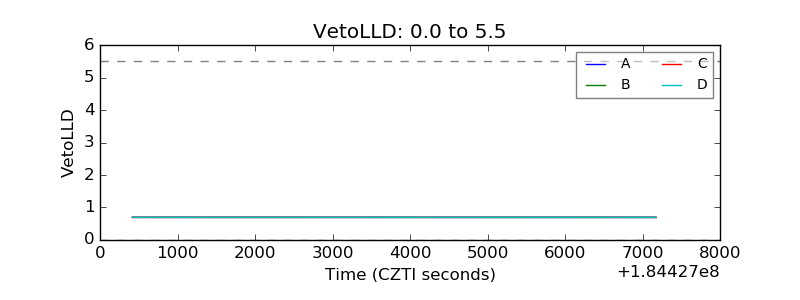 |
| Alpha Counter | 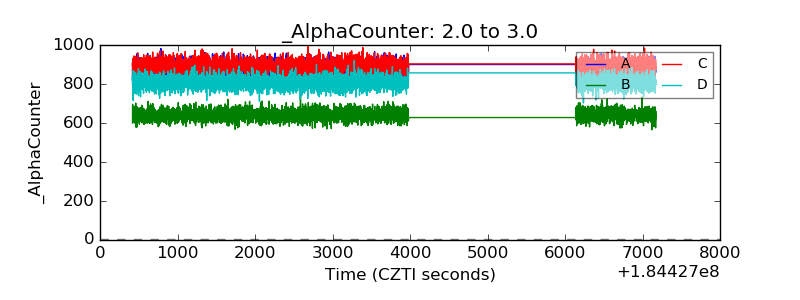 |
| _CPM_Rate | 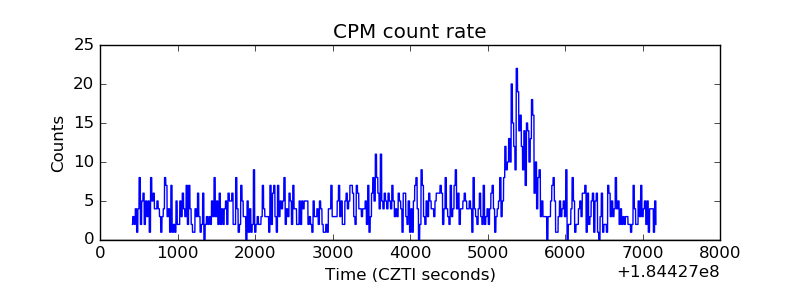 |
| CZT Counter |  |
| +2.5 Volts monitor |  |
| +5 Volts monitor |  |
| _ROLL_ROT | 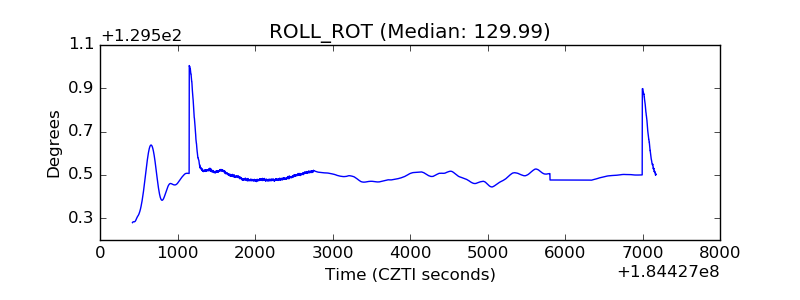 |
| _Roll_DEC | 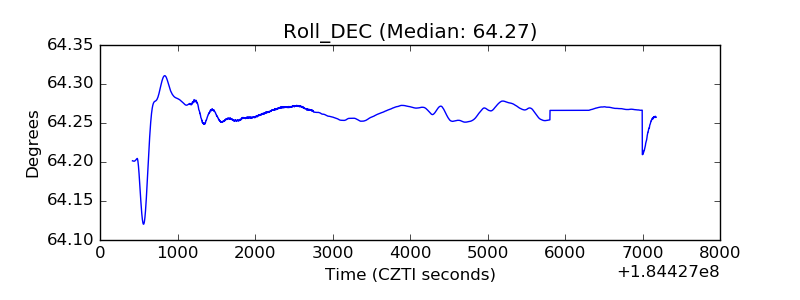 |
| _Roll_RA | 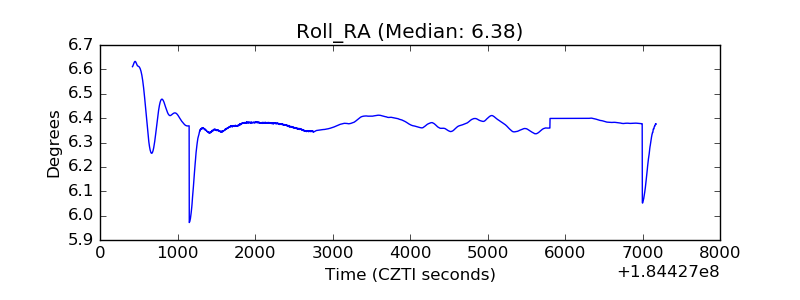 |
| Veto Counter | 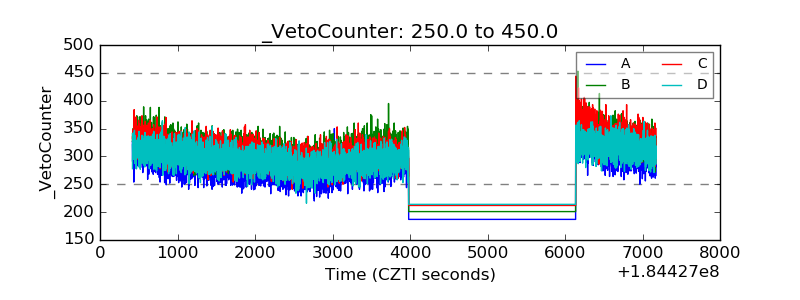 |