| Param | Original file | Final file |
|---|---|---|
| Filename | modeM0/AS1P01_014T01_9000000080_00571cztM0_level2.evt | modeM0/AS1P01_014T01_9000000080_00571cztM0_level2_quad_clean.evt |
| Size (bytes) | 793,491,840 | 71,593,920 |
| Size | 756.7 MB | 68.3 MB |
| Events in quadrant A | 5,854,941 | 462,232 |
| Events in quadrant B | 6,024,259 | 456,696 |
| Events in quadrant C | 5,959,624 | 448,425 |
| Events in quadrant D | 5,856,661 | 447,042 |
| Mode M0 | |||
|---|---|---|---|
| Quadrant | BADHDUFLAG | Total packets | Discarded packets |
| A | 0 | 20994 | 2 |
| B | 0 | 21497 | 1 |
| C | 0 | 21348 | 1 |
| D | 0 | 20983 | 1 |
| Mode M9 | |||
|---|---|---|---|
| Quadrant | BADHDUFLAG | Total packets | Discarded packets |
| A | 0 | 22 | 0 |
| B | 0 | 22 | 0 |
| C | 0 | 22 | 0 |
| D | 0 | 22 | 0 |
| Mode SS | |||
|---|---|---|---|
| Quadrant | BADHDUFLAG | Total packets | Discarded packets |
| A | 0 | 102 | 0 |
| B | 0 | 102 | 0 |
| C | 0 | 102 | 0 |
| D | 0 | 102 | 0 |
| Quadrant | Total seconds | Saturated seconds | Saturation percentage |
|---|---|---|---|
| A | 5043 | 1 | 0.019829% |
| B | 5043 | 15 | 0.297442% |
| C | 5043 | 189 | 3.747769% |
| D | 5043 | 51 | 1.011303% |
Noise dominated data is calculated using 1-second bins in cleaned event files. If a bin has >2000 counts, and if more than 50% of those come from <1% of pixels, then it is considered to be noise-dominated and hence unusable.
| Quadrant | # 1 sec bins | Bins with >0 counts | Bins with >2000 counts | High rate bins dominated by noise | Noise dominated (total time) | Noise dominated (detector-on time) | Marked lightcurve |
|---|---|---|---|---|---|---|---|
| A | 7198 | 5044 | 100 | 100 | 1.39% | 1.98% |  |
| B | 7198 | 5044 | 111 | 111 | 1.54% | 2.20% | 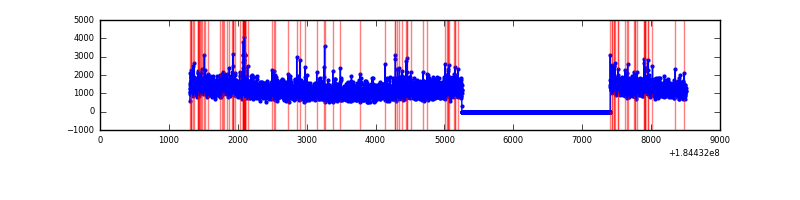 |
| C | 7198 | 5044 | 226 | 226 | 3.14% | 4.48% | 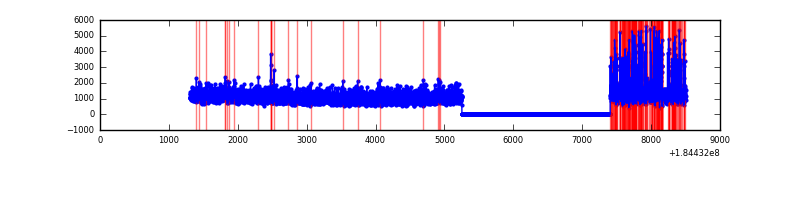 |
| D | 7198 | 5044 | 193 | 193 | 2.68% | 3.83% | 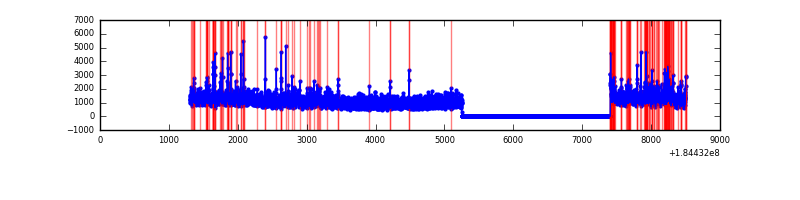 |
Top three noisy pixels from each quadrant. If the there are fewer than three noisy pixels in the level2.evt file, extra rows are filled as -1
| Pixel properties | Quadrant properties | ||||||
|---|---|---|---|---|---|---|---|
| Quadrant | DetID | PixID | Counts | Sigma | Mean | Median | Sigma |
| A | 0 | 149 | 70198 | 210.0 | 1470 | 1454 | 327.3 |
| A | 15 | 171 | 44612 | 131.84 | 1470 | 1454 | 327.3 |
| A | 0 | 238 | 34707 | 101.58 | 1470 | 1454 | 327.3 |
| B | 8 | 4 | 100259 | 279.54 | 1489 | 1491 | 353.3 |
| B | 4 | 250 | 75341 | 209.01 | 1489 | 1491 | 353.3 |
| B | 4 | 206 | 67090 | 185.66 | 1489 | 1491 | 353.3 |
| C | 15 | 241 | 547269 | 1432.13 | 1362 | 1414 | 381.1 |
| C | 3 | 159 | 35612 | 89.72 | 1362 | 1414 | 381.1 |
| C | 7 | 222 | 8119 | 17.59 | 1362 | 1414 | 381.1 |
| D | 1 | 4 | 327092 | 790.08 | 1324 | 1375 | 412.3 |
| D | 13 | 221 | 117526 | 281.74 | 1324 | 1375 | 412.3 |
| D | 13 | 51 | 63005 | 149.49 | 1324 | 1375 | 412.3 |
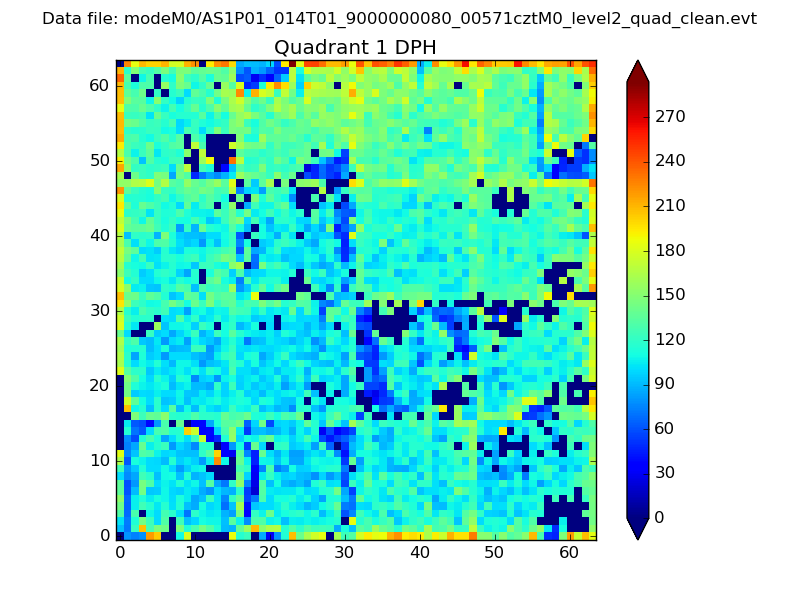
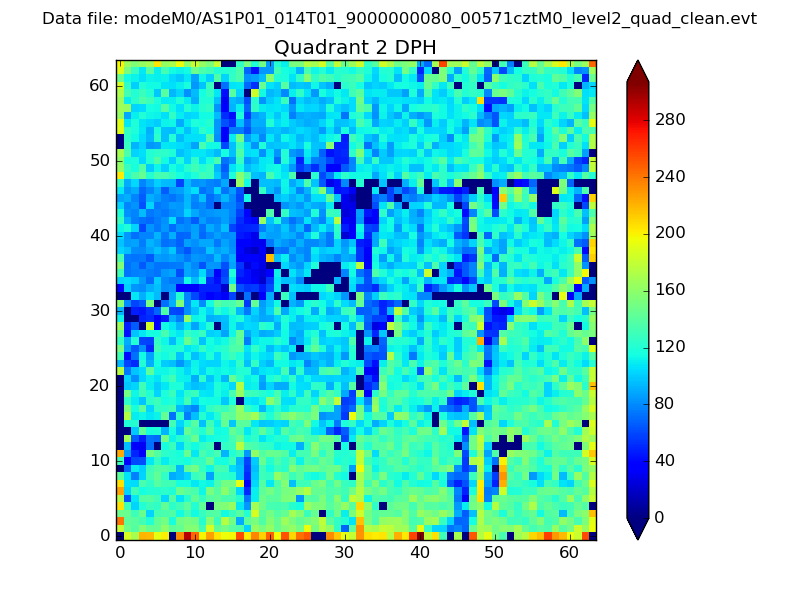
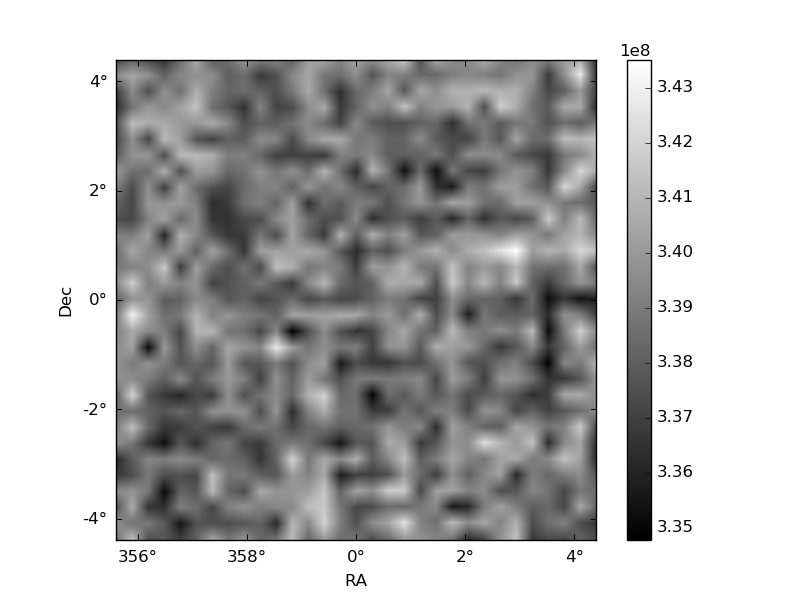
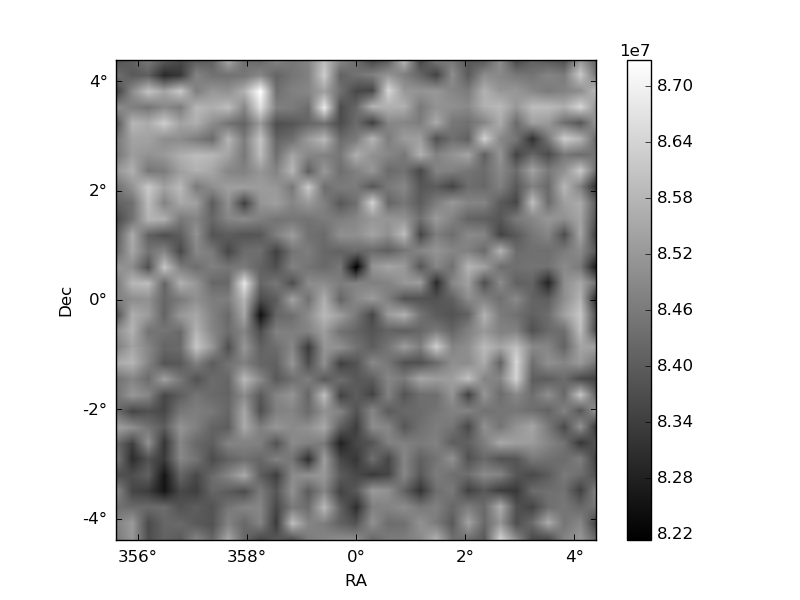
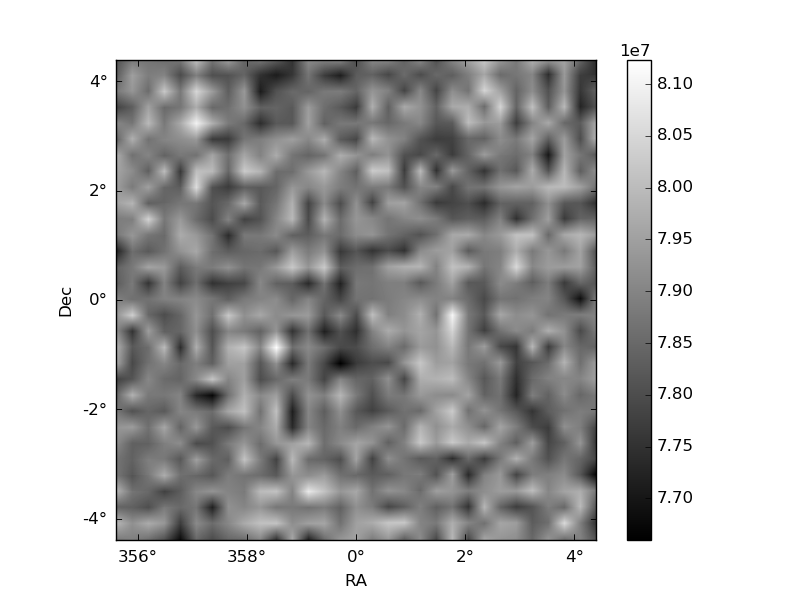
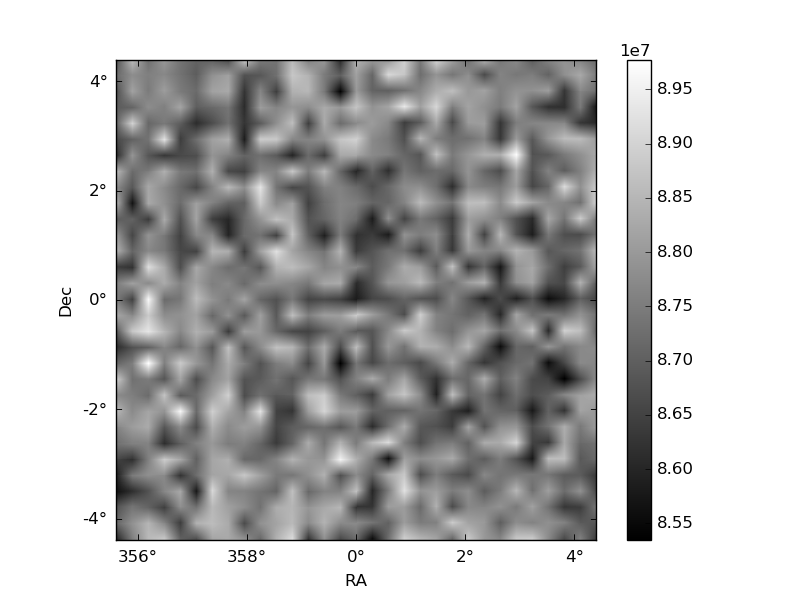
Histogram calculated using DETX and DETY for each event in the final _common_clean file
| Quadrant A | 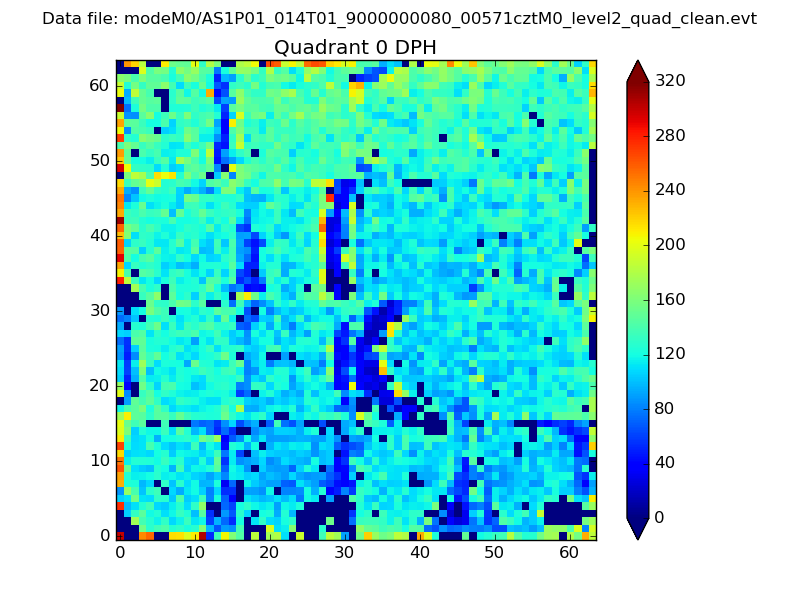 |
 |
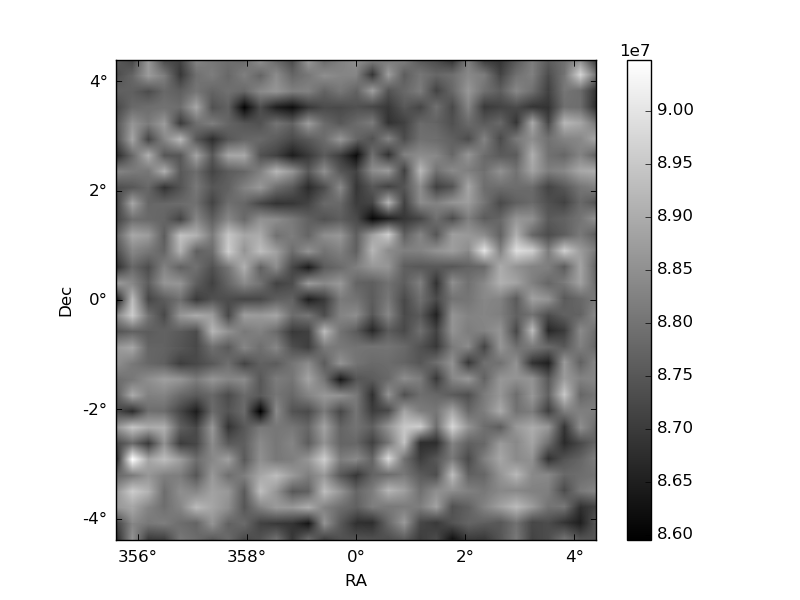
Quadrant B |
|---|---|---|---|
| Quadrant D | 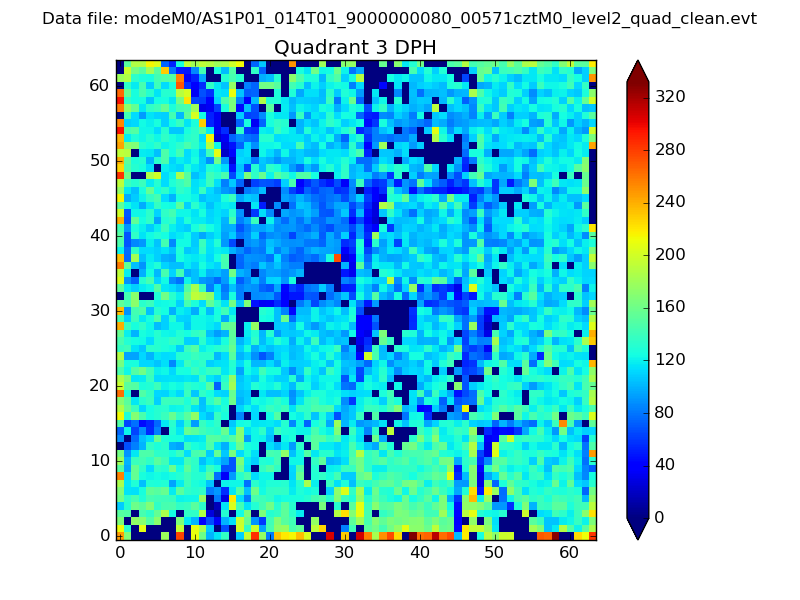 |
 |
Quadrant C |
| Plot type | Count rate plots | Images |
|---|---|---|
| Comparison with Poisson distribution Blue bars denote a histogram of data divided into 1 sec bins. Red curve is a Poisson curve with rate = median count rate of data. |
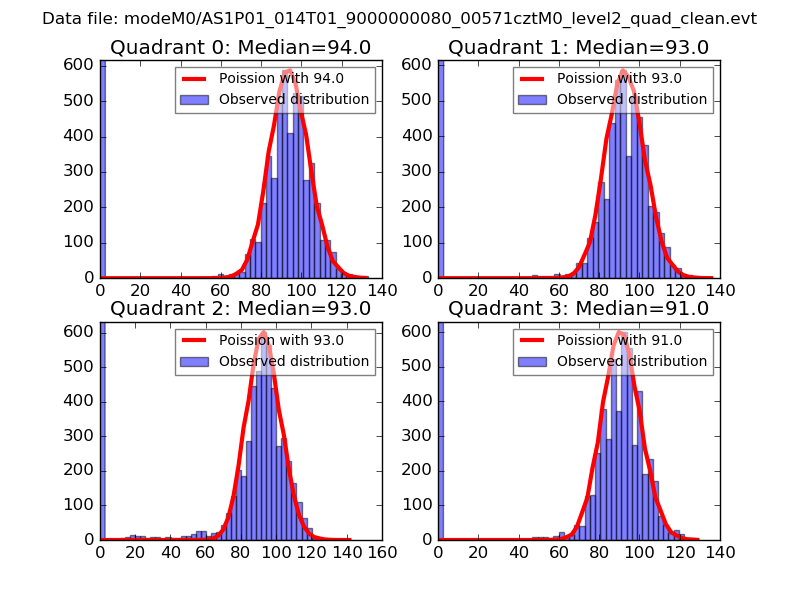 |
 |
| Quadrant-wise count rates Data is divided into 100 sec bins |
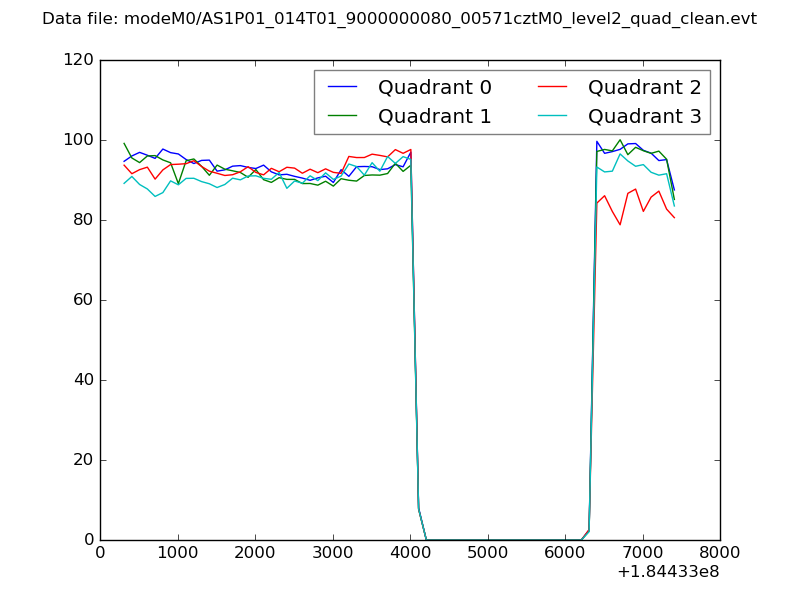 |
|
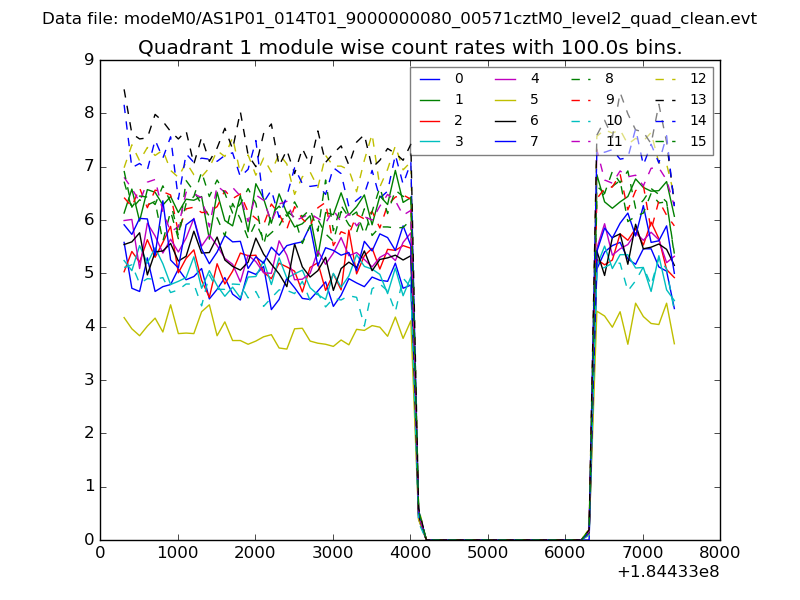
| Module-wise count rates for Quadrant A Data is divided into 100 sec bins |
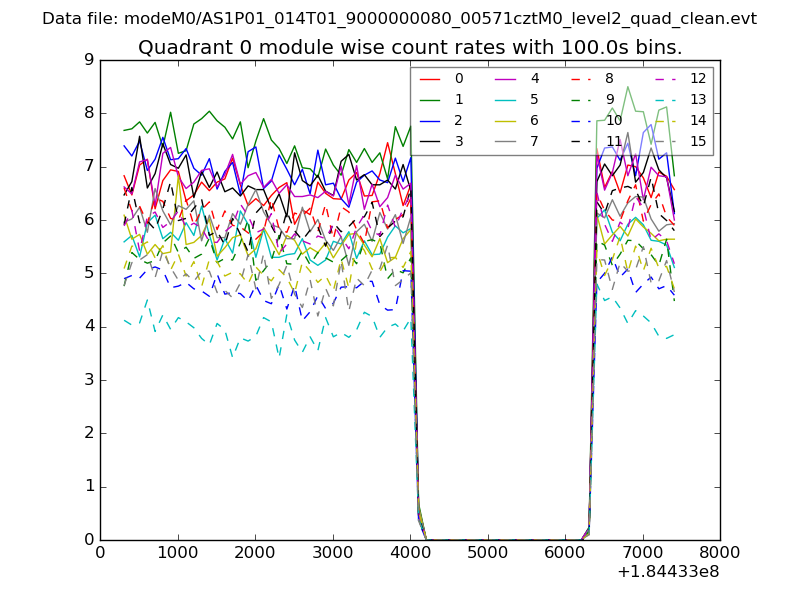 |
 |
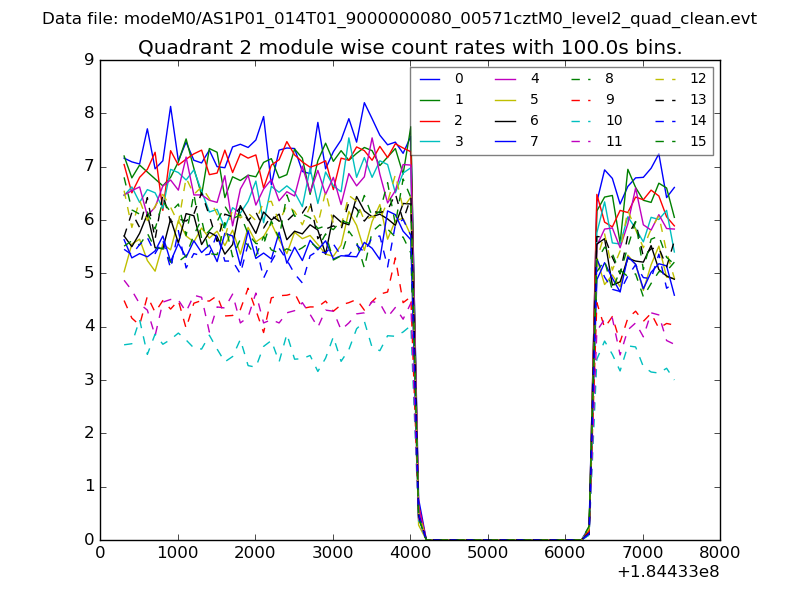
| Module-wise count rates for Quadrant B Data is divided into 100 sec bins |
 |
 |
| Module-wise count rates for Quadrant C Data is divided into 100 sec bins |
 |
 |
| Module-wise count rates for Quadrant D Data is divided into 100 sec bins |
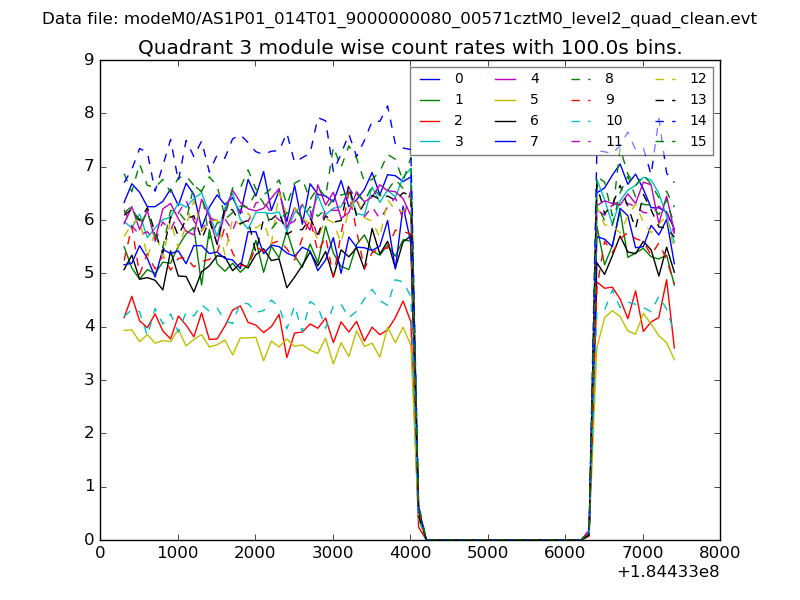 |
 |
| Parameter | Plot |
|---|---|
| CZT HV Monitor | 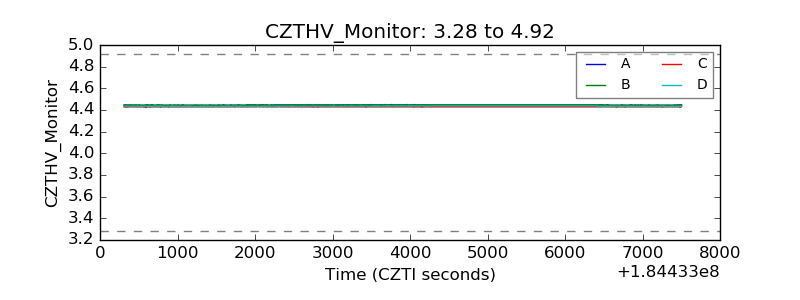 |
| D_VDD |  |
| Temperature 1 | 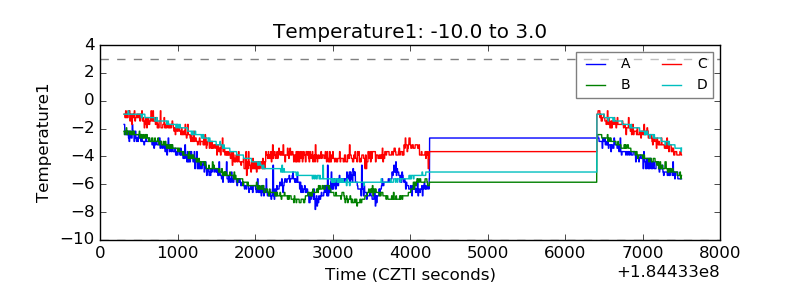 |
| Veto HV Monitor |  |
| Veto LLD | 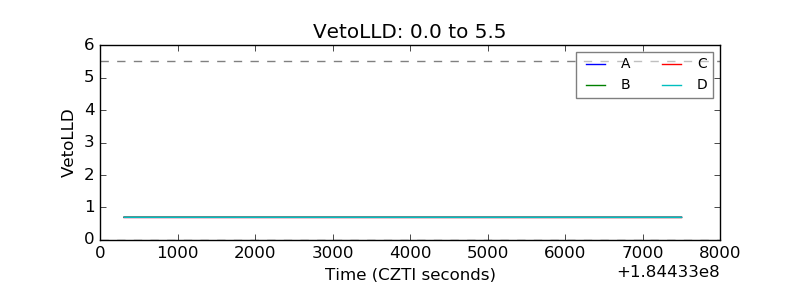 |
| Alpha Counter | 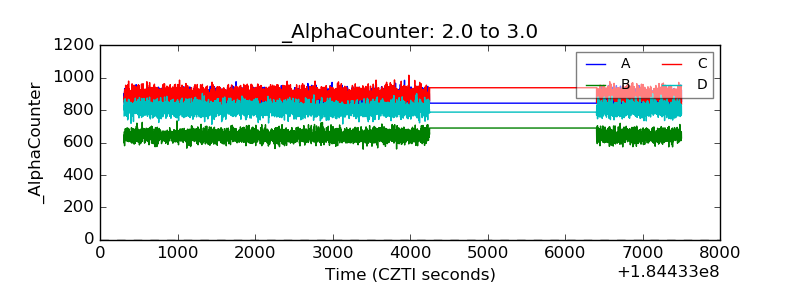 |
| _CPM_Rate | 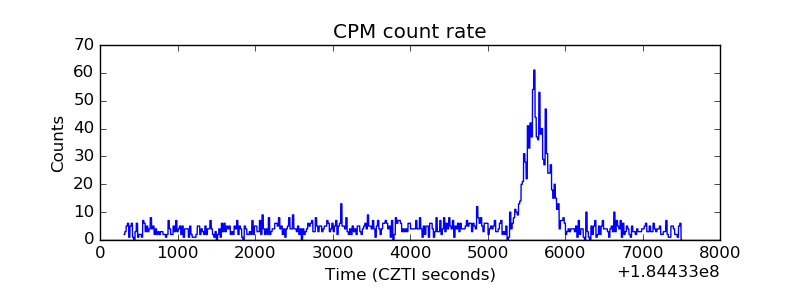 |
| CZT Counter | 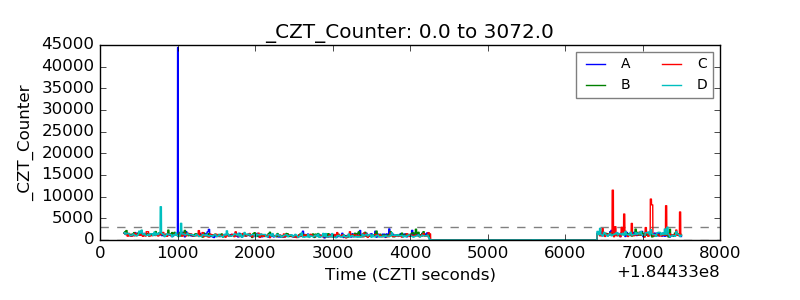 |
| +2.5 Volts monitor |  |
| +5 Volts monitor |  |
| _ROLL_ROT | 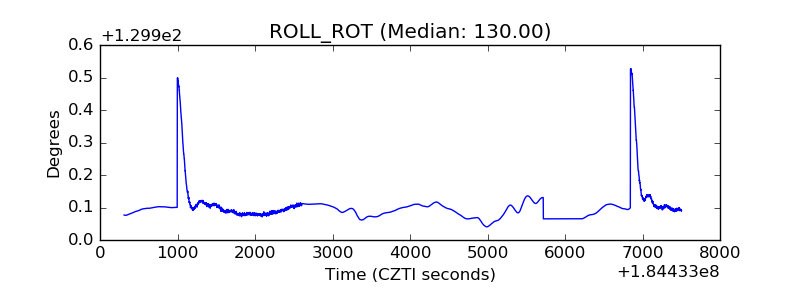 |
| _Roll_DEC | 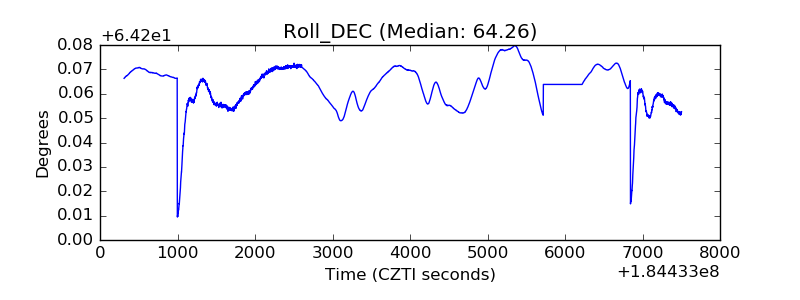 |
| _Roll_RA | 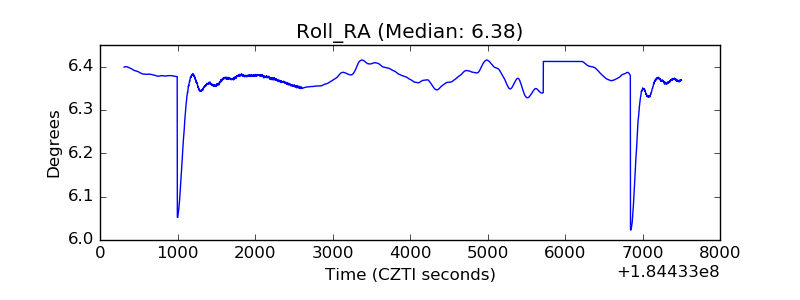 |
| Veto Counter | 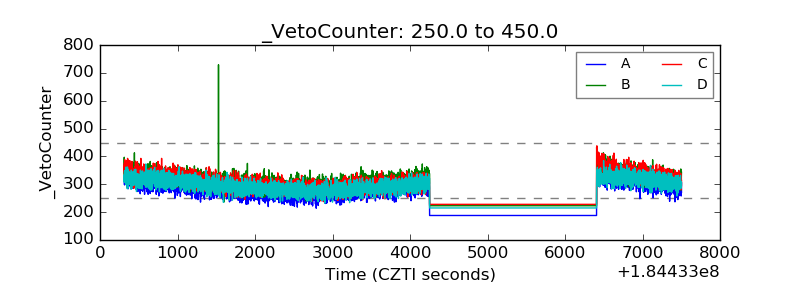 |