| Param | Original file | Final file |
|---|---|---|
| Filename | modeM0/AS1P01_014T01_9000000080_00572cztM0_level2.evt | modeM0/AS1P01_014T01_9000000080_00572cztM0_level2_quad_clean.evt |
| Size (bytes) | 825,264,000 | 69,171,840 |
| Size | 787.0 MB | 66.0 MB |
| Events in quadrant A | 5,922,223 | 444,927 |
| Events in quadrant B | 5,966,132 | 442,417 |
| Events in quadrant C | 6,870,544 | 416,153 |
| Events in quadrant D | 5,896,379 | 434,573 |
| Mode M0 | |||
|---|---|---|---|
| Quadrant | BADHDUFLAG | Total packets | Discarded packets |
| A | 0 | 21210 | 3 |
| B | 0 | 21350 | 2 |
| C | 0 | 24137 | 2 |
| D | 0 | 21189 | 2 |
| Mode M9 | |||
|---|---|---|---|
| Quadrant | BADHDUFLAG | Total packets | Discarded packets |
| A | 0 | 23 | 0 |
| B | 0 | 23 | 0 |
| C | 0 | 23 | 0 |
| D | 0 | 24 | 0 |
| Mode SS | |||
|---|---|---|---|
| Quadrant | BADHDUFLAG | Total packets | Discarded packets |
| A | 0 | 102 | 0 |
| B | 0 | 102 | 0 |
| C | 0 | 102 | 0 |
| D | 0 | 102 | 0 |
| Quadrant | Total seconds | Saturated seconds | Saturation percentage |
|---|---|---|---|
| A | 5086 | 8 | 0.157295% |
| B | 5086 | 4 | 0.078647% |
| C | 5086 | 540 | 10.617381% |
| D | 5086 | 48 | 0.943767% |
Noise dominated data is calculated using 1-second bins in cleaned event files. If a bin has >2000 counts, and if more than 50% of those come from <1% of pixels, then it is considered to be noise-dominated and hence unusable.
| Quadrant | # 1 sec bins | Bins with >0 counts | Bins with >2000 counts | High rate bins dominated by noise | Noise dominated (total time) | Noise dominated (detector-on time) | Marked lightcurve |
|---|---|---|---|---|---|---|---|
| A | 7242 | 5087 | 105 | 105 | 1.45% | 2.06% | 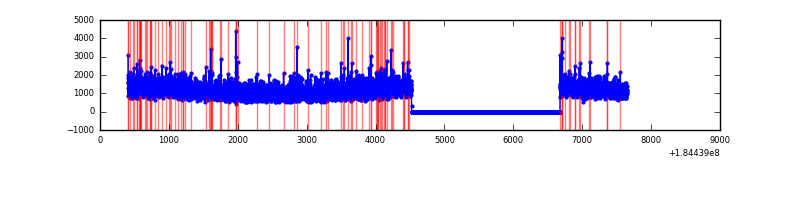 |
| B | 7242 | 5087 | 79 | 79 | 1.09% | 1.55% | 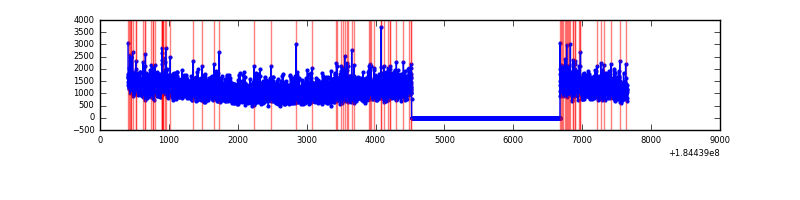 |
| C | 7242 | 5086 | 617 | 617 | 8.52% | 12.13% | 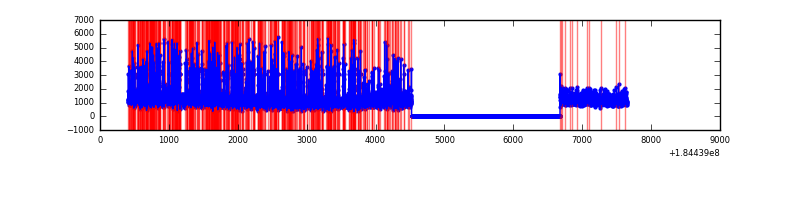 |
| D | 7242 | 5087 | 219 | 219 | 3.02% | 4.31% | 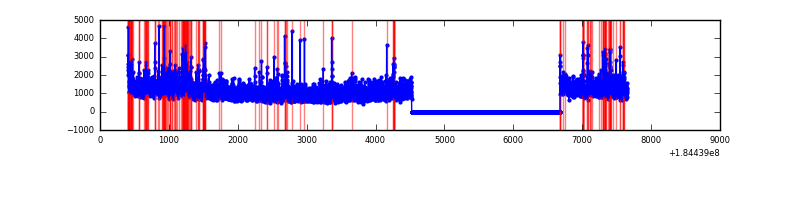 |
Top three noisy pixels from each quadrant. If the there are fewer than three noisy pixels in the level2.evt file, extra rows are filled as -1
| Pixel properties | Quadrant properties | ||||||
|---|---|---|---|---|---|---|---|
| Quadrant | DetID | PixID | Counts | Sigma | Mean | Median | Sigma |
| A | 0 | 149 | 53557 | 155.67 | 1491 | 1470 | 334.6 |
| A | 0 | 69 | 48192 | 139.64 | 1491 | 1470 | 334.6 |
| A | 0 | 238 | 28182 | 79.83 | 1491 | 1470 | 334.6 |
| B | 8 | 4 | 71026 | 197.2 | 1509 | 1511 | 352.5 |
| B | 0 | 220 | 46481 | 127.57 | 1509 | 1511 | 352.5 |
| B | 4 | 206 | 27521 | 73.78 | 1509 | 1511 | 352.5 |
| C | 15 | 241 | 1616456 | 4370.35 | 1321 | 1373 | 369.6 |
| C | 3 | 159 | 36615 | 95.36 | 1321 | 1373 | 369.6 |
| C | 5 | 249 | 14251 | 34.85 | 1321 | 1373 | 369.6 |
| D | 1 | 4 | 369178 | 890.93 | 1329 | 1381 | 412.8 |
| D | 13 | 221 | 159497 | 383.01 | 1329 | 1381 | 412.8 |
| D | 13 | 216 | 46957 | 110.4 | 1329 | 1381 | 412.8 |
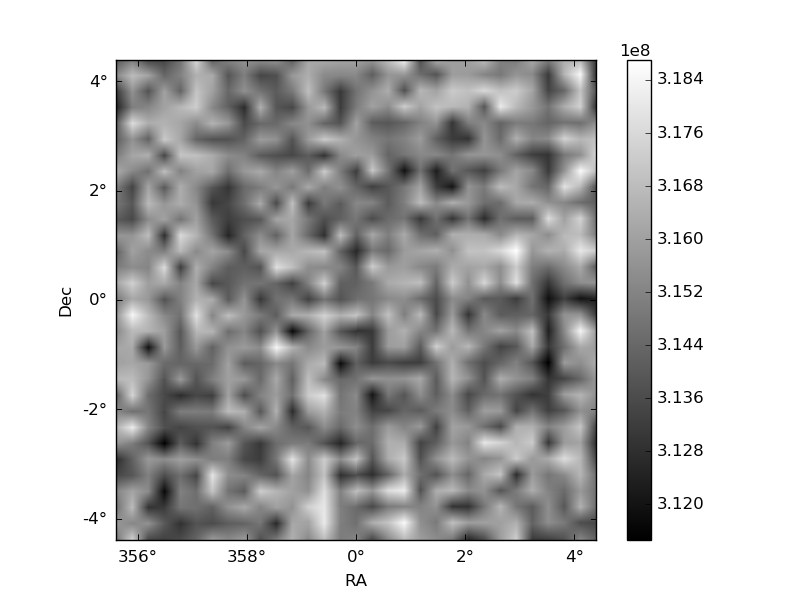
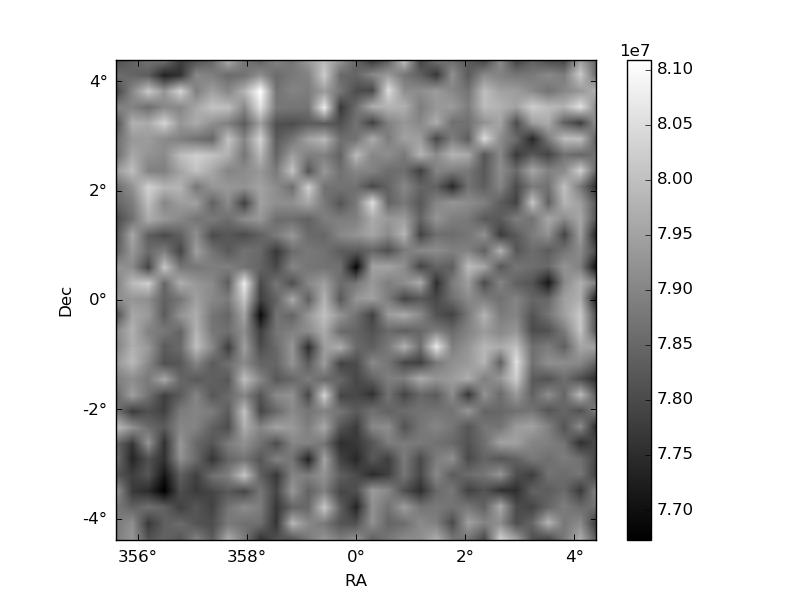
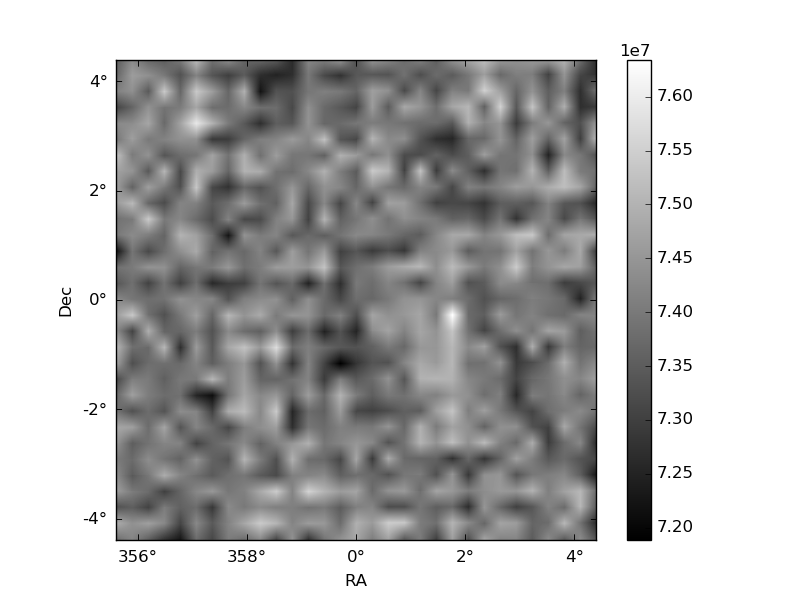
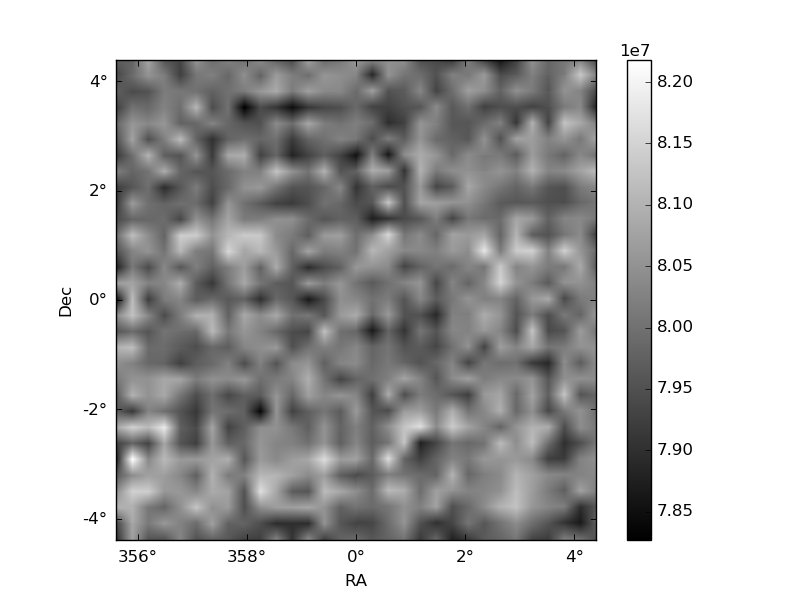
Histogram calculated using DETX and DETY for each event in the final _common_clean file
| Quadrant A | 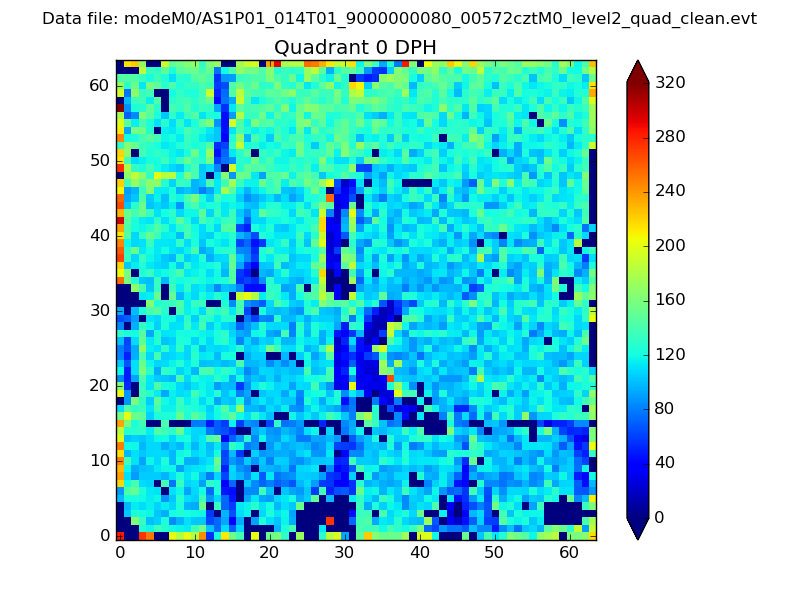 |
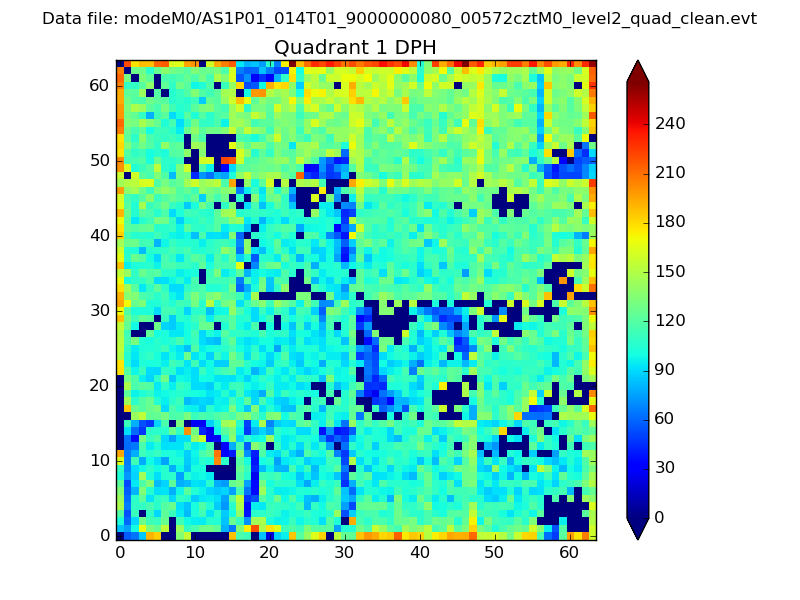 |
Quadrant B |
|---|---|---|---|
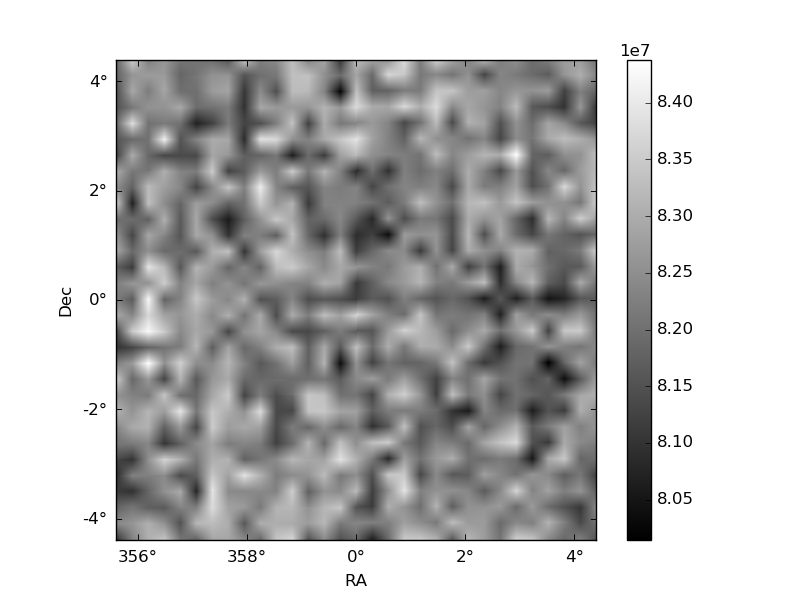
| Quadrant D | 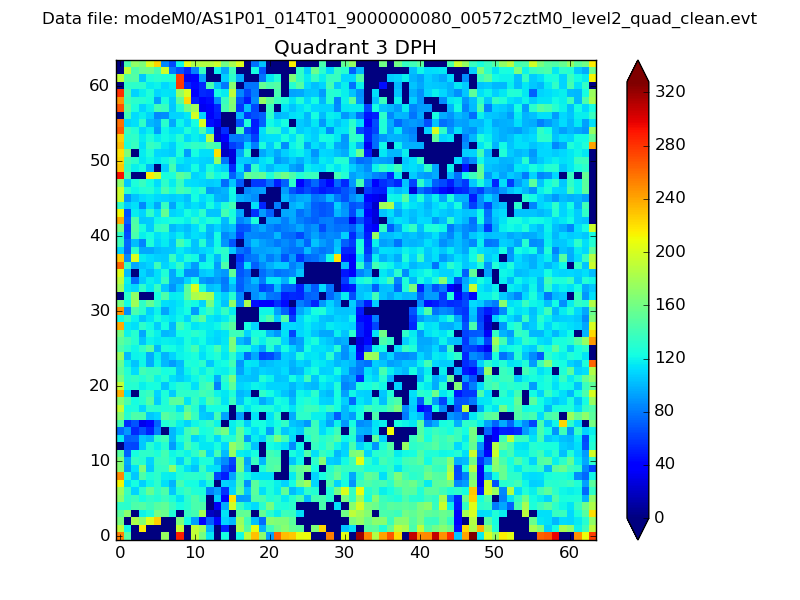 |
 |
Quadrant C |
| Plot type | Count rate plots | Images |
|---|---|---|
| Comparison with Poisson distribution Blue bars denote a histogram of data divided into 1 sec bins. Red curve is a Poisson curve with rate = median count rate of data. |
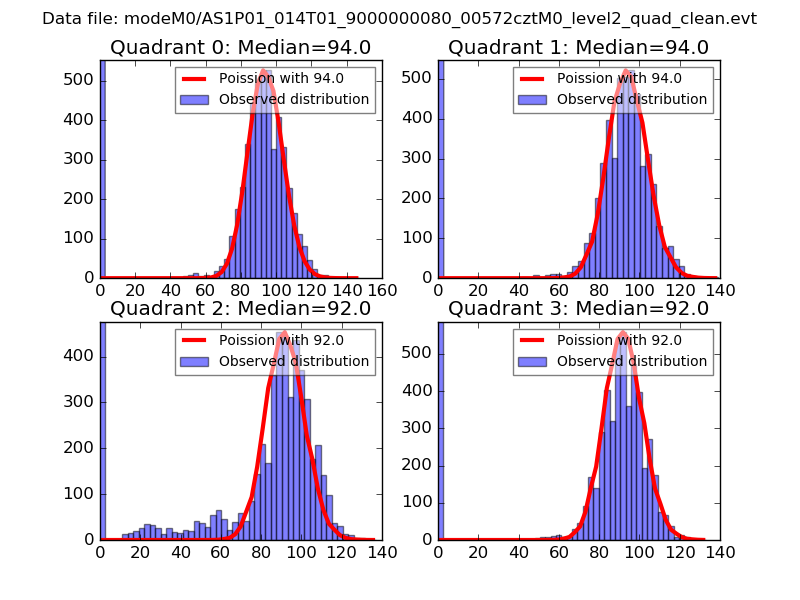 |
 |
| Quadrant-wise count rates Data is divided into 100 sec bins |
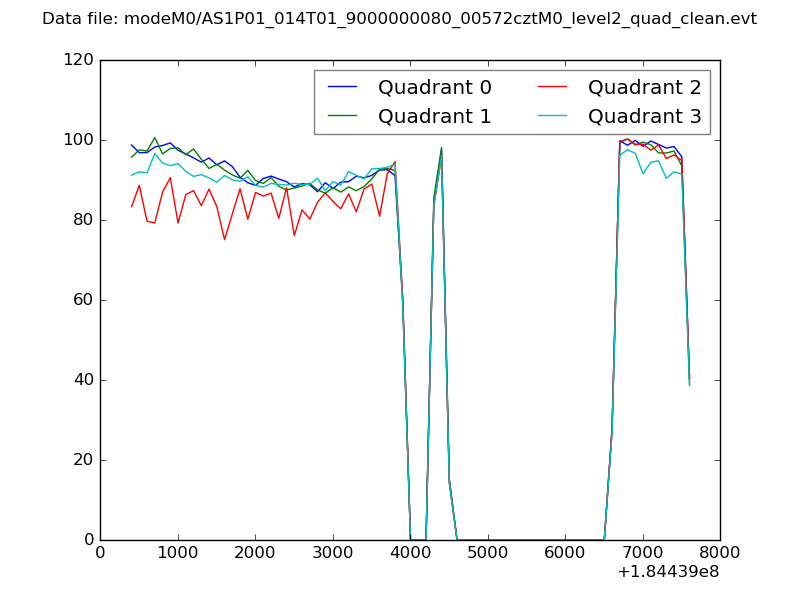 |
|
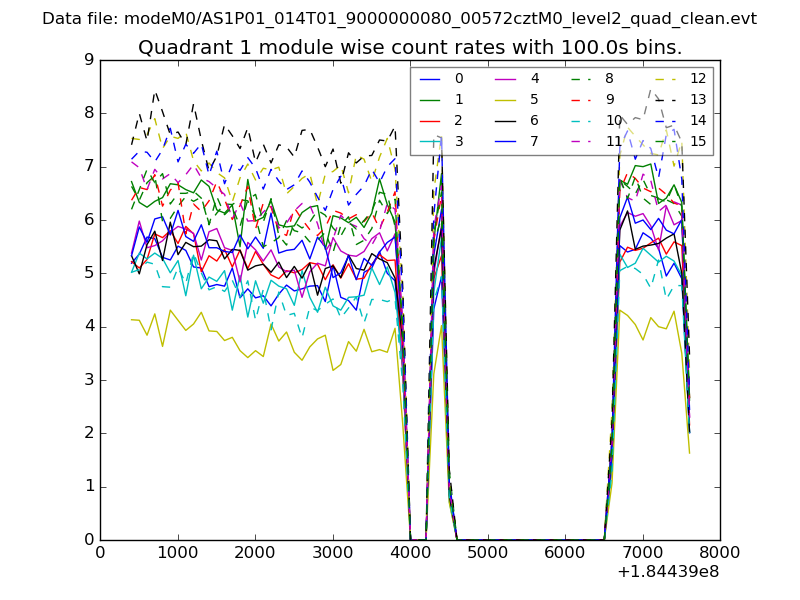
| Module-wise count rates for Quadrant A Data is divided into 100 sec bins |
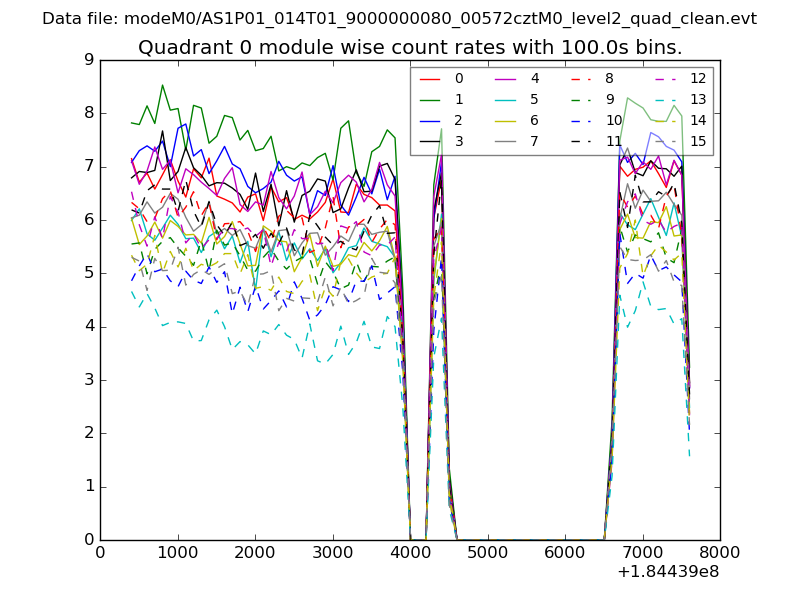 |
 |
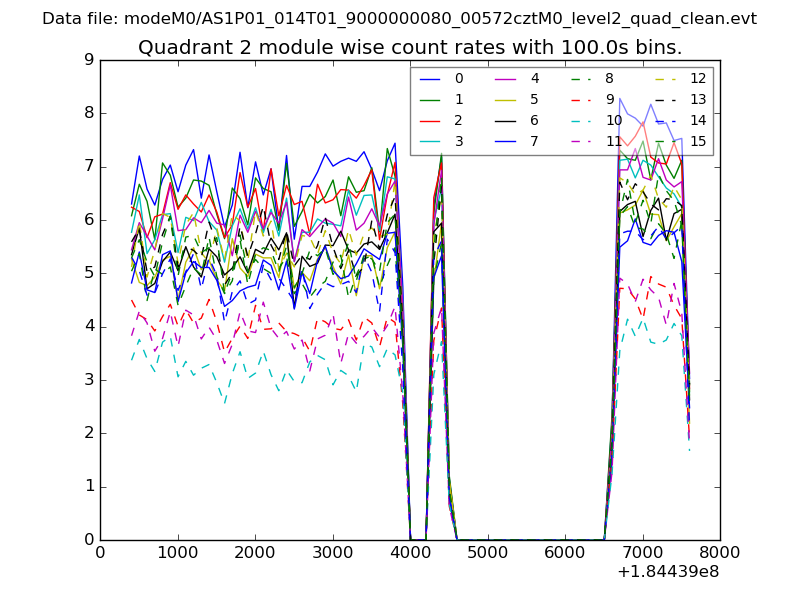
| Module-wise count rates for Quadrant B Data is divided into 100 sec bins |
 |
 |
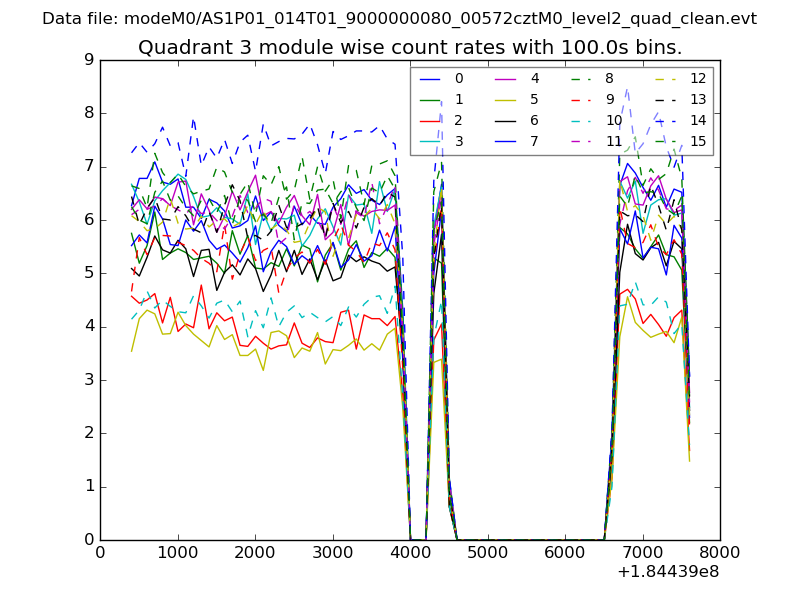
| Module-wise count rates for Quadrant C Data is divided into 100 sec bins |
 |
 |
| Module-wise count rates for Quadrant D Data is divided into 100 sec bins |
 |
 |
| Parameter | Plot |
|---|---|
| CZT HV Monitor | 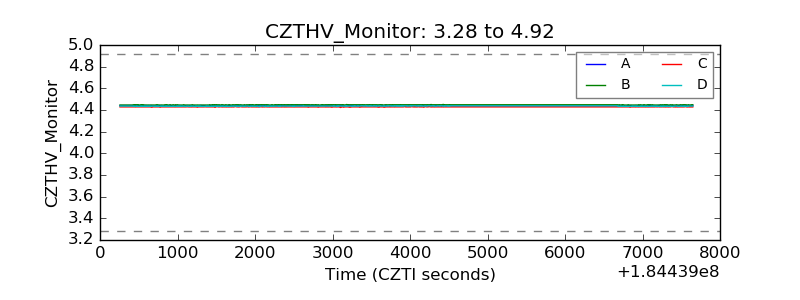 |
| D_VDD | 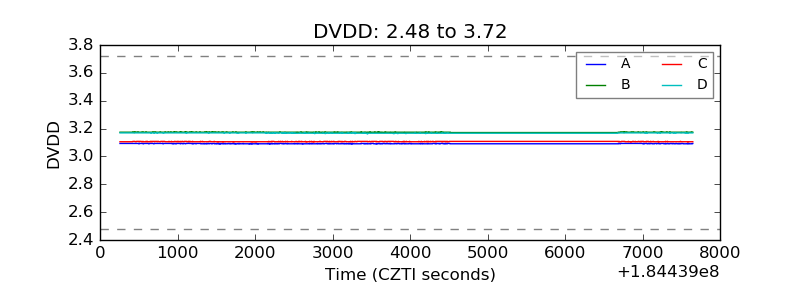 |
| Temperature 1 | 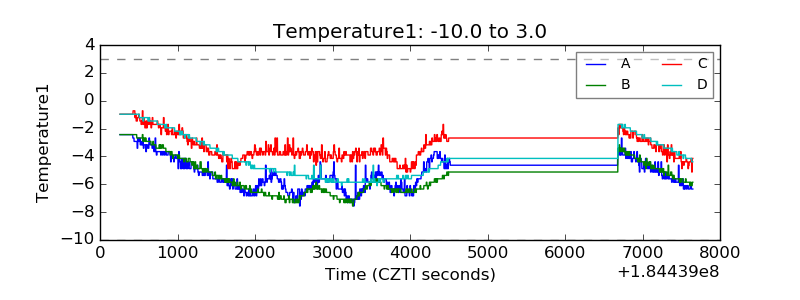 |
| Veto HV Monitor | 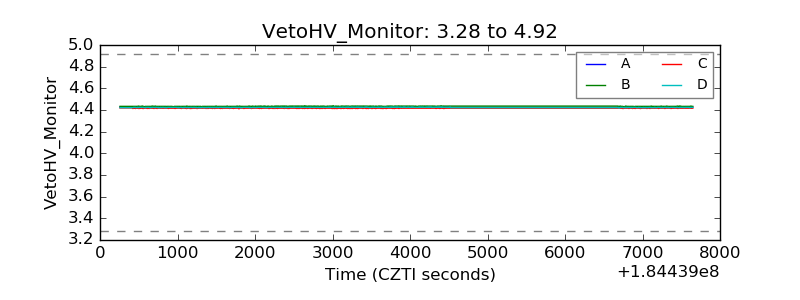 |
| Veto LLD | 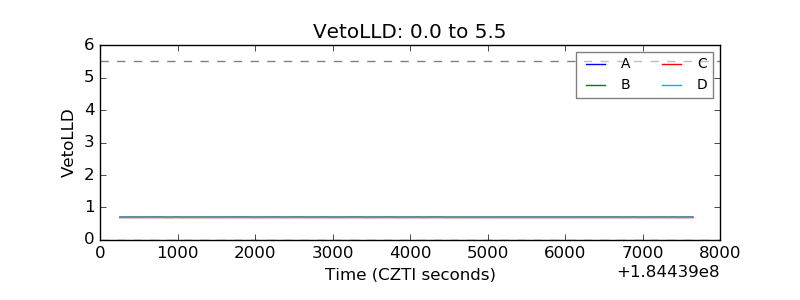 |
| Alpha Counter | 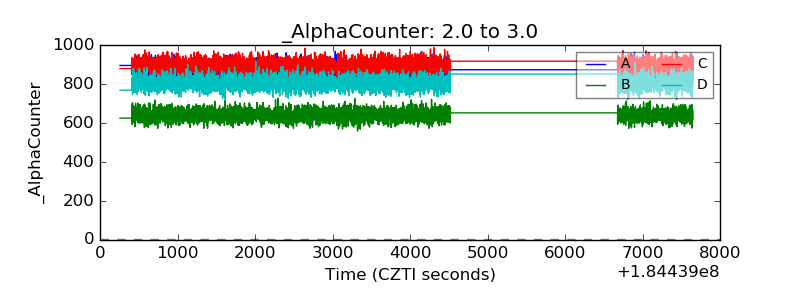 |
| _CPM_Rate | 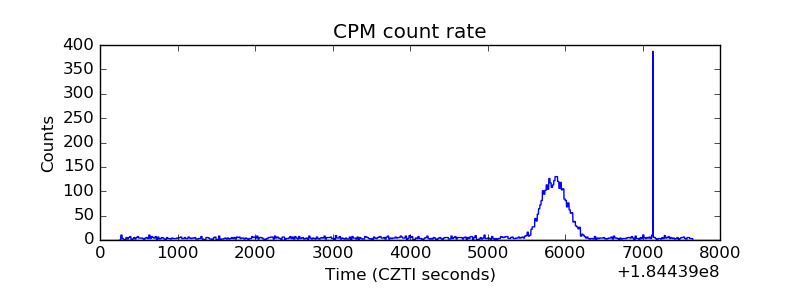 |
| CZT Counter |  |
| +2.5 Volts monitor |  |
| +5 Volts monitor |  |
| _ROLL_ROT | 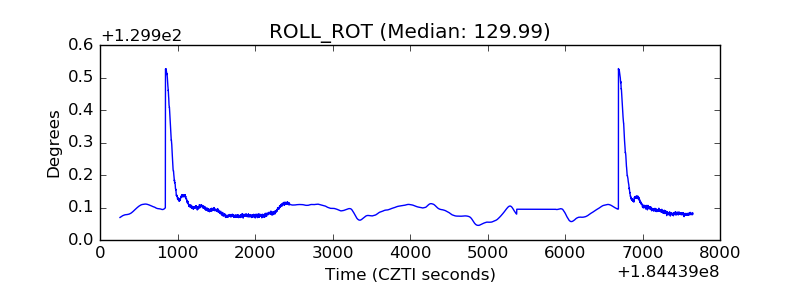 |
| _Roll_DEC | 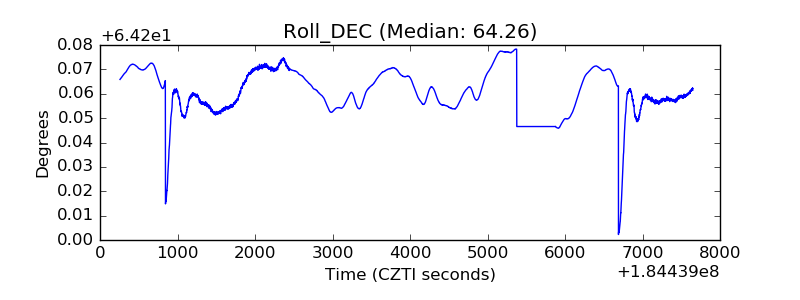 |
| _Roll_RA | 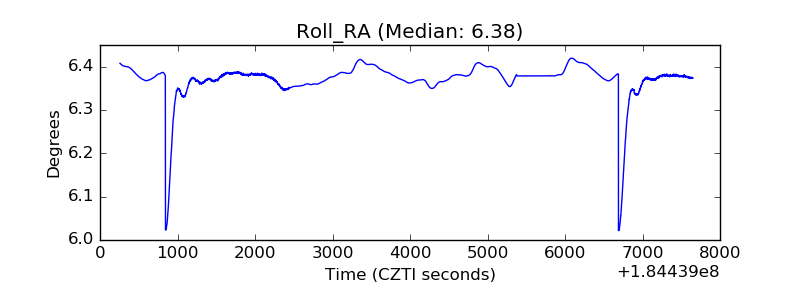 |
| Veto Counter | 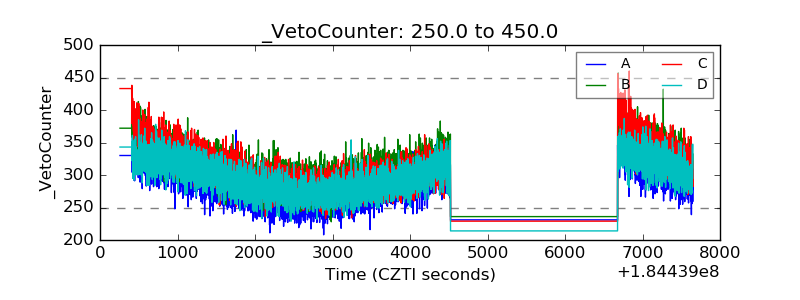 |