| Param | Original file | Final file |
|---|---|---|
| Filename | modeM0/AS1P01_014T01_9000000080_00574cztM0_level2.evt | modeM0/AS1P01_014T01_9000000080_00574cztM0_level2_quad_clean.evt |
| Size (bytes) | 781,914,240 | 70,200,000 |
| Size | 745.7 MB | 66.9 MB |
| Events in quadrant A | 6,285,360 | 434,636 |
| Events in quadrant B | 5,764,551 | 448,584 |
| Events in quadrant C | 5,566,249 | 451,294 |
| Events in quadrant D | 5,727,772 | 436,840 |
| Mode M0 | |||
|---|---|---|---|
| Quadrant | BADHDUFLAG | Total packets | Discarded packets |
| A | 0 | 22293 | 3 |
| B | 0 | 20767 | 2 |
| C | 0 | 20137 | 2 |
| D | 0 | 20611 | 2 |
| Mode M9 | |||
|---|---|---|---|
| Quadrant | BADHDUFLAG | Total packets | Discarded packets |
| A | 0 | 32 | 0 |
| B | 0 | 32 | 0 |
| C | 0 | 32 | 0 |
| D | 0 | 33 | 0 |
| Mode SS | |||
|---|---|---|---|
| Quadrant | BADHDUFLAG | Total packets | Discarded packets |
| A | 0 | 104 | 0 |
| B | 0 | 104 | 0 |
| C | 0 | 104 | 0 |
| D | 0 | 104 | 0 |
| Quadrant | Total seconds | Saturated seconds | Saturation percentage |
|---|---|---|---|
| A | 5048 | 206 | 4.080824% |
| B | 5048 | 2 | 0.039620% |
| C | 5048 | 4 | 0.079239% |
| D | 5048 | 34 | 0.673534% |
Noise dominated data is calculated using 1-second bins in cleaned event files. If a bin has >2000 counts, and if more than 50% of those come from <1% of pixels, then it is considered to be noise-dominated and hence unusable.
| Quadrant | # 1 sec bins | Bins with >0 counts | Bins with >2000 counts | High rate bins dominated by noise | Noise dominated (total time) | Noise dominated (detector-on time) | Marked lightcurve |
|---|---|---|---|---|---|---|---|
| A | 7204 | 5049 | 351 | 351 | 4.87% | 6.95% |  |
| B | 7204 | 5049 | 54 | 54 | 0.75% | 1.07% | 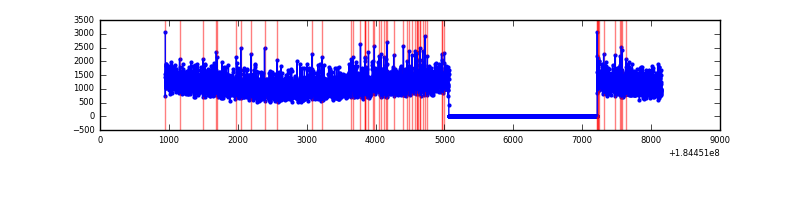 |
| C | 7204 | 5049 | 47 | 47 | 0.65% | 0.93% | 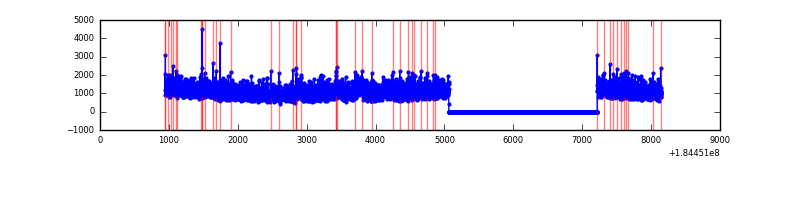 |
| D | 7204 | 5049 | 207 | 207 | 2.87% | 4.10% | 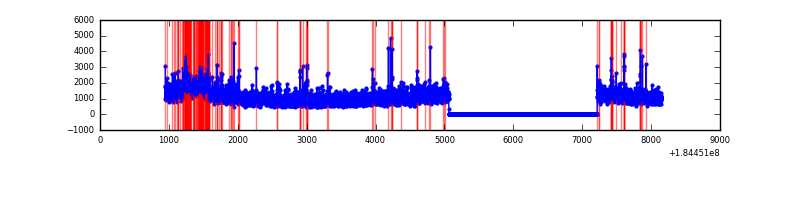 |
Top three noisy pixels from each quadrant. If the there are fewer than three noisy pixels in the level2.evt file, extra rows are filled as -1
| Pixel properties | Quadrant properties | ||||||
|---|---|---|---|---|---|---|---|
| Quadrant | DetID | PixID | Counts | Sigma | Mean | Median | Sigma |
| A | 13 | 17 | 639420 | 1985.25 | 1441 | 1422 | 321.4 |
| A | 12 | 133 | 29903 | 88.62 | 1441 | 1422 | 321.4 |
| A | 0 | 238 | 26927 | 79.36 | 1441 | 1422 | 321.4 |
| B | 0 | 220 | 20708 | 55.05 | 1489 | 1498 | 349.0 |
| B | 15 | 185 | 16178 | 42.07 | 1489 | 1498 | 349.0 |
| B | 8 | 4 | 13295 | 33.8 | 1489 | 1498 | 349.0 |
| C | 9 | 85 | 161695 | 421.65 | 1357 | 1405 | 380.2 |
| C | 5 | 249 | 33440 | 84.27 | 1357 | 1405 | 380.2 |
| C | 15 | 241 | 13651 | 32.21 | 1357 | 1405 | 380.2 |
| D | 13 | 221 | 330271 | 825.31 | 1274 | 1320 | 398.6 |
| D | 1 | 4 | 195290 | 486.66 | 1274 | 1320 | 398.6 |
| D | 12 | 22 | 157255 | 391.23 | 1274 | 1320 | 398.6 |
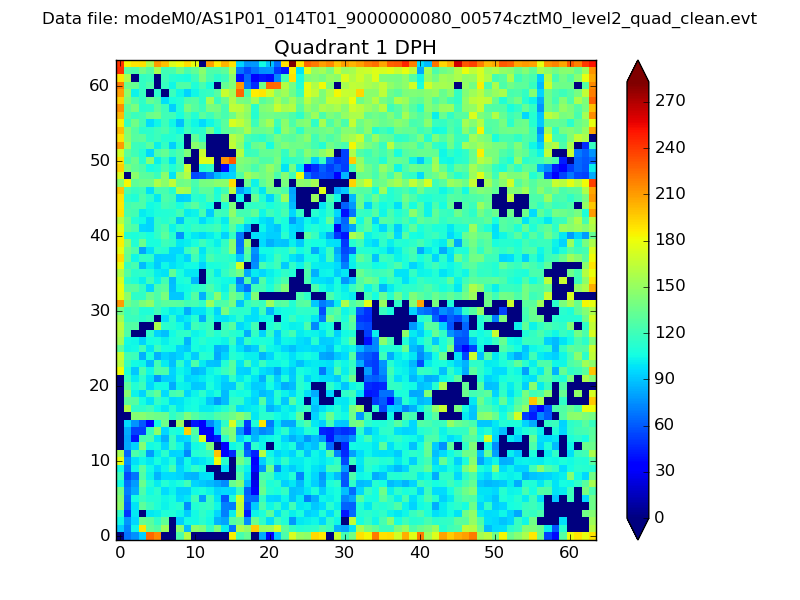
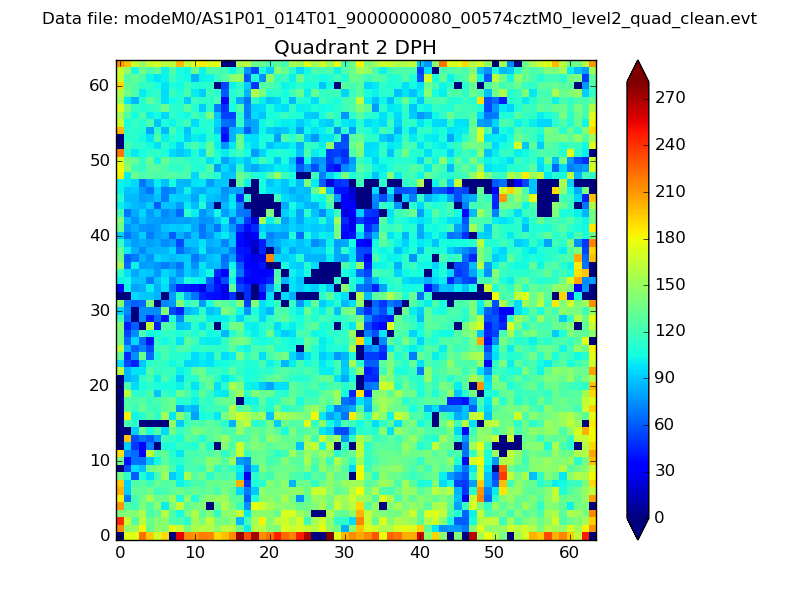
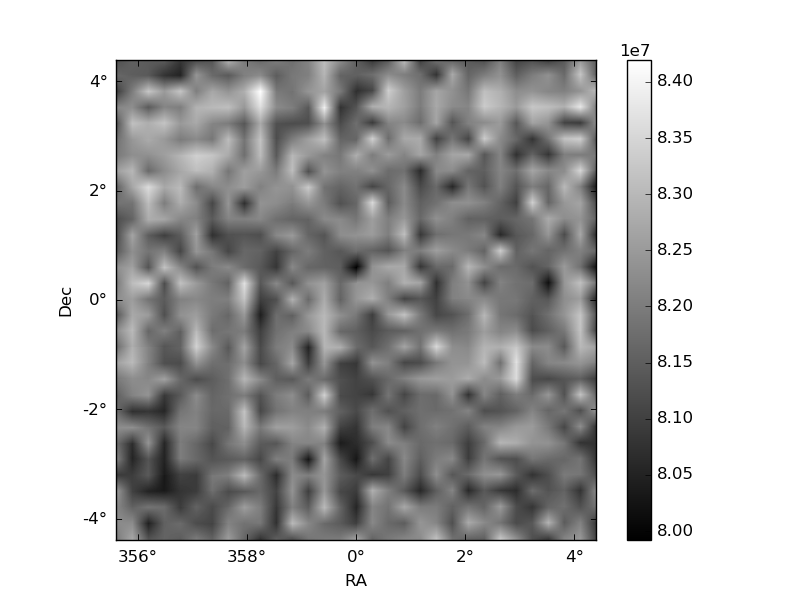
Histogram calculated using DETX and DETY for each event in the final _common_clean file
| Quadrant A | 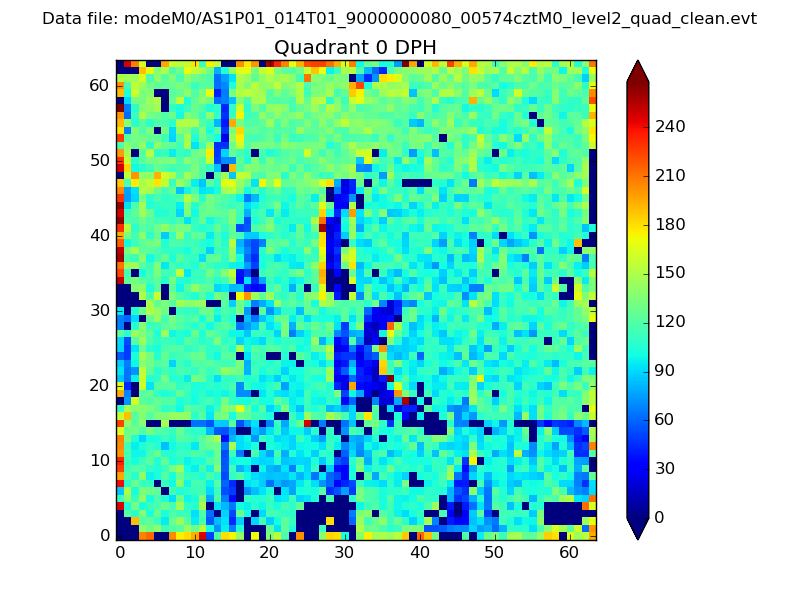 |
 |
Quadrant B |
|---|---|---|---|
| Quadrant D | 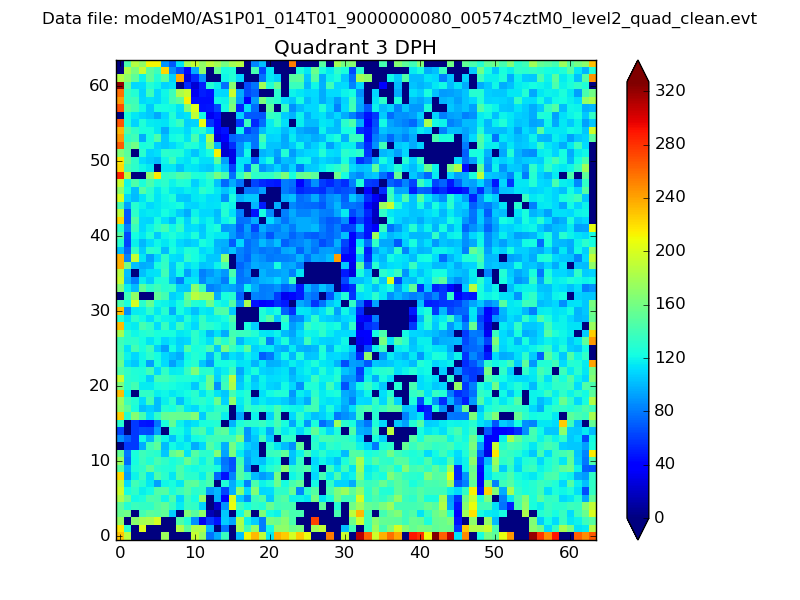 |
 |
Quadrant C |
| Plot type | Count rate plots | Images |
|---|---|---|
| Comparison with Poisson distribution Blue bars denote a histogram of data divided into 1 sec bins. Red curve is a Poisson curve with rate = median count rate of data. |
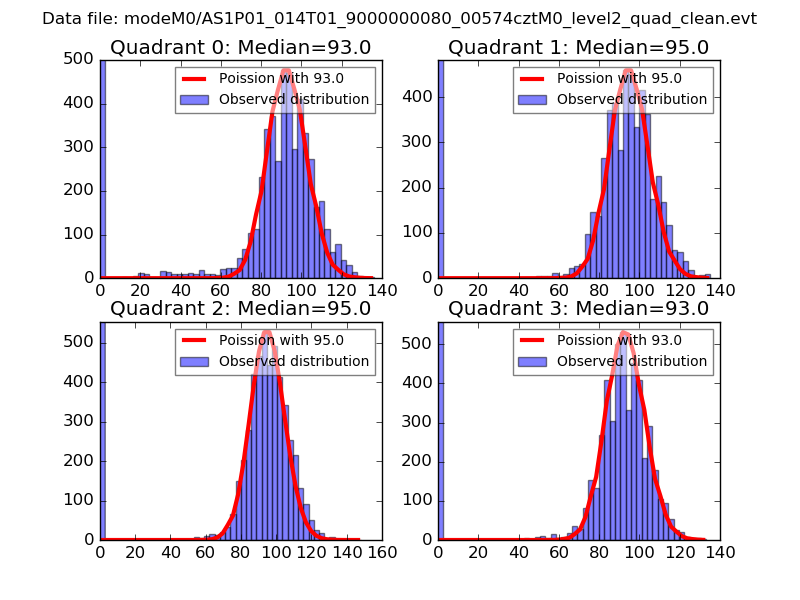 |
 |
| Quadrant-wise count rates Data is divided into 100 sec bins |
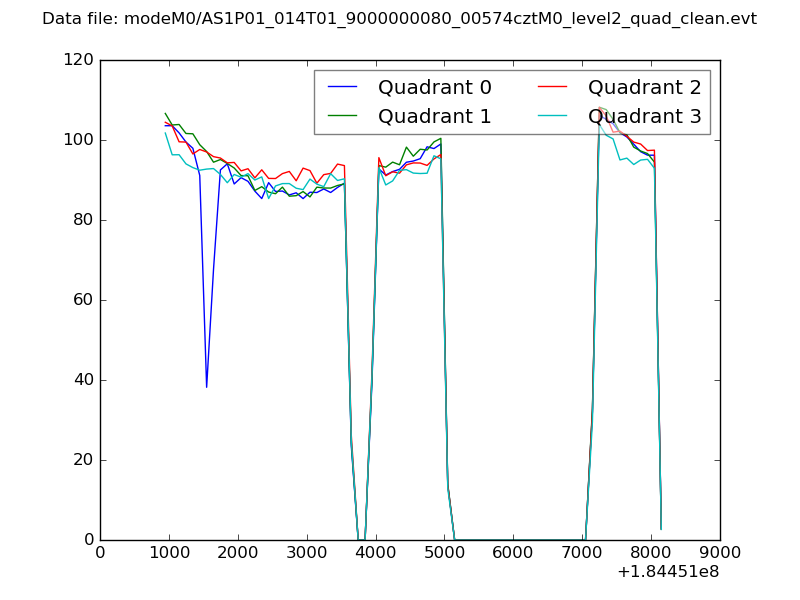 |
|
| Module-wise count rates for Quadrant A Data is divided into 100 sec bins |
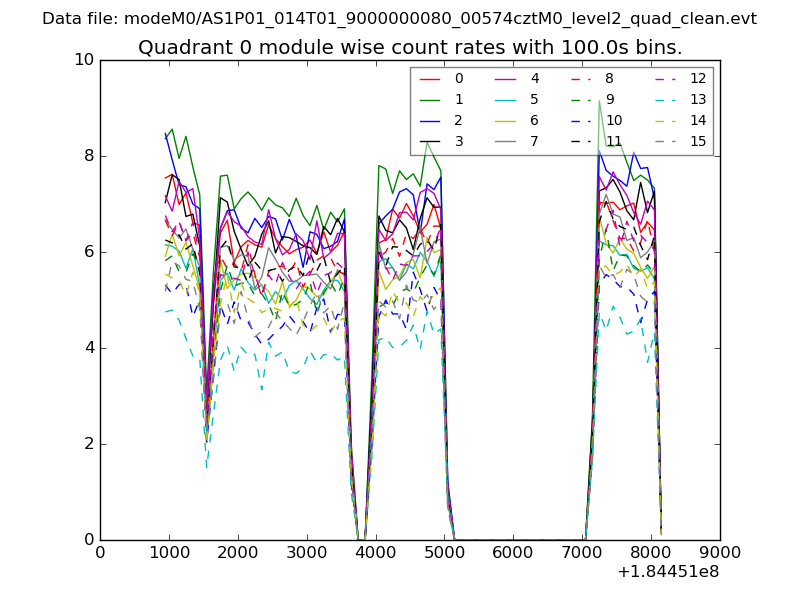 |
 |
| Module-wise count rates for Quadrant B Data is divided into 100 sec bins |
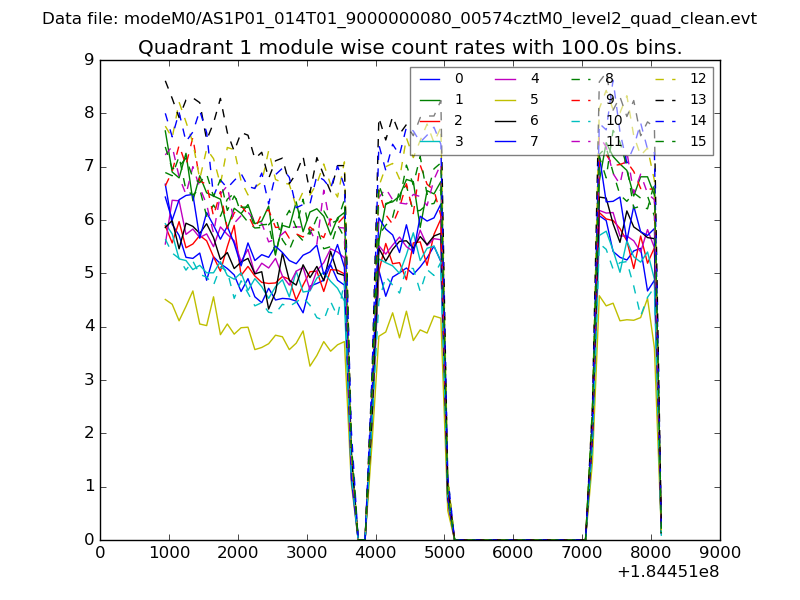 |
 |
| Module-wise count rates for Quadrant C Data is divided into 100 sec bins |
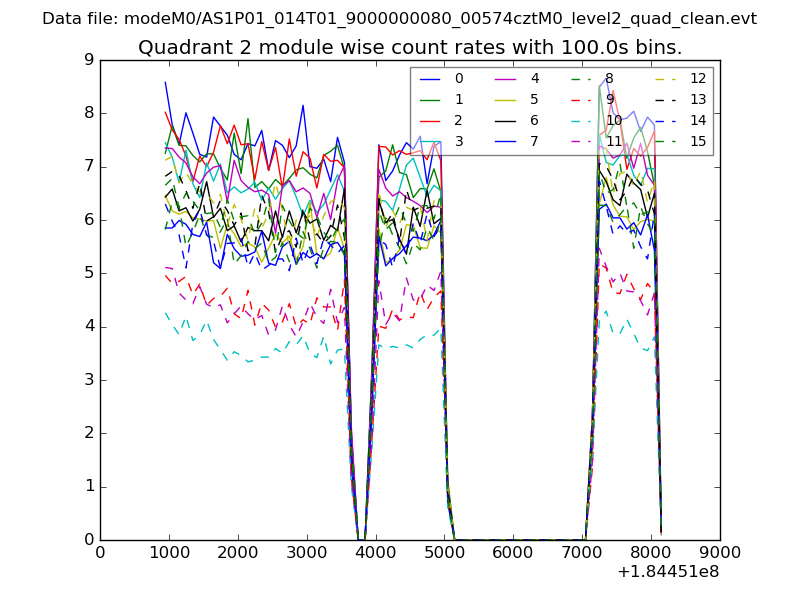 |
 |
| Module-wise count rates for Quadrant D Data is divided into 100 sec bins |
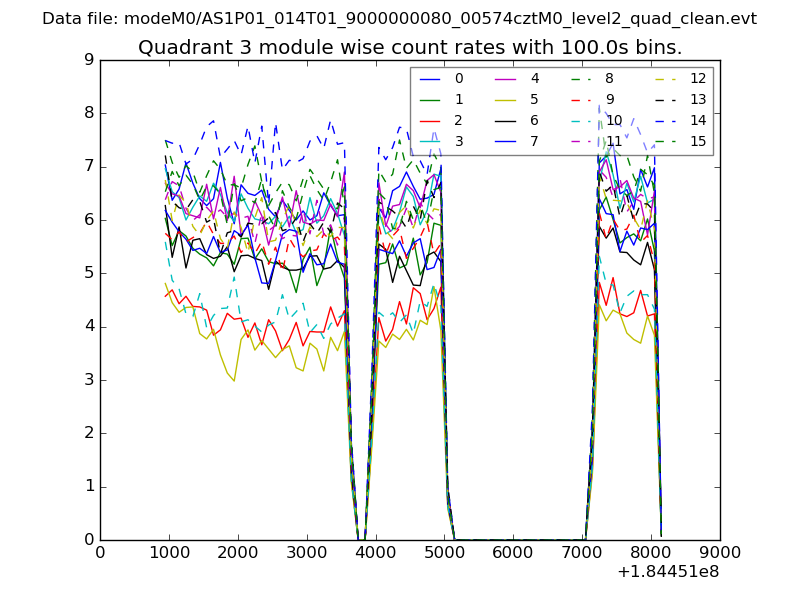 |
 |
| Parameter | Plot |
|---|---|
| CZT HV Monitor | 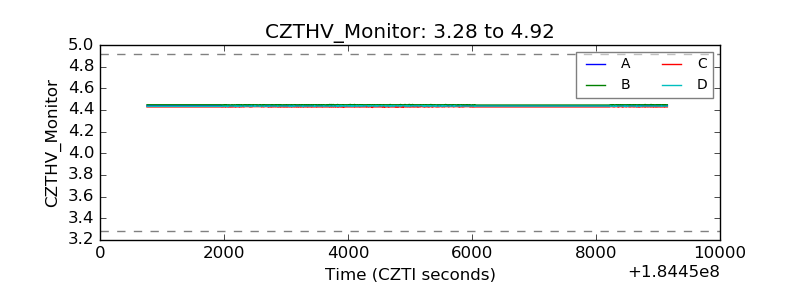 |
| D_VDD | 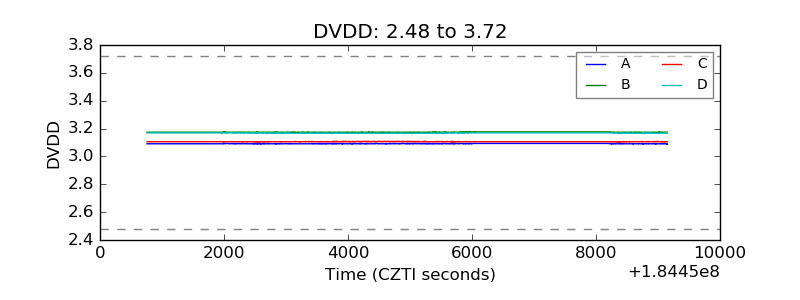 |
| Temperature 1 | 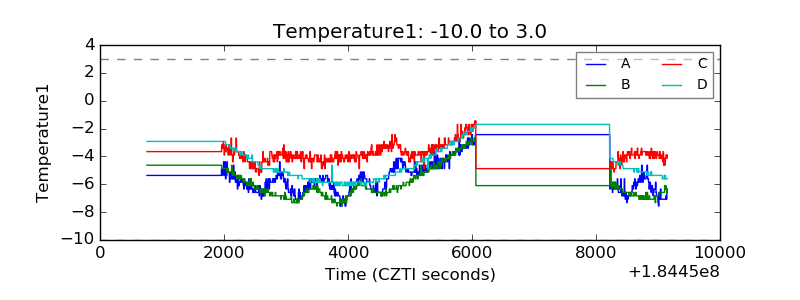 |
| Veto HV Monitor | 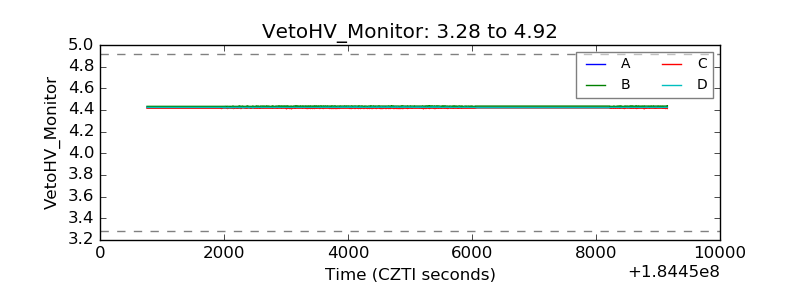 |
| Veto LLD | 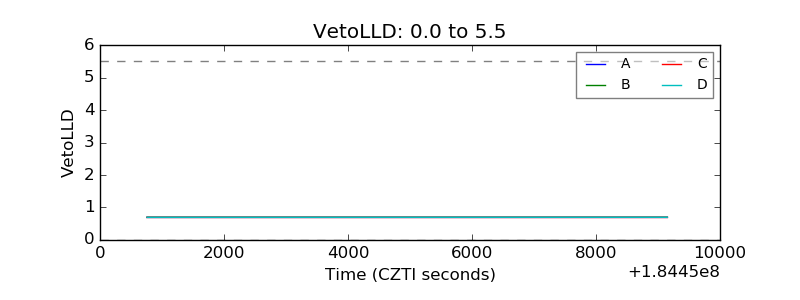 |
| Alpha Counter | 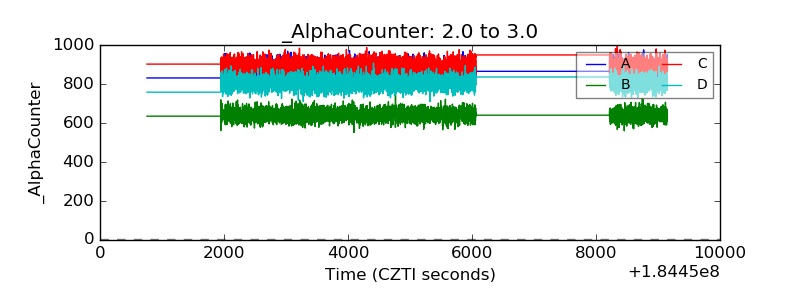 |
| _CPM_Rate | 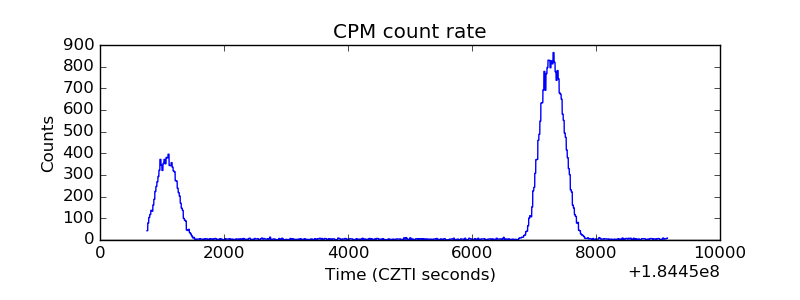 |
| CZT Counter | 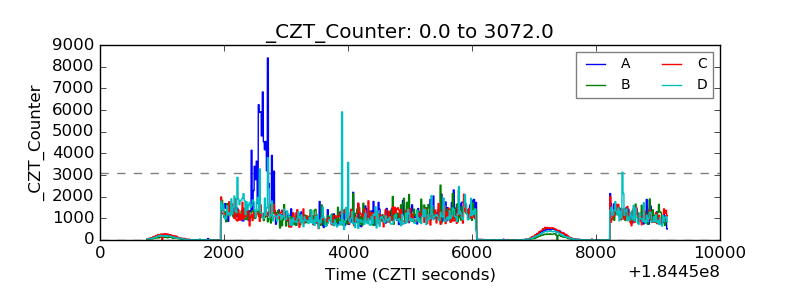 |
| +2.5 Volts monitor |  |
| +5 Volts monitor | 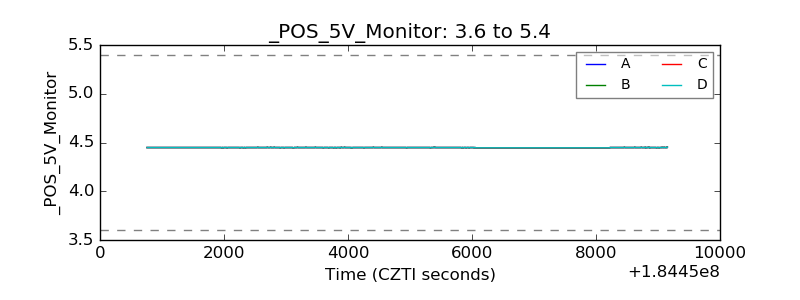 |
| _ROLL_ROT | 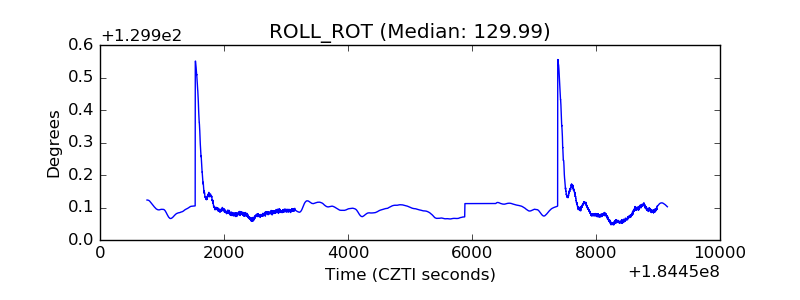 |
| _Roll_DEC | 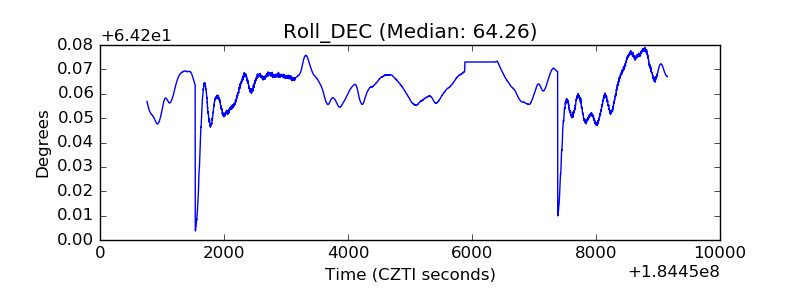 |
| _Roll_RA |  |
| Veto Counter | 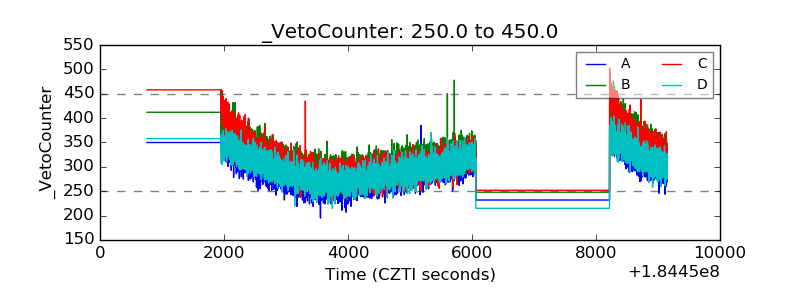 |