| Param | Original file | Final file |
|---|---|---|
| Filename | modeM0/AS1P01_014T01_9000000080_00575cztM0_level2.evt | modeM0/AS1P01_014T01_9000000080_00575cztM0_level2_quad_clean.evt |
| Size (bytes) | 737,193,600 | 69,958,080 |
| Size | 703.0 MB | 66.7 MB |
| Events in quadrant A | 5,691,661 | 443,552 |
| Events in quadrant B | 5,766,991 | 446,584 |
| Events in quadrant C | 5,367,330 | 449,366 |
| Events in quadrant D | 5,171,742 | 433,485 |
| Mode M0 | |||
|---|---|---|---|
| Quadrant | BADHDUFLAG | Total packets | Discarded packets |
| A | 0 | 20432 | 3 |
| B | 0 | 20639 | 2 |
| C | 0 | 19441 | 2 |
| D | 0 | 18933 | 2 |
| Mode M9 | |||
|---|---|---|---|
| Quadrant | BADHDUFLAG | Total packets | Discarded packets |
| A | 0 | 39 | 0 |
| B | 0 | 39 | 0 |
| C | 0 | 39 | 0 |
| D | 0 | 40 | 0 |
| Mode SS | |||
|---|---|---|---|
| Quadrant | BADHDUFLAG | Total packets | Discarded packets |
| A | 0 | 100 | 0 |
| B | 0 | 100 | 0 |
| C | 0 | 100 | 0 |
| D | 0 | 100 | 0 |
| Quadrant | Total seconds | Saturated seconds | Saturation percentage |
|---|---|---|---|
| A | 4924 | 6 | 0.121852% |
| B | 4924 | 7 | 0.142161% |
| C | 4924 | 9 | 0.182778% |
| D | 4924 | 21 | 0.426483% |
Noise dominated data is calculated using 1-second bins in cleaned event files. If a bin has >2000 counts, and if more than 50% of those come from <1% of pixels, then it is considered to be noise-dominated and hence unusable.
| Quadrant | # 1 sec bins | Bins with >0 counts | Bins with >2000 counts | High rate bins dominated by noise | Noise dominated (total time) | Noise dominated (detector-on time) | Marked lightcurve |
|---|---|---|---|---|---|---|---|
| A | 7080 | 4925 | 97 | 97 | 1.37% | 1.97% | 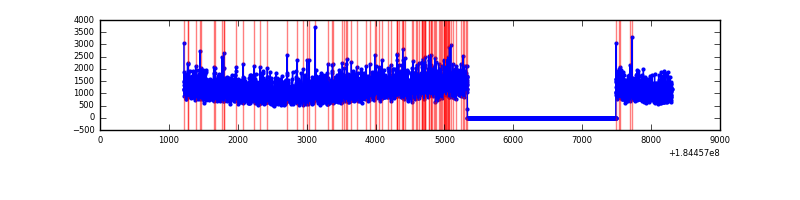 |
| B | 7080 | 4925 | 87 | 87 | 1.23% | 1.77% | 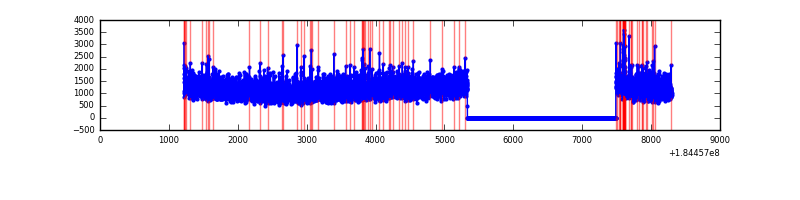 |
| C | 7080 | 4925 | 57 | 57 | 0.81% | 1.16% | 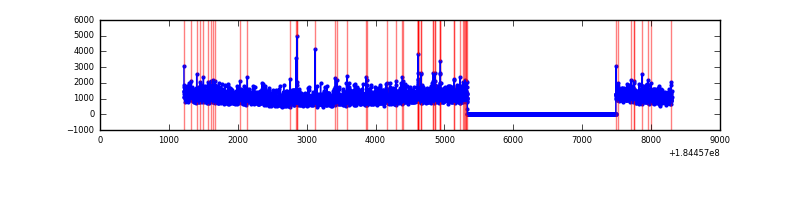 |
| D | 7080 | 4925 | 83 | 83 | 1.17% | 1.69% | 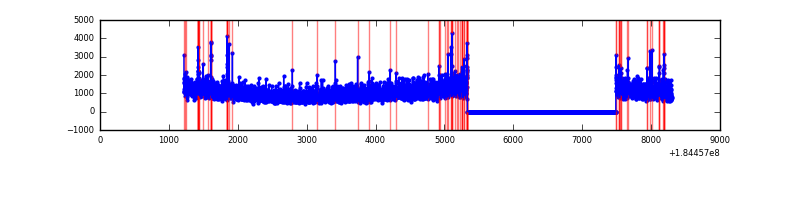 |
Top three noisy pixels from each quadrant. If the there are fewer than three noisy pixels in the level2.evt file, extra rows are filled as -1
| Pixel properties | Quadrant properties | ||||||
|---|---|---|---|---|---|---|---|
| Quadrant | DetID | PixID | Counts | Sigma | Mean | Median | Sigma |
| A | 0 | 149 | 57522 | 173.1 | 1442 | 1423 | 324.1 |
| A | 0 | 238 | 31140 | 91.69 | 1442 | 1423 | 324.1 |
| A | 0 | 69 | 22449 | 64.88 | 1442 | 1423 | 324.1 |
| B | 4 | 206 | 47576 | 133.27 | 1463 | 1472 | 345.9 |
| B | 8 | 4 | 36621 | 101.61 | 1463 | 1472 | 345.9 |
| B | 15 | 185 | 25341 | 69.0 | 1463 | 1472 | 345.9 |
| C | 5 | 249 | 125043 | 338.85 | 1308 | 1355 | 365.0 |
| C | 3 | 159 | 37866 | 100.02 | 1308 | 1355 | 365.0 |
| C | 15 | 241 | 34821 | 91.68 | 1308 | 1355 | 365.0 |
| D | 13 | 221 | 137313 | 355.02 | 1230 | 1279 | 383.2 |
| D | 1 | 4 | 53808 | 137.09 | 1230 | 1279 | 383.2 |
| D | 13 | 216 | 41781 | 105.7 | 1230 | 1279 | 383.2 |
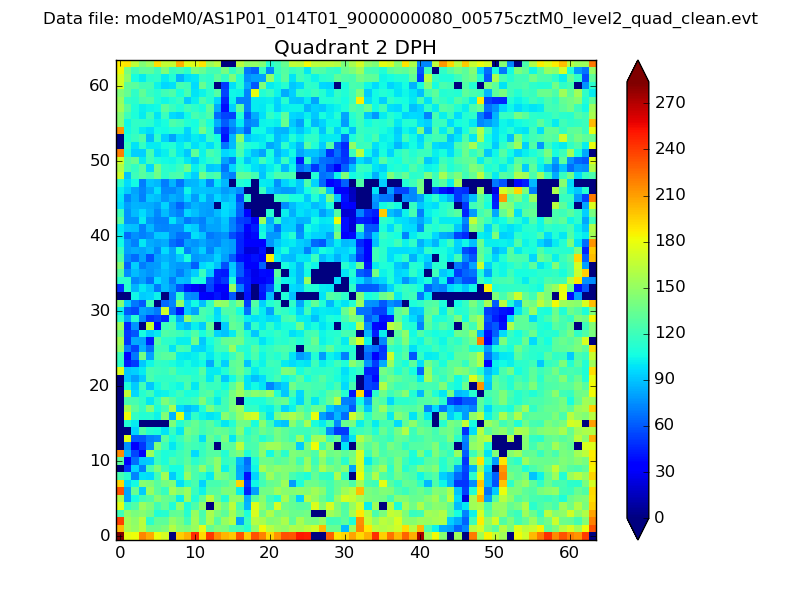
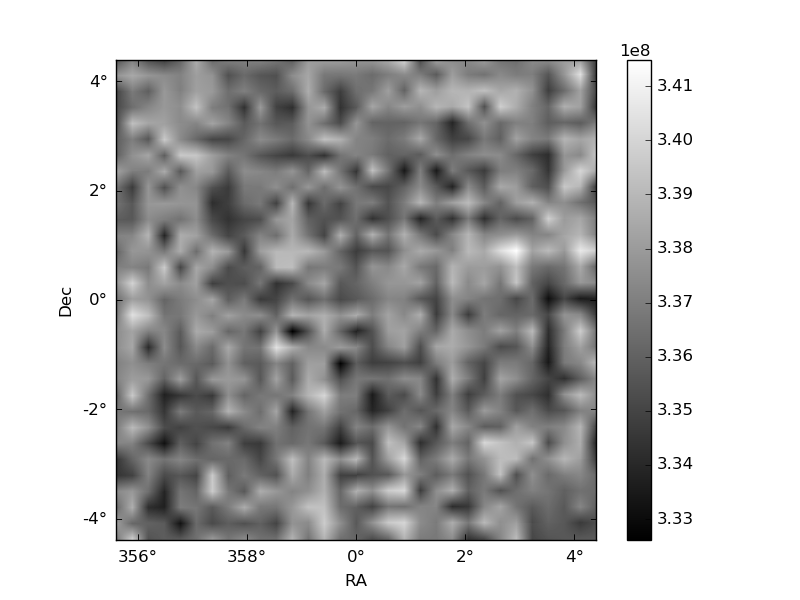
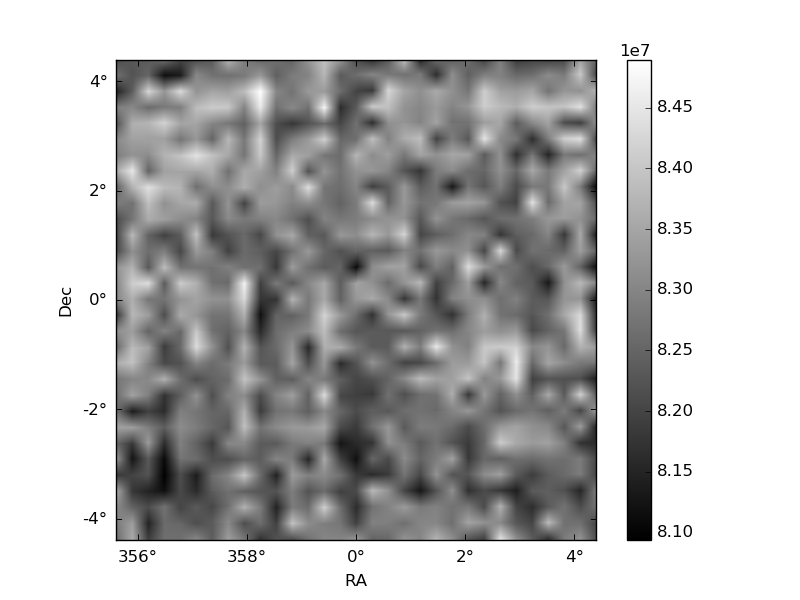
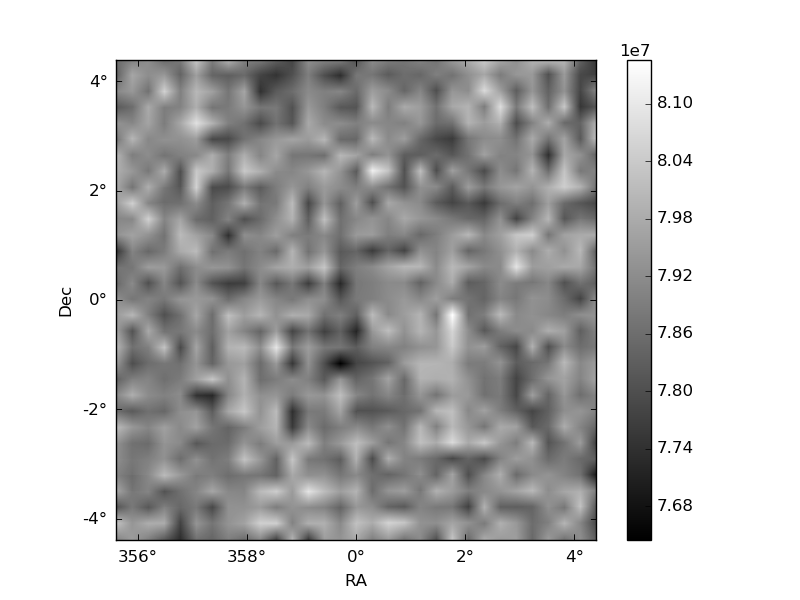
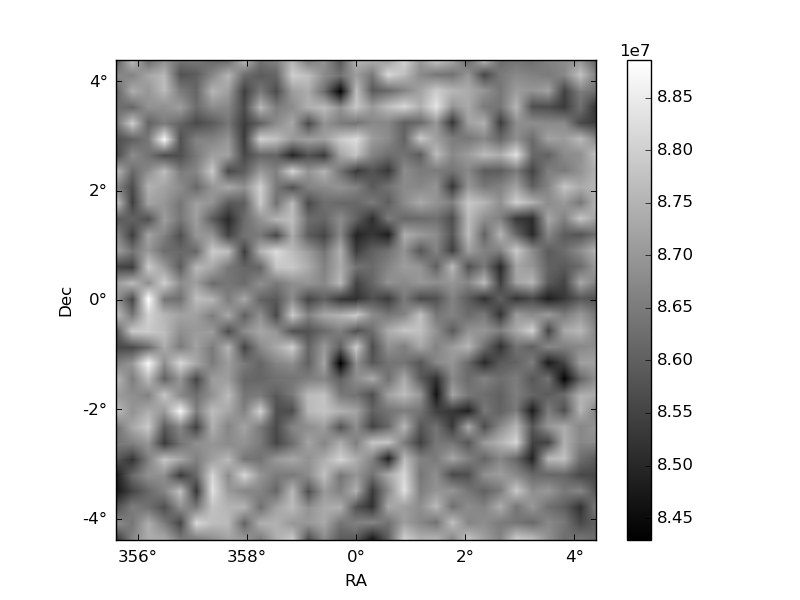
Histogram calculated using DETX and DETY for each event in the final _common_clean file
| Quadrant A | 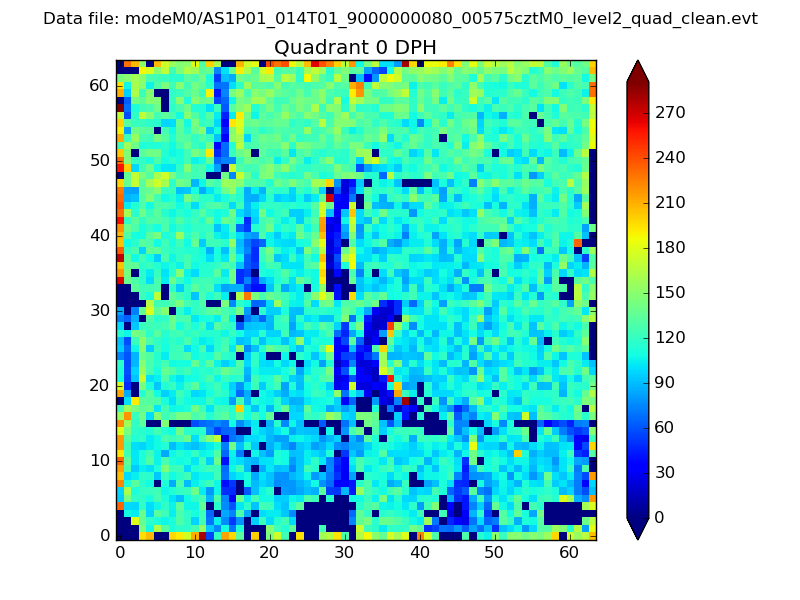 |
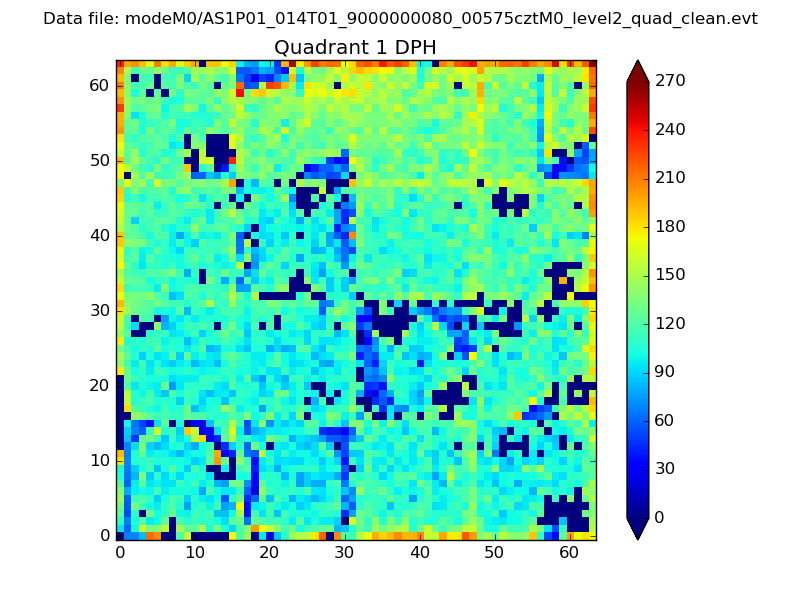 |
Quadrant B |
|---|---|---|---|
| Quadrant D | 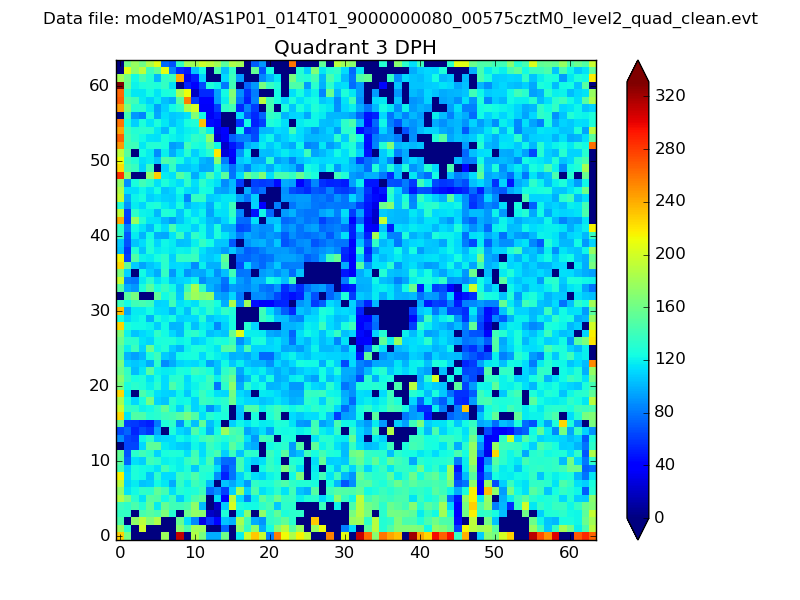 |
 |
Quadrant C |
| Plot type | Count rate plots | Images |
|---|---|---|
| Comparison with Poisson distribution Blue bars denote a histogram of data divided into 1 sec bins. Red curve is a Poisson curve with rate = median count rate of data. |
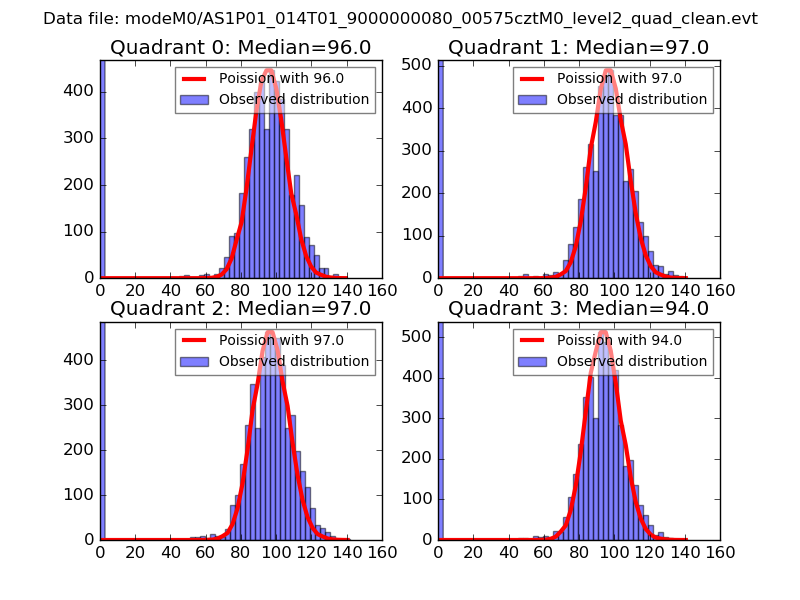 |
 |
| Quadrant-wise count rates Data is divided into 100 sec bins |
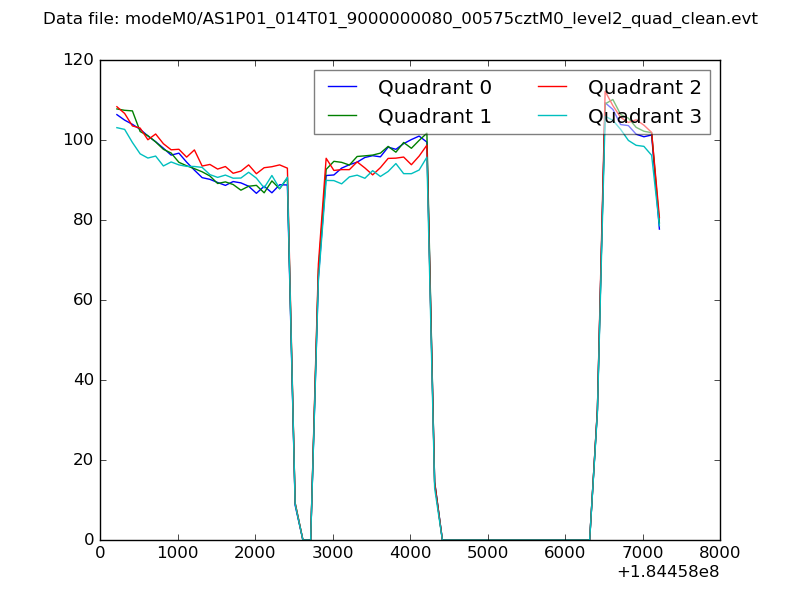 |
|
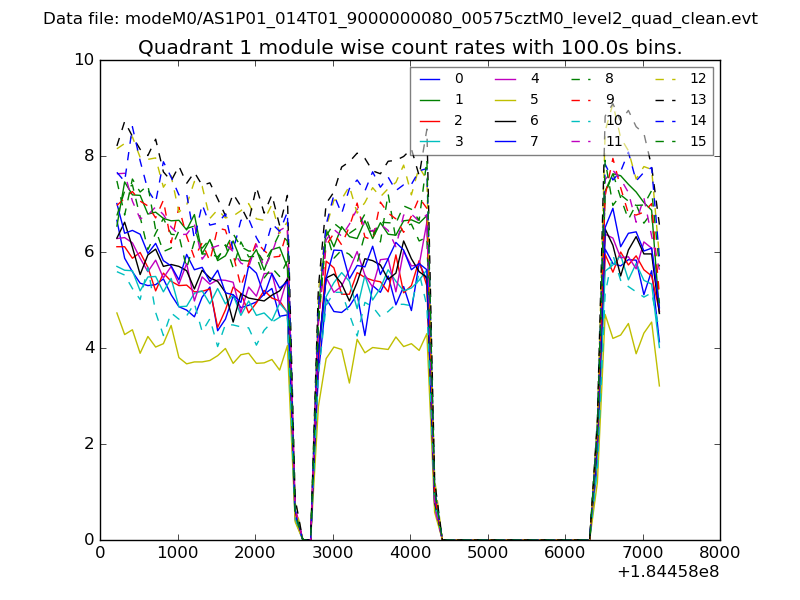
| Module-wise count rates for Quadrant A Data is divided into 100 sec bins |
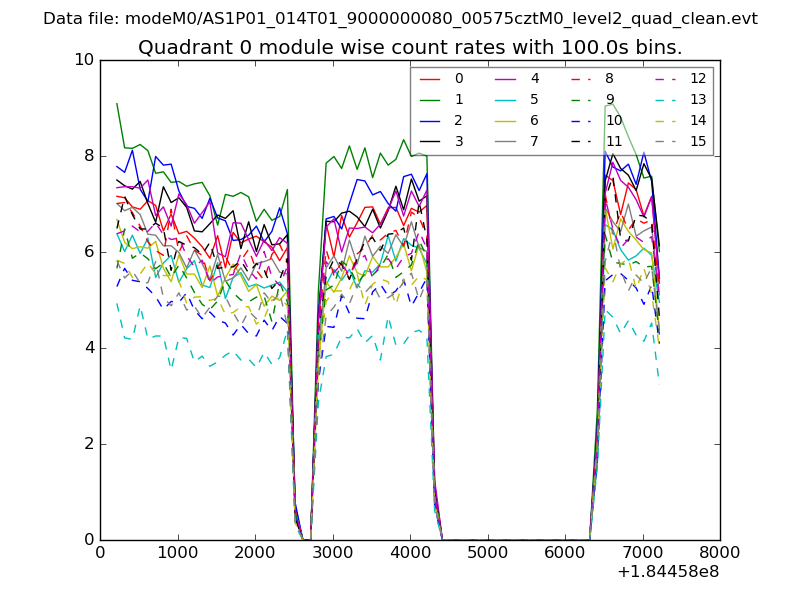 |
 |
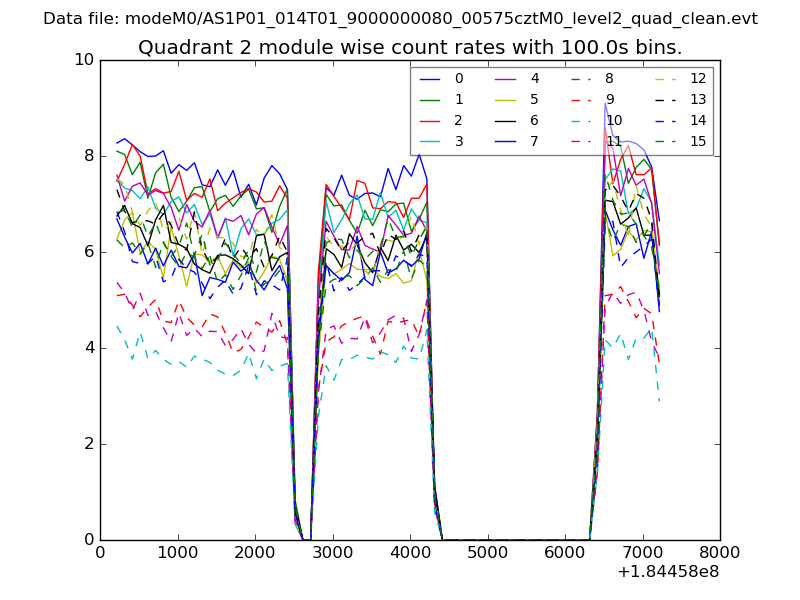
| Module-wise count rates for Quadrant B Data is divided into 100 sec bins |
 |
 |
| Module-wise count rates for Quadrant C Data is divided into 100 sec bins |
 |
 |
| Module-wise count rates for Quadrant D Data is divided into 100 sec bins |
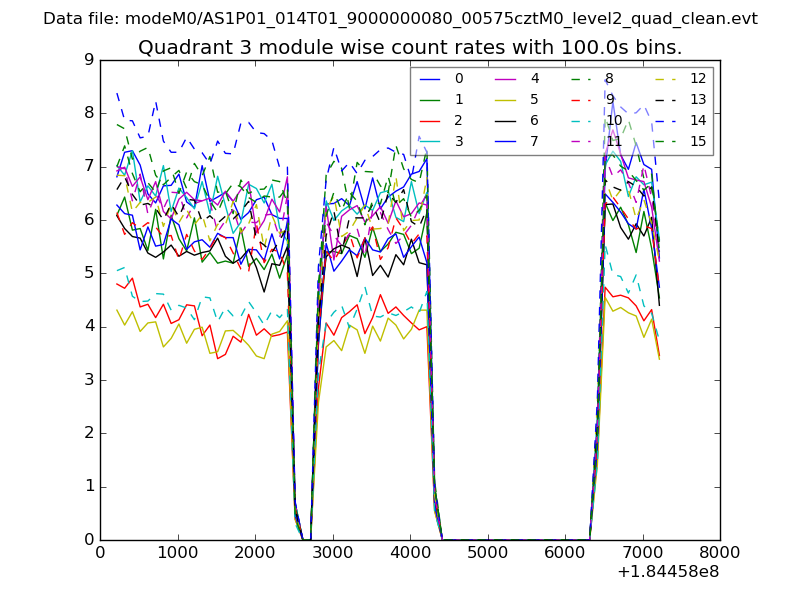 |
 |
| Parameter | Plot |
|---|---|
| CZT HV Monitor | 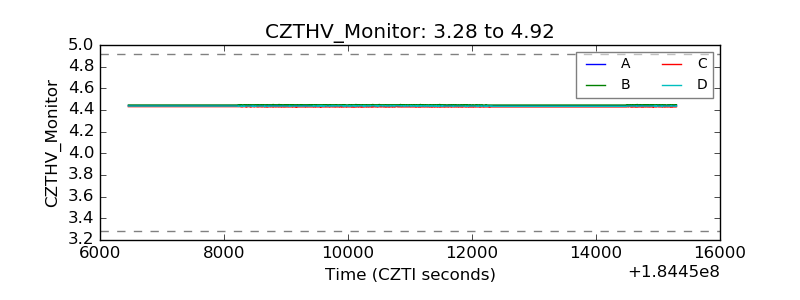 |
| D_VDD | 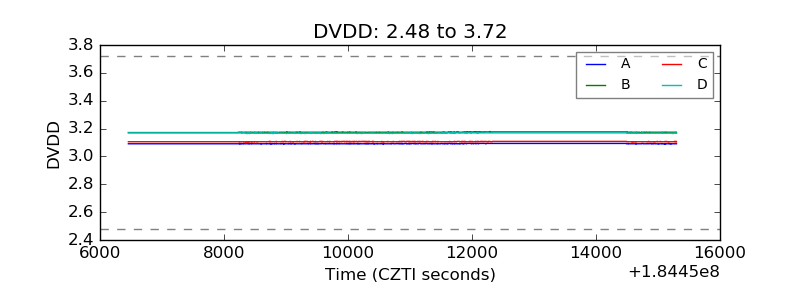 |
| Temperature 1 | 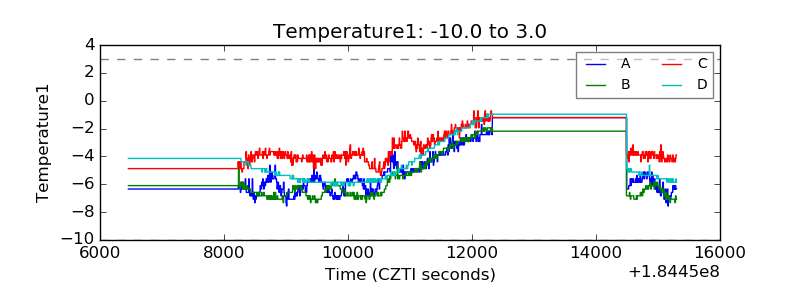 |
| Veto HV Monitor |  |
| Veto LLD | 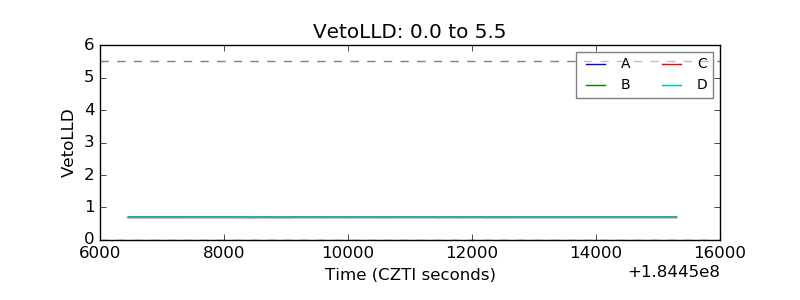 |
| Alpha Counter | 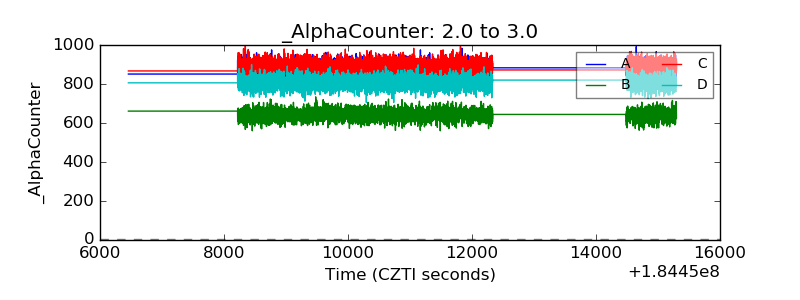 |
| _CPM_Rate | 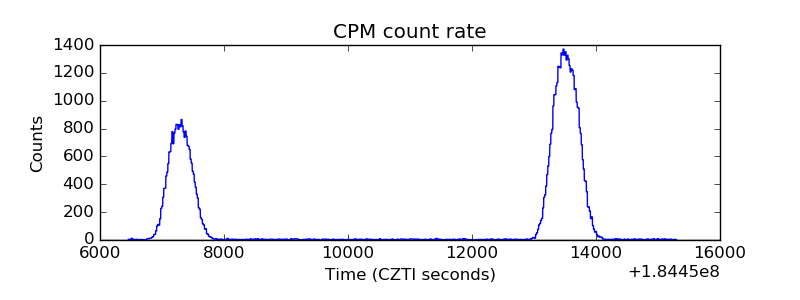 |
| CZT Counter | 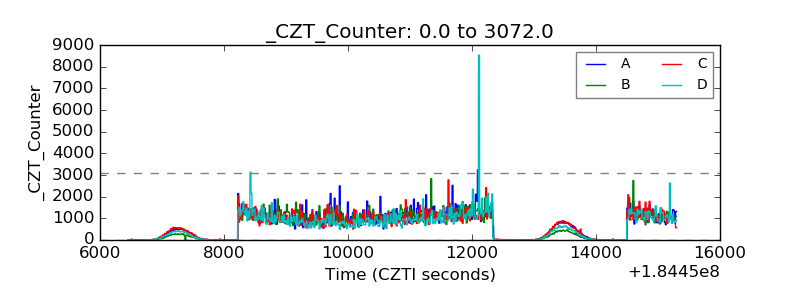 |
| +2.5 Volts monitor |  |
| +5 Volts monitor | 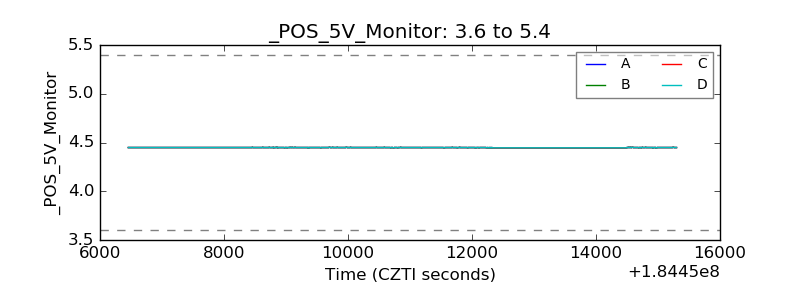 |
| _ROLL_ROT | 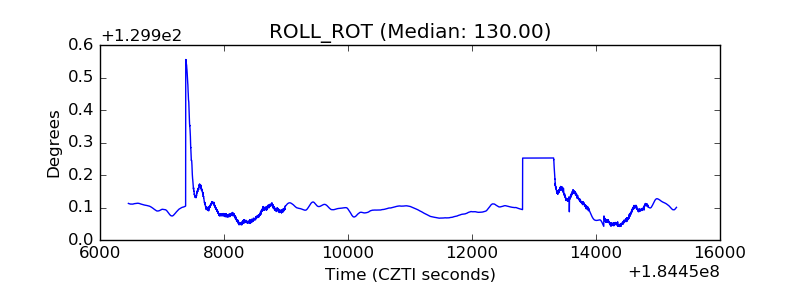 |
| _Roll_DEC | 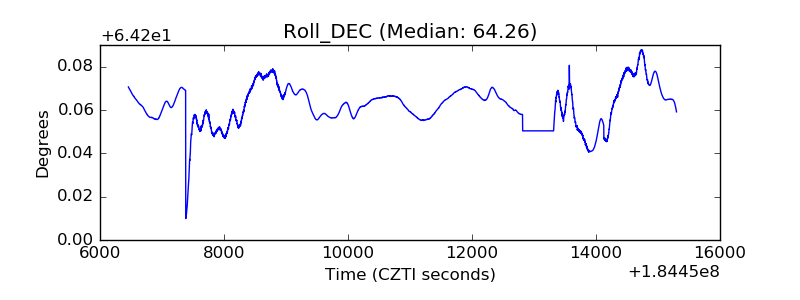 |
| _Roll_RA | 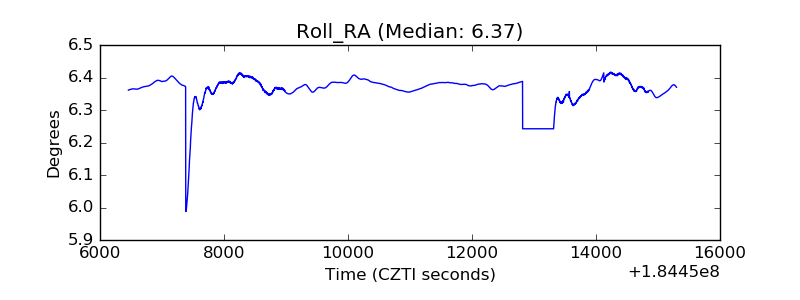 |
| Veto Counter | 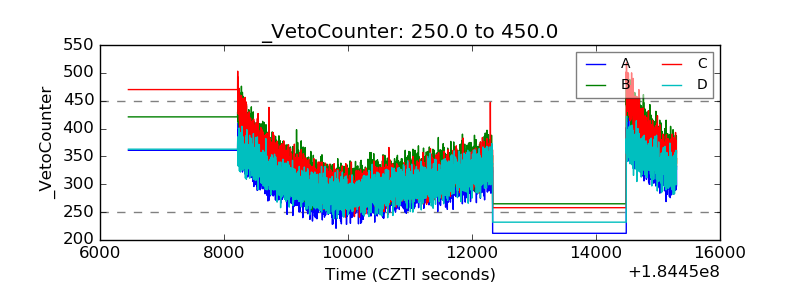 |