| Param | Original file | Final file |
|---|---|---|
| Filename | modeM0/AS1P01_014T01_9000000080_00577cztM0_level2.evt | modeM0/AS1P01_014T01_9000000080_00577cztM0_level2_quad_clean.evt |
| Size (bytes) | 835,012,800 | 71,449,920 |
| Size | 796.3 MB | 68.1 MB |
| Events in quadrant A | 7,967,369 | 438,240 |
| Events in quadrant B | 5,825,557 | 467,450 |
| Events in quadrant C | 5,366,984 | 466,800 |
| Events in quadrant D | 5,798,506 | 442,736 |
| Mode M0 | |||
|---|---|---|---|
| Quadrant | BADHDUFLAG | Total packets | Discarded packets |
| A | 0 | 27311 | 3 |
| B | 0 | 20828 | 2 |
| C | 0 | 19471 | 2 |
| D | 0 | 20787 | 2 |
| Mode M9 | |||
|---|---|---|---|
| Quadrant | BADHDUFLAG | Total packets | Discarded packets |
| A | 0 | 33 | 0 |
| B | 0 | 33 | 0 |
| C | 0 | 33 | 0 |
| D | 0 | 34 | 0 |
| Mode SS | |||
|---|---|---|---|
| Quadrant | BADHDUFLAG | Total packets | Discarded packets |
| A | 0 | 100 | 0 |
| B | 0 | 100 | 0 |
| C | 0 | 100 | 0 |
| D | 0 | 100 | 0 |
| Quadrant | Total seconds | Saturated seconds | Saturation percentage |
|---|---|---|---|
| A | 4966 | 784 | 15.787354% |
| B | 4966 | 7 | 0.140959% |
| C | 4966 | 13 | 0.261780% |
| D | 4966 | 101 | 2.033830% |
Noise dominated data is calculated using 1-second bins in cleaned event files. If a bin has >2000 counts, and if more than 50% of those come from <1% of pixels, then it is considered to be noise-dominated and hence unusable.
| Quadrant | # 1 sec bins | Bins with >0 counts | Bins with >2000 counts | High rate bins dominated by noise | Noise dominated (total time) | Noise dominated (detector-on time) | Marked lightcurve |
|---|---|---|---|---|---|---|---|
| A | 7122 | 4967 | 1181 | 1181 | 16.58% | 23.78% | 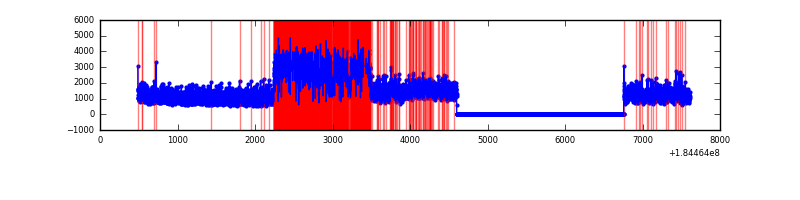 |
| B | 7122 | 4967 | 74 | 74 | 1.04% | 1.49% | 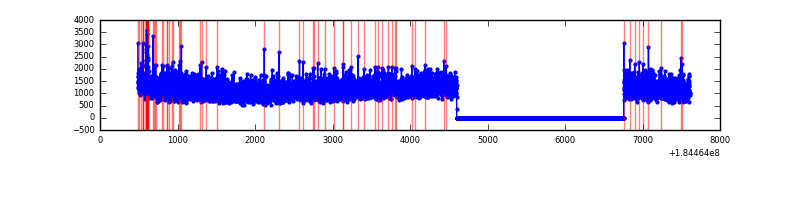 |
| C | 7122 | 4967 | 41 | 41 | 0.58% | 0.83% | 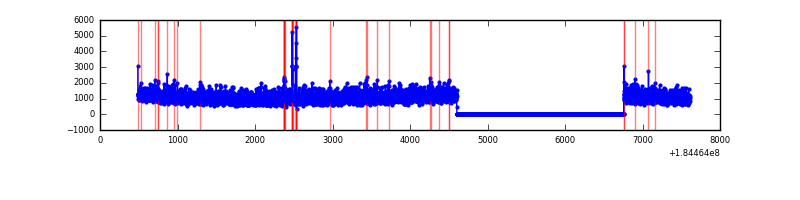 |
| D | 7122 | 4967 | 304 | 304 | 4.27% | 6.12% | 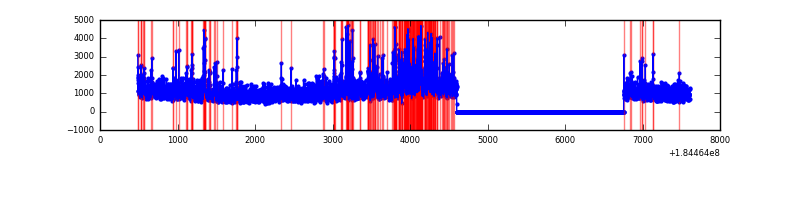 |
Top three noisy pixels from each quadrant. If the there are fewer than three noisy pixels in the level2.evt file, extra rows are filled as -1
| Pixel properties | Quadrant properties | ||||||
|---|---|---|---|---|---|---|---|
| Quadrant | DetID | PixID | Counts | Sigma | Mean | Median | Sigma |
| A | 0 | 149 | 2320163 | 7445.16 | 1403 | 1391 | 311.4 |
| A | 0 | 69 | 135776 | 431.49 | 1403 | 1391 | 311.4 |
| A | 15 | 17 | 35204 | 108.57 | 1403 | 1391 | 311.4 |
| B | 4 | 206 | 48622 | 134.34 | 1490 | 1503 | 350.8 |
| B | 0 | 220 | 22608 | 60.17 | 1490 | 1503 | 350.8 |
| B | 8 | 4 | 19489 | 51.28 | 1490 | 1503 | 350.8 |
| C | 9 | 85 | 57878 | 153.93 | 1319 | 1363 | 367.1 |
| C | 7 | 255 | 42668 | 112.5 | 1319 | 1363 | 367.1 |
| C | 5 | 249 | 39083 | 102.74 | 1319 | 1363 | 367.1 |
| D | 1 | 4 | 636541 | 1613.37 | 1260 | 1306 | 393.7 |
| D | 13 | 221 | 86600 | 216.63 | 1260 | 1306 | 393.7 |
| D | 13 | 216 | 78783 | 196.78 | 1260 | 1306 | 393.7 |
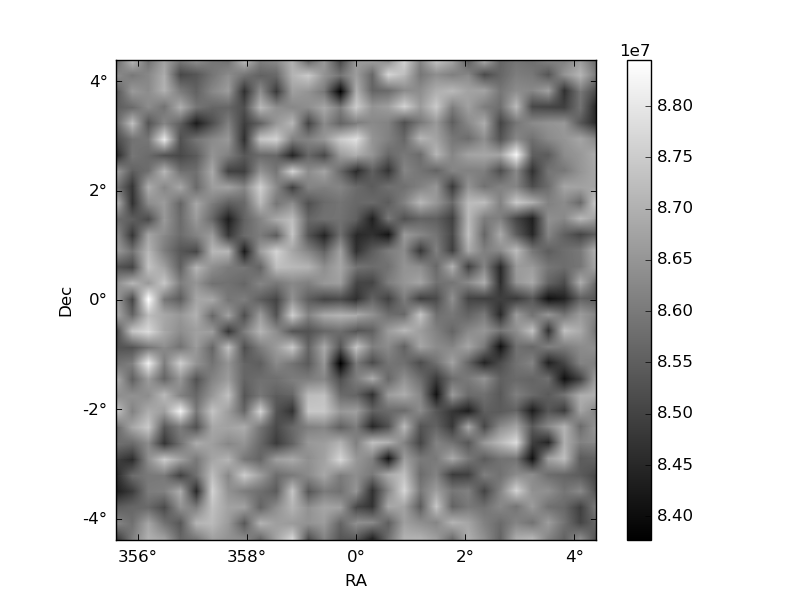
Histogram calculated using DETX and DETY for each event in the final _common_clean file
| Quadrant A | 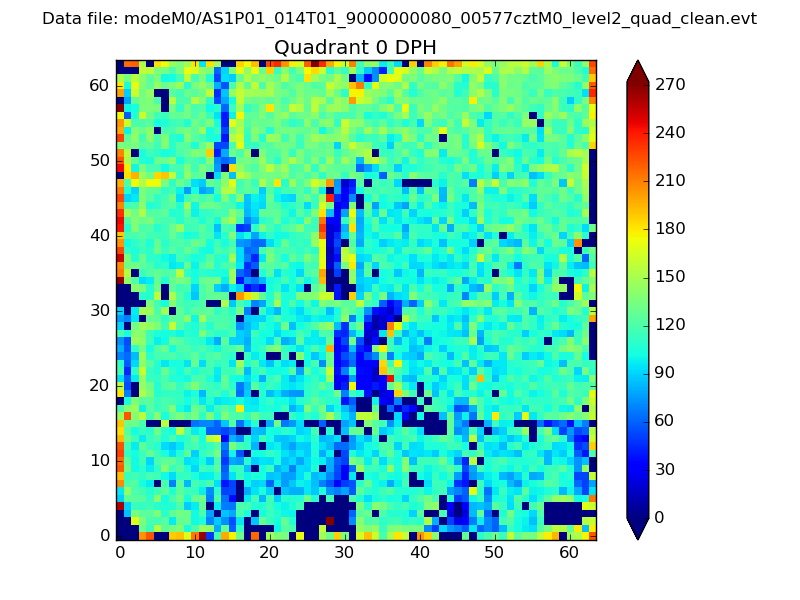 |
 |
Quadrant B |
|---|---|---|---|
| Quadrant D |  |
 |
Quadrant C |
| Plot type | Count rate plots | Images |
|---|---|---|
| Comparison with Poisson distribution Blue bars denote a histogram of data divided into 1 sec bins. Red curve is a Poisson curve with rate = median count rate of data. |
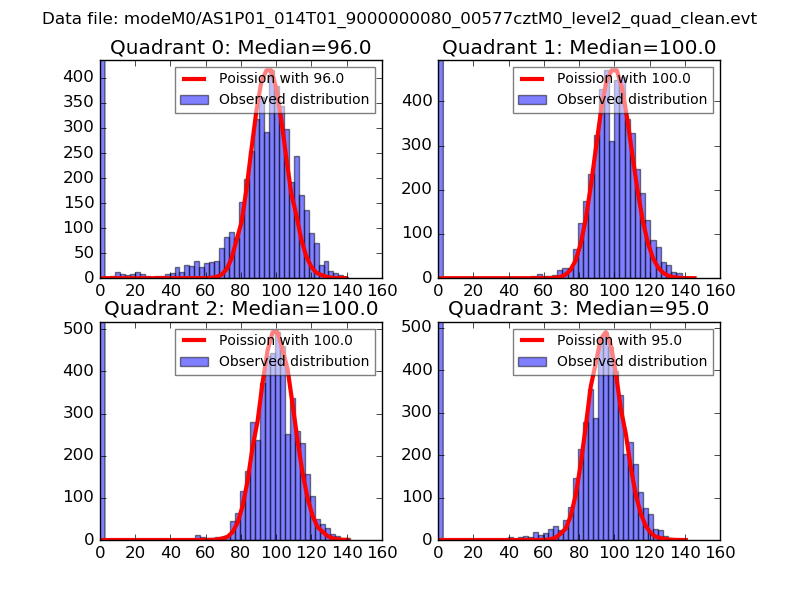 |
 |
| Quadrant-wise count rates Data is divided into 100 sec bins |
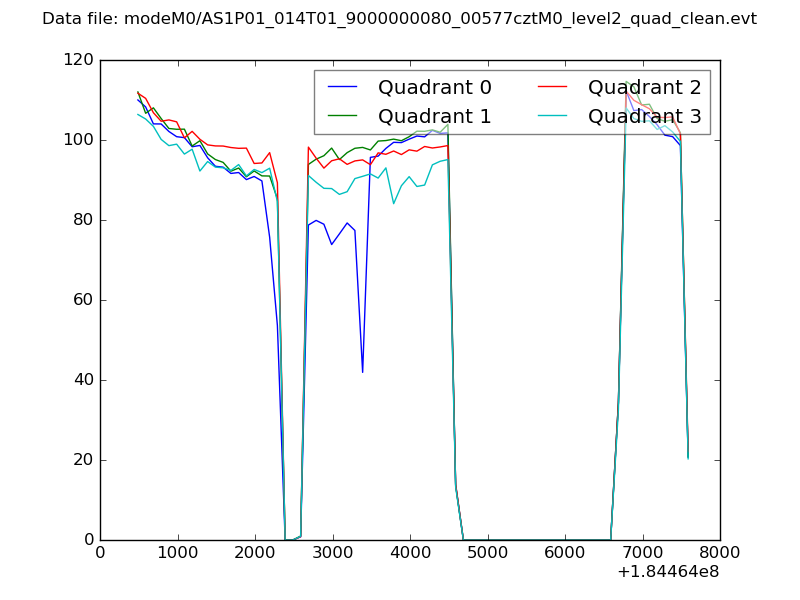 |
|
| Module-wise count rates for Quadrant A Data is divided into 100 sec bins |
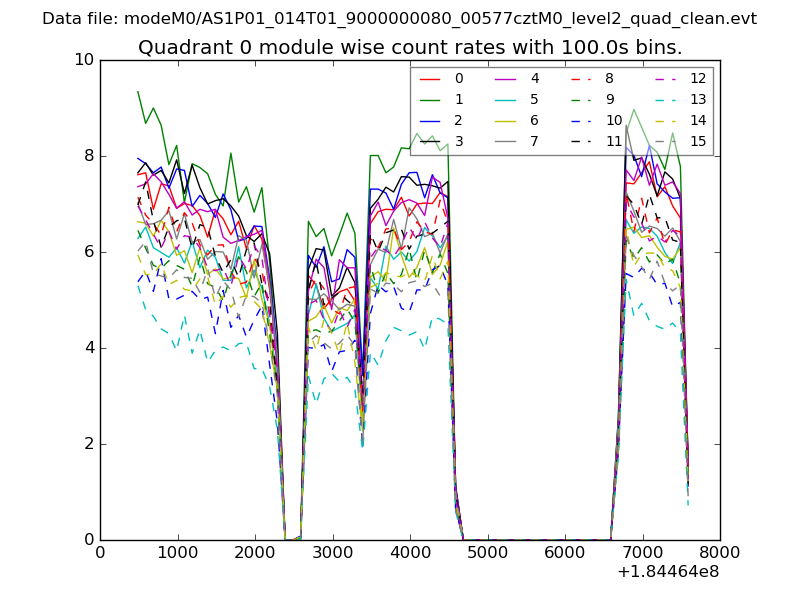 |
 |
| Module-wise count rates for Quadrant B Data is divided into 100 sec bins |
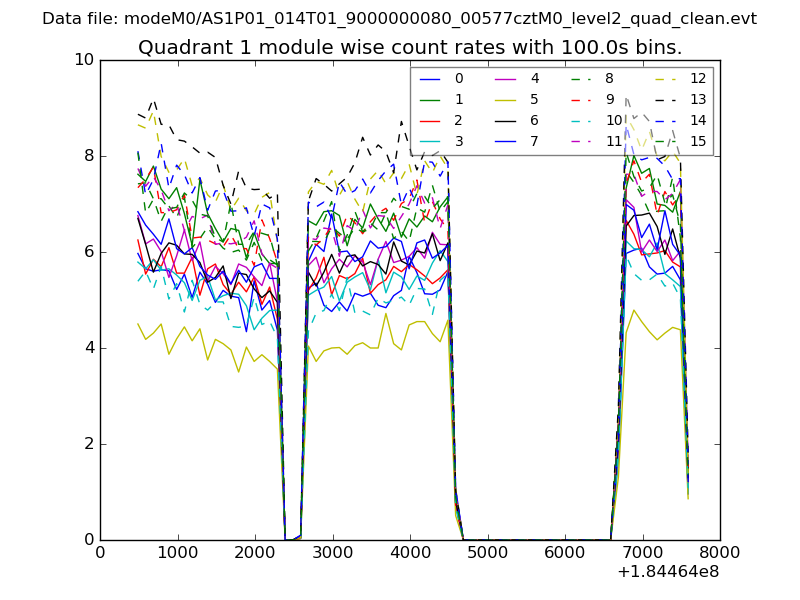 |
 |
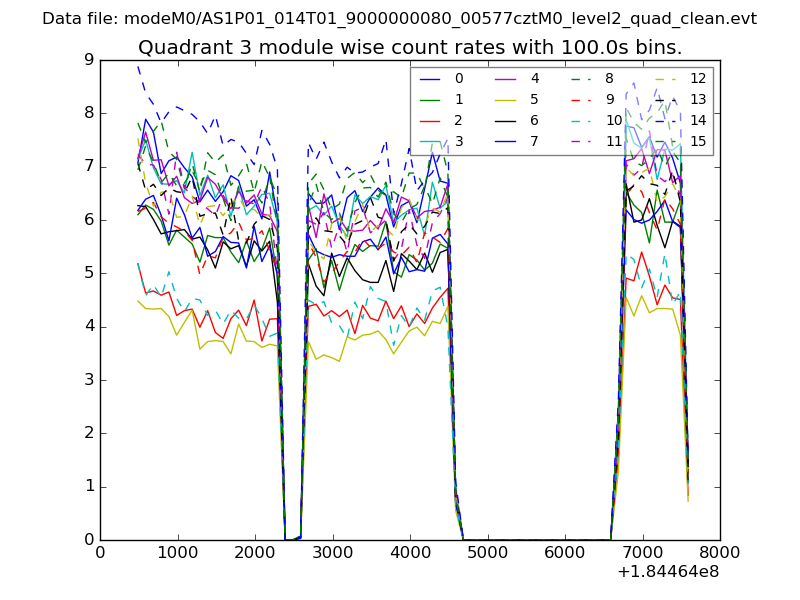
| Module-wise count rates for Quadrant C Data is divided into 100 sec bins |
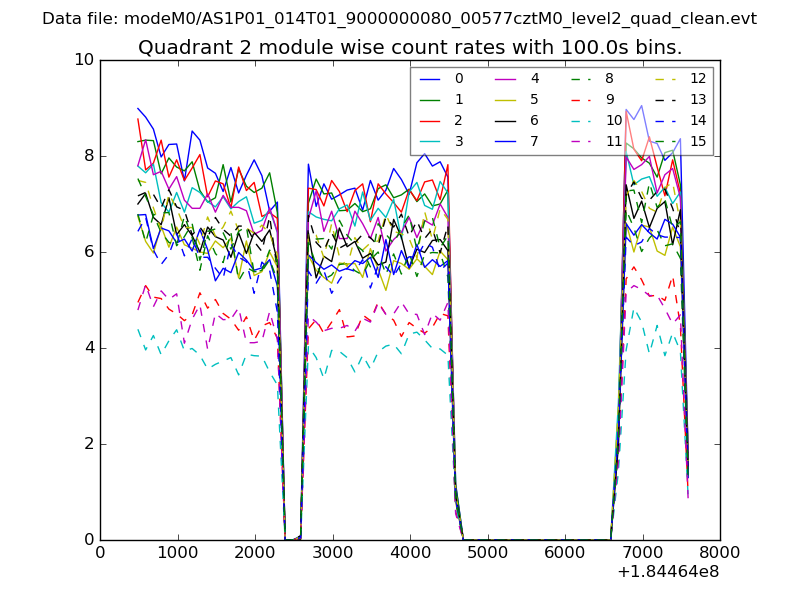 |
 |
| Module-wise count rates for Quadrant D Data is divided into 100 sec bins |
 |
 |
| Parameter | Plot |
|---|---|
| CZT HV Monitor | 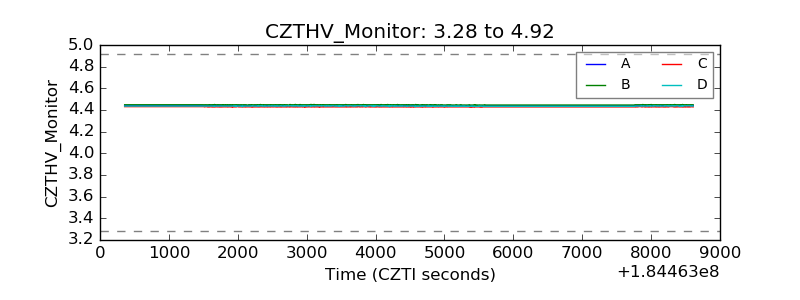 |
| D_VDD |  |
| Temperature 1 | 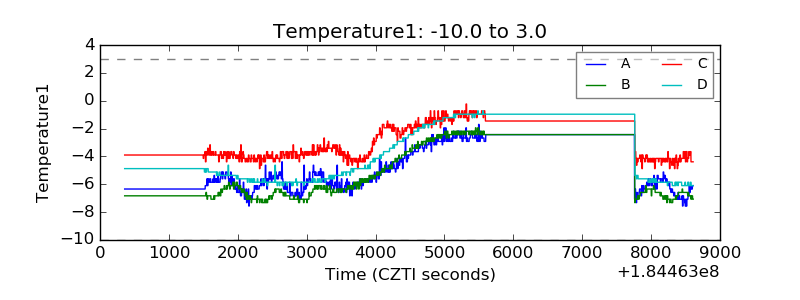 |
| Veto HV Monitor | 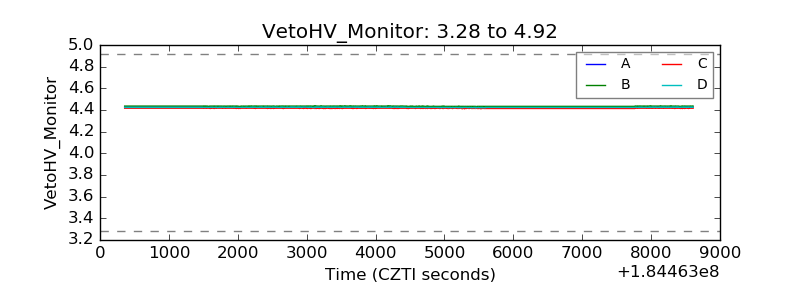 |
| Veto LLD | 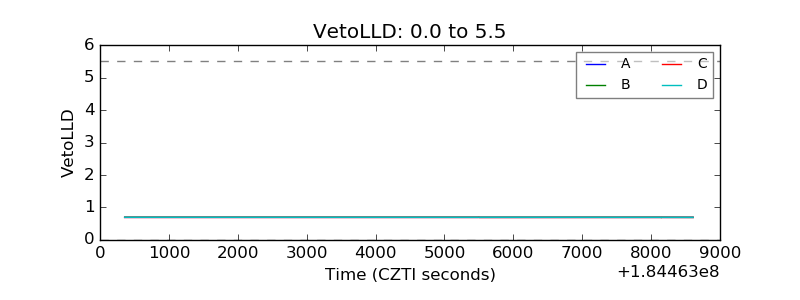 |
| Alpha Counter | 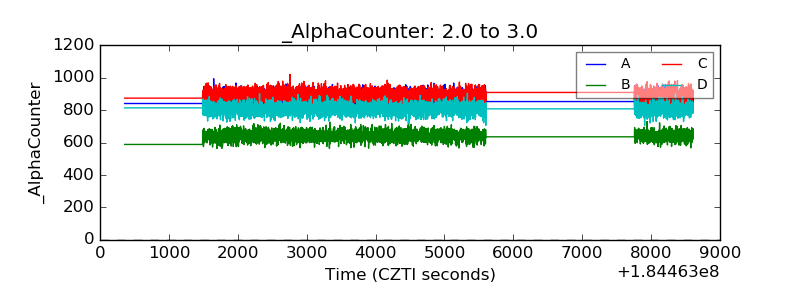 |
| _CPM_Rate | 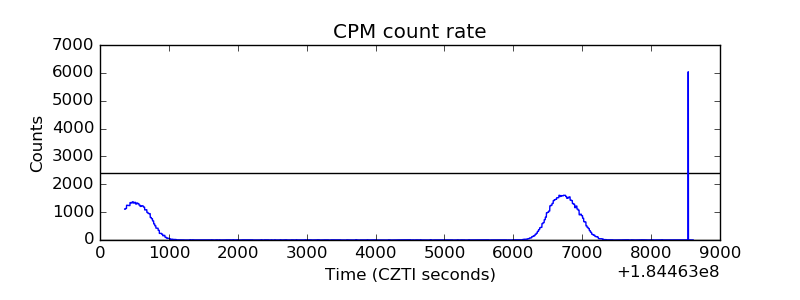 |
| CZT Counter |  |
| +2.5 Volts monitor |  |
| +5 Volts monitor |  |
| _ROLL_ROT | 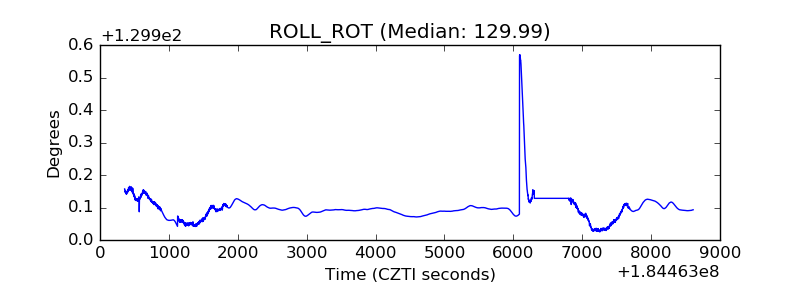 |
| _Roll_DEC | 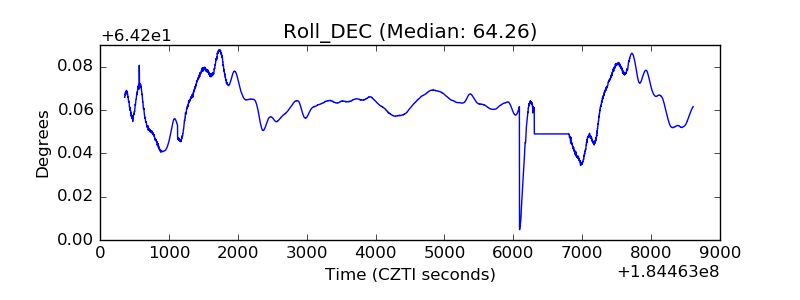 |
| _Roll_RA | 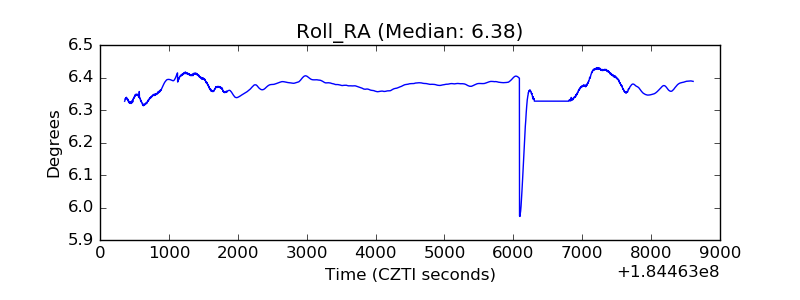 |
| Veto Counter | 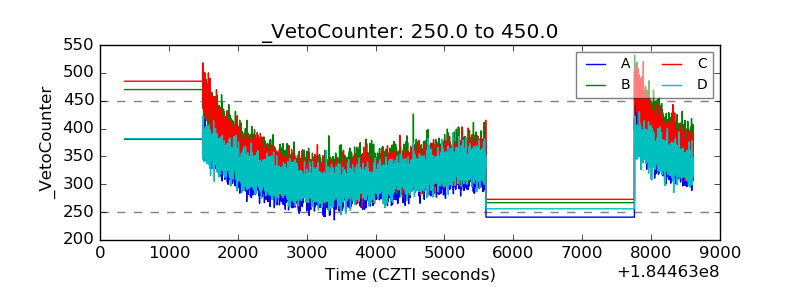 |