| Param | Original file | Final file |
|---|---|---|
| Filename | modeM0/AS1P01_014T01_9000000080_00578cztM0_level2.evt | modeM0/AS1P01_014T01_9000000080_00578cztM0_level2_quad_clean.evt |
| Size (bytes) | 832,711,680 | 77,077,440 |
| Size | 794.1 MB | 73.5 MB |
| Events in quadrant A | 6,468,489 | 491,798 |
| Events in quadrant B | 6,591,983 | 500,013 |
| Events in quadrant C | 5,709,436 | 495,128 |
| Events in quadrant D | 6,094,513 | 473,996 |
| Mode M0 | |||
|---|---|---|---|
| Quadrant | BADHDUFLAG | Total packets | Discarded packets |
| A | 0 | 23016 | 3 |
| B | 0 | 23346 | 2 |
| C | 0 | 20749 | 2 |
| D | 0 | 21893 | 2 |
| Mode M9 | |||
|---|---|---|---|
| Quadrant | BADHDUFLAG | Total packets | Discarded packets |
| A | 0 | 30 | 0 |
| B | 0 | 30 | 0 |
| C | 0 | 30 | 0 |
| D | 0 | 31 | 0 |
| Mode SS | |||
|---|---|---|---|
| Quadrant | BADHDUFLAG | Total packets | Discarded packets |
| A | 0 | 108 | 0 |
| B | 0 | 108 | 0 |
| C | 0 | 108 | 0 |
| D | 0 | 108 | 0 |
| Quadrant | Total seconds | Saturated seconds | Saturation percentage |
|---|---|---|---|
| A | 5329 | 18 | 0.337774% |
| B | 5329 | 47 | 0.881967% |
| C | 5329 | 4 | 0.075061% |
| D | 5329 | 34 | 0.638018% |
Noise dominated data is calculated using 1-second bins in cleaned event files. If a bin has >2000 counts, and if more than 50% of those come from <1% of pixels, then it is considered to be noise-dominated and hence unusable.
| Quadrant | # 1 sec bins | Bins with >0 counts | Bins with >2000 counts | High rate bins dominated by noise | Noise dominated (total time) | Noise dominated (detector-on time) | Marked lightcurve |
|---|---|---|---|---|---|---|---|
| A | 7483 | 5330 | 144 | 144 | 1.92% | 2.70% | 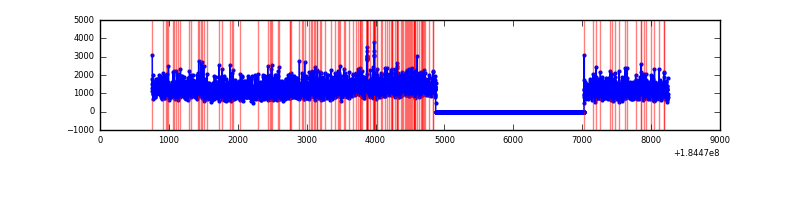 |
| B | 7483 | 5330 | 185 | 185 | 2.47% | 3.47% | 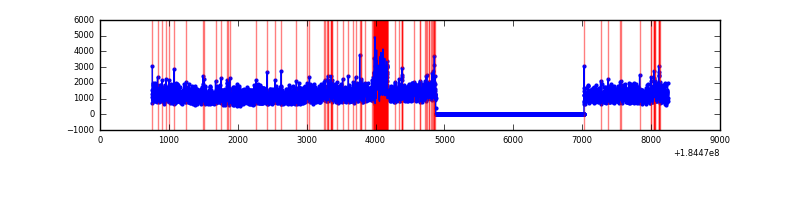 |
| C | 7483 | 5330 | 34 | 34 | 0.45% | 0.64% |  |
| D | 7483 | 5330 | 191 | 191 | 2.55% | 3.58% | 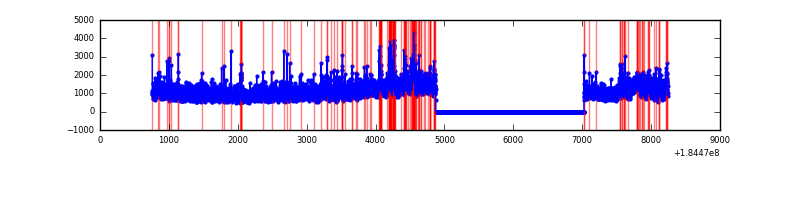 |
Top three noisy pixels from each quadrant. If the there are fewer than three noisy pixels in the level2.evt file, extra rows are filled as -1
| Pixel properties | Quadrant properties | ||||||
|---|---|---|---|---|---|---|---|
| Quadrant | DetID | PixID | Counts | Sigma | Mean | Median | Sigma |
| A | 0 | 149 | 119046 | 324.44 | 1615 | 1601 | 362.0 |
| A | 15 | 17 | 35739 | 94.3 | 1615 | 1601 | 362.0 |
| A | 0 | 238 | 34304 | 90.34 | 1615 | 1601 | 362.0 |
| B | 5 | 251 | 210616 | 549.96 | 1617 | 1628 | 380.0 |
| B | 6 | 202 | 61908 | 158.63 | 1617 | 1628 | 380.0 |
| B | 4 | 206 | 58209 | 148.9 | 1617 | 1628 | 380.0 |
| C | 15 | 241 | 39736 | 95.63 | 1433 | 1483 | 400.0 |
| C | 5 | 249 | 14251 | 31.92 | 1433 | 1483 | 400.0 |
| C | 9 | 241 | 13125 | 29.11 | 1433 | 1483 | 400.0 |
| D | 1 | 4 | 516208 | 1207.89 | 1369 | 1423 | 426.2 |
| D | 12 | 237 | 80995 | 186.71 | 1369 | 1423 | 426.2 |
| D | 13 | 221 | 77349 | 178.15 | 1369 | 1423 | 426.2 |
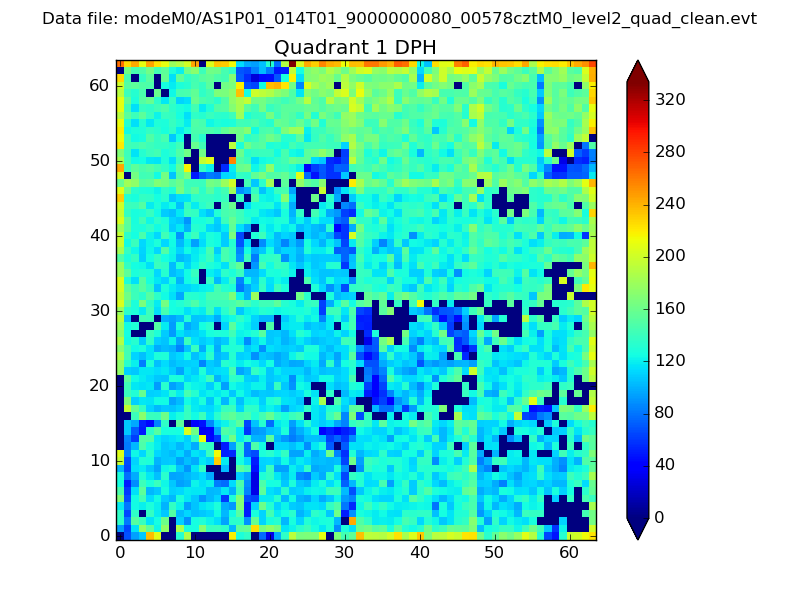
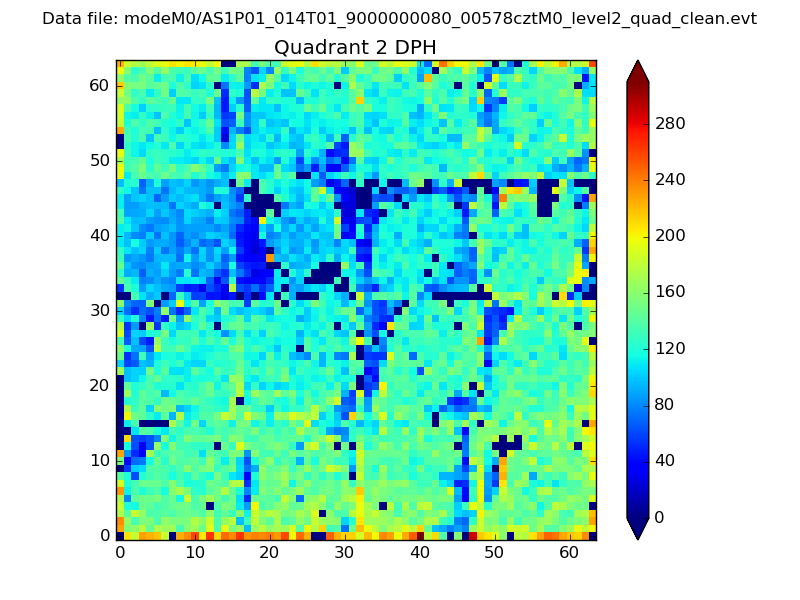
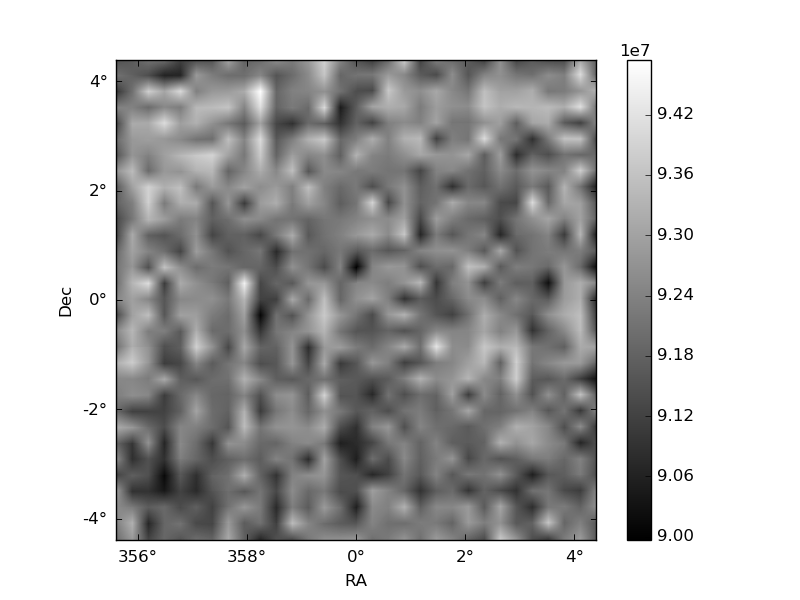
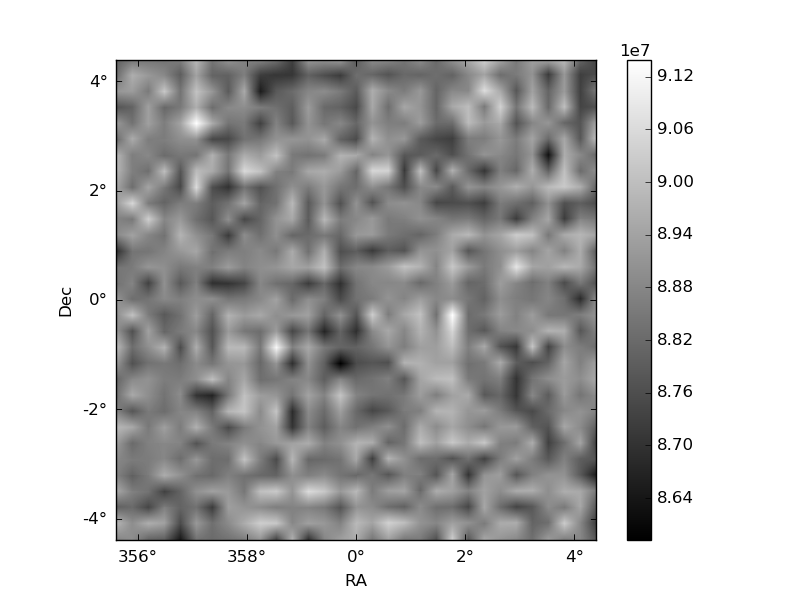
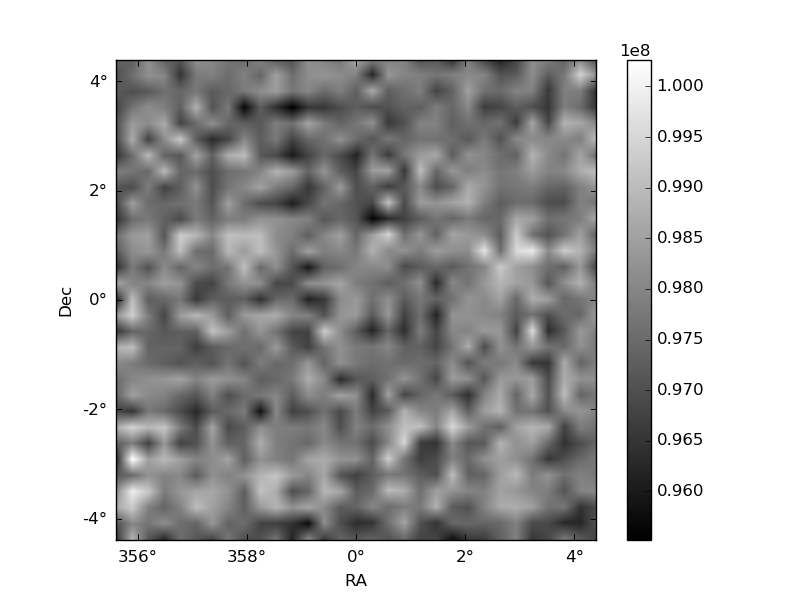
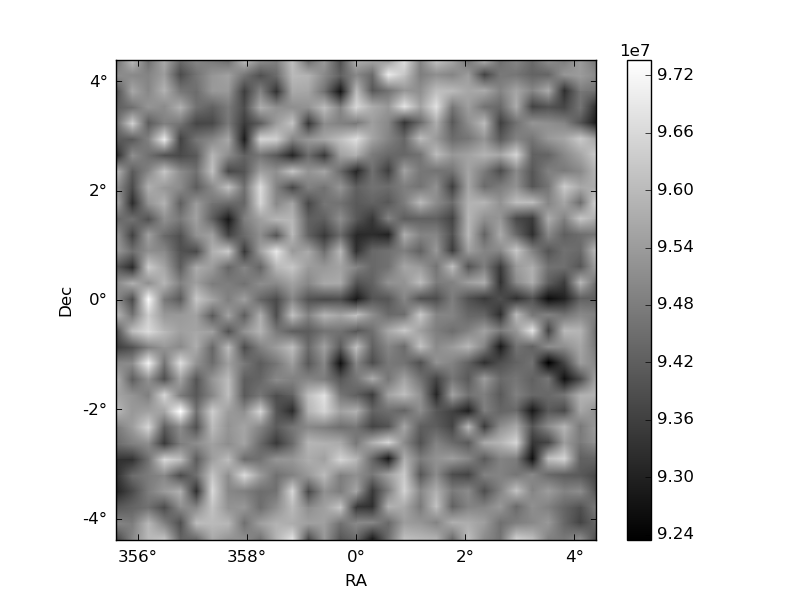
Histogram calculated using DETX and DETY for each event in the final _common_clean file
| Quadrant A | 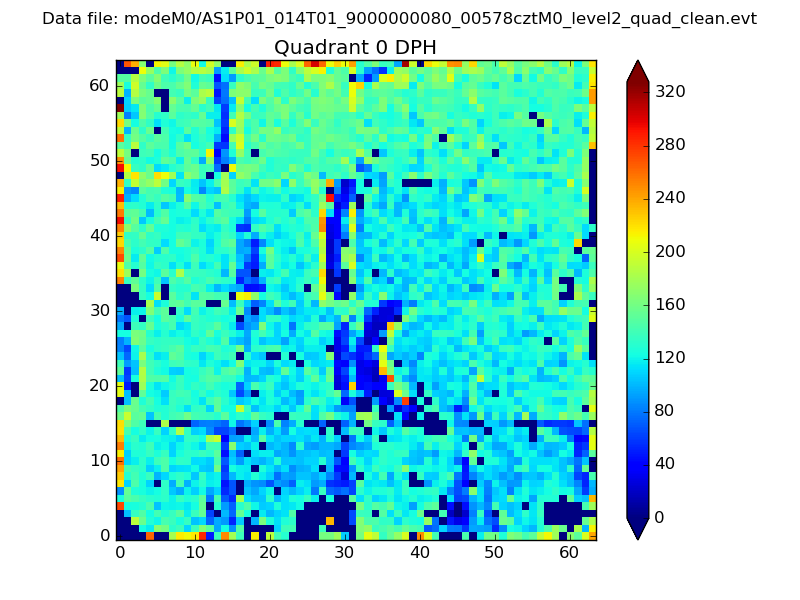 |
 |
Quadrant B |
|---|---|---|---|
| Quadrant D | 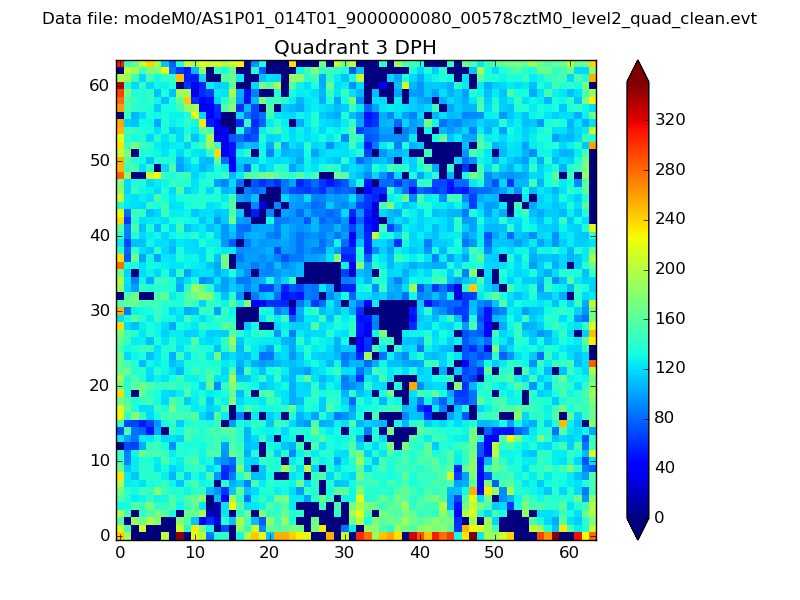 |
 |
Quadrant C |
| Plot type | Count rate plots | Images |
|---|---|---|
| Comparison with Poisson distribution Blue bars denote a histogram of data divided into 1 sec bins. Red curve is a Poisson curve with rate = median count rate of data. |
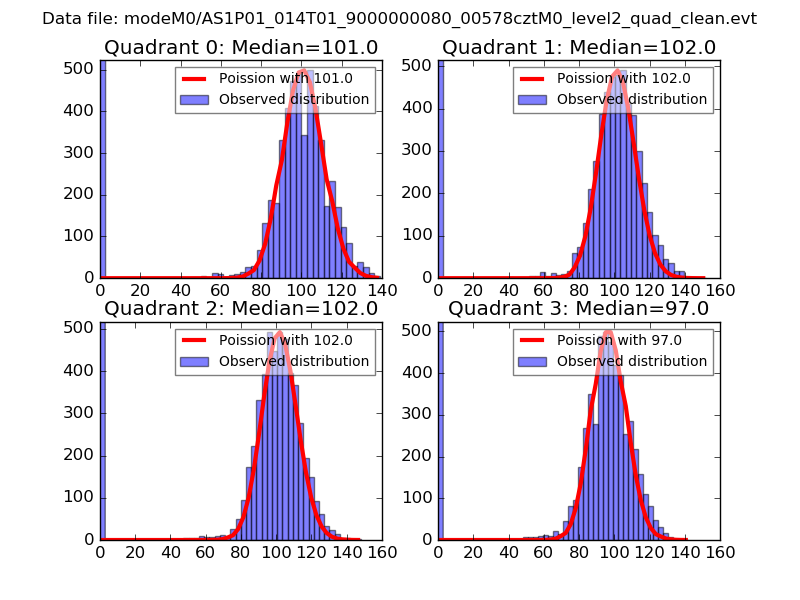 |
 |
| Quadrant-wise count rates Data is divided into 100 sec bins |
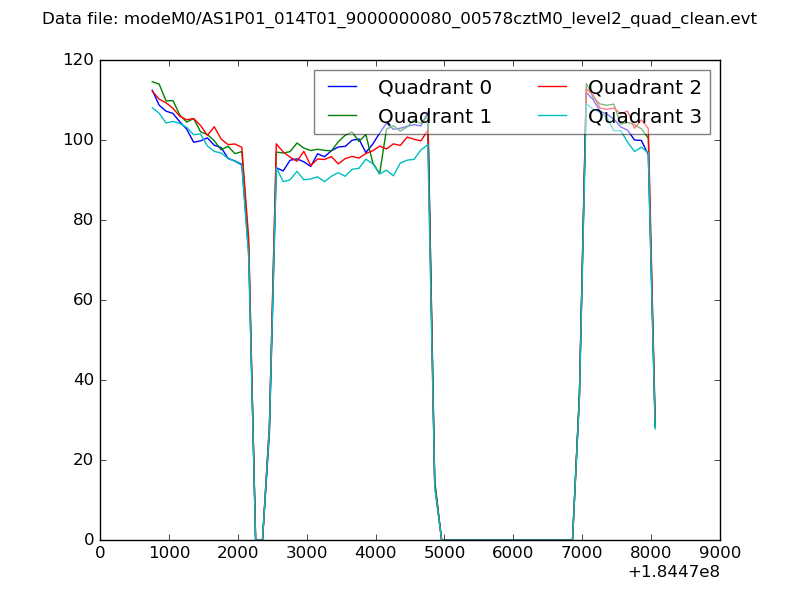 |
|
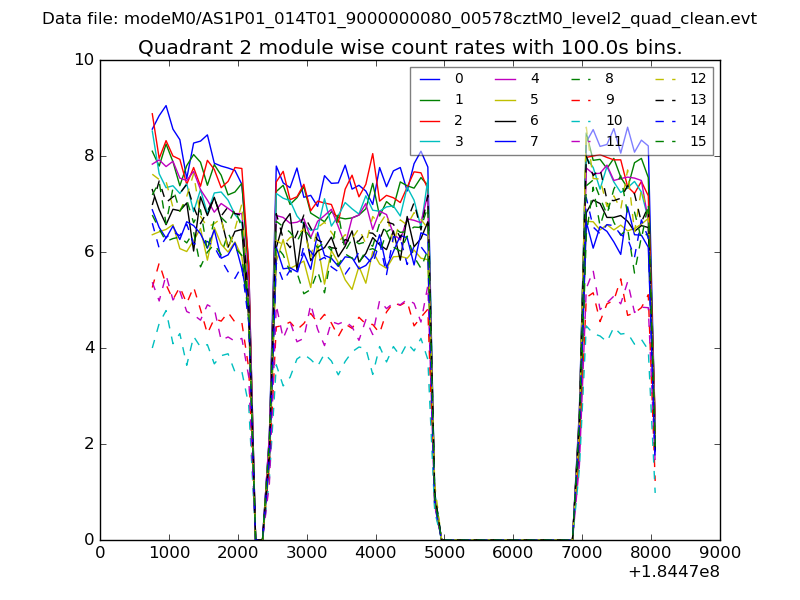
| Module-wise count rates for Quadrant A Data is divided into 100 sec bins |
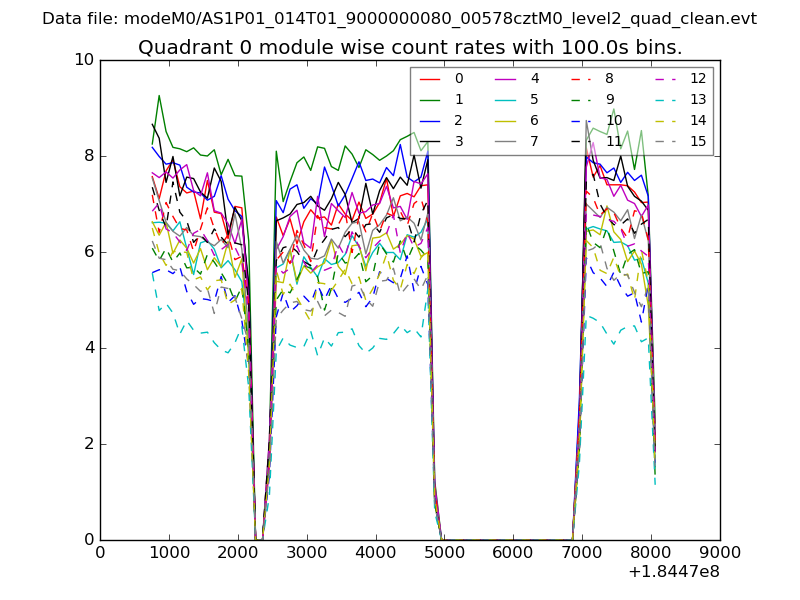 |
 |
| Module-wise count rates for Quadrant B Data is divided into 100 sec bins |
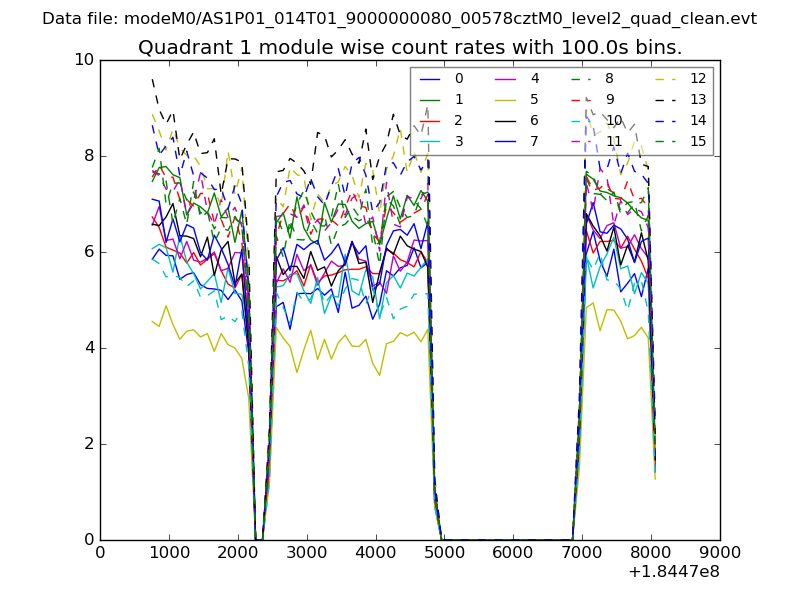 |
 |
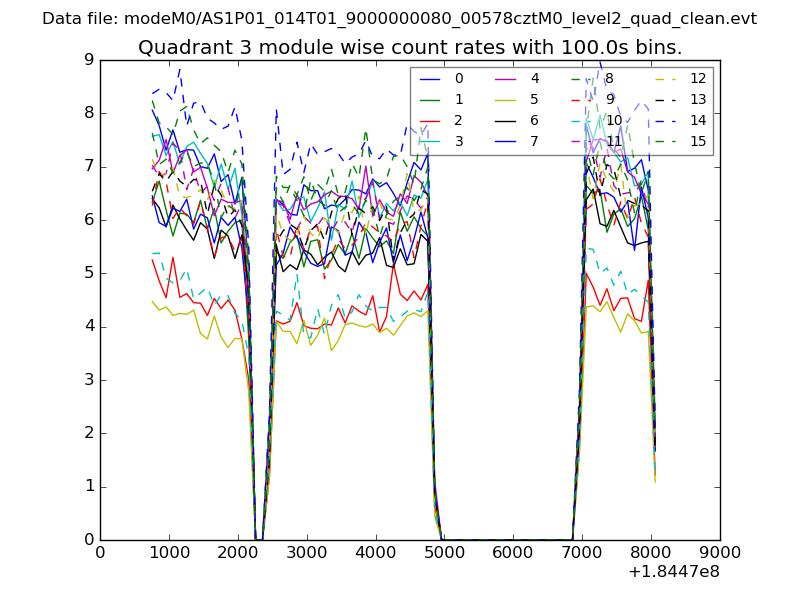
| Module-wise count rates for Quadrant C Data is divided into 100 sec bins |
 |
 |
| Module-wise count rates for Quadrant D Data is divided into 100 sec bins |
 |
 |
| Parameter | Plot |
|---|---|
| CZT HV Monitor | 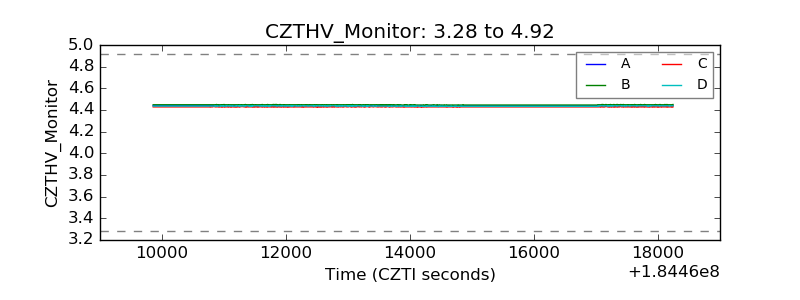 |
| D_VDD | 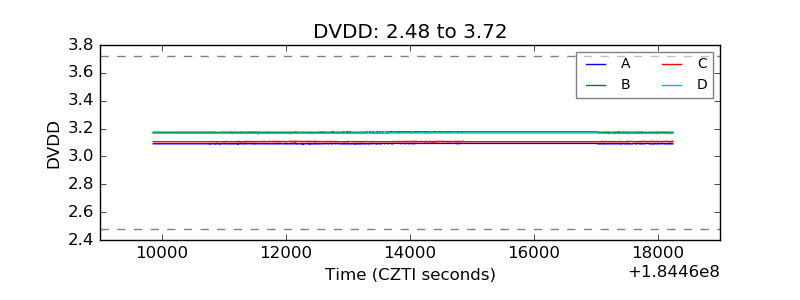 |
| Temperature 1 | 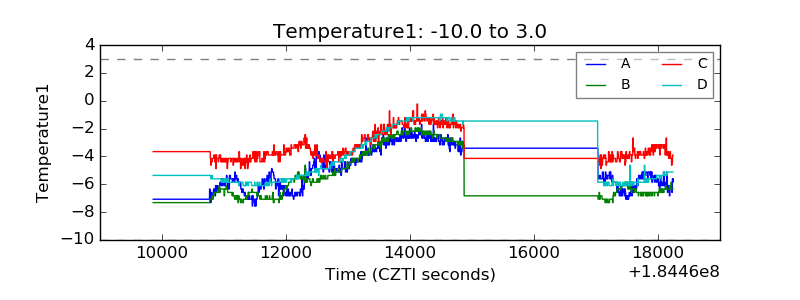 |
| Veto HV Monitor | 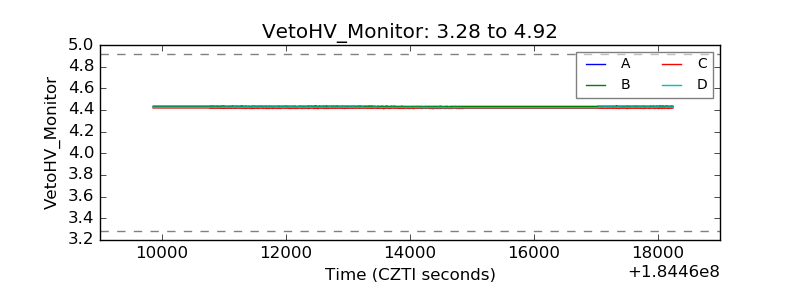 |
| Veto LLD | 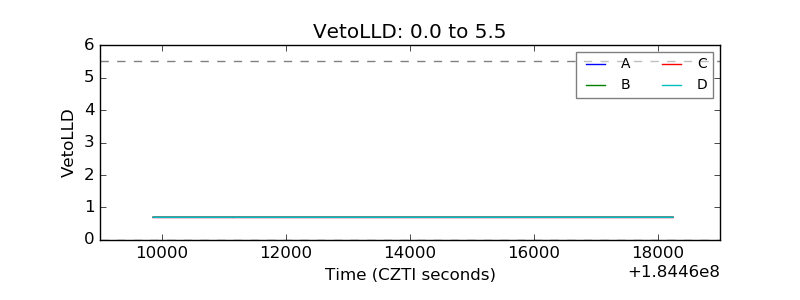 |
| Alpha Counter | 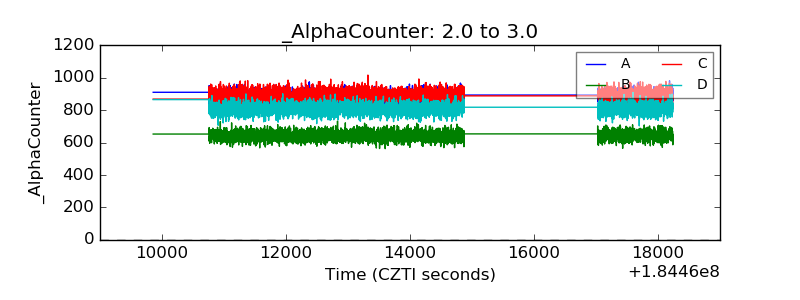 |
| _CPM_Rate | 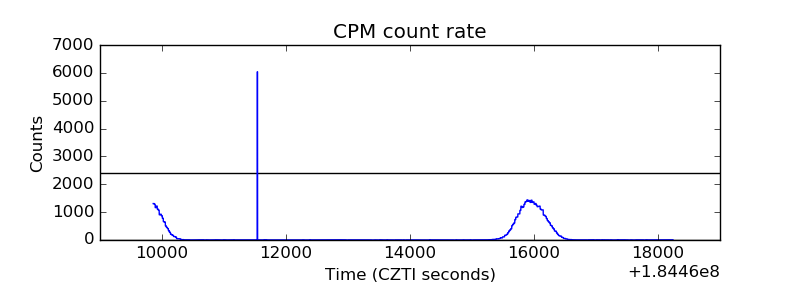 |
| CZT Counter |  |
| +2.5 Volts monitor |  |
| +5 Volts monitor |  |
| _ROLL_ROT | 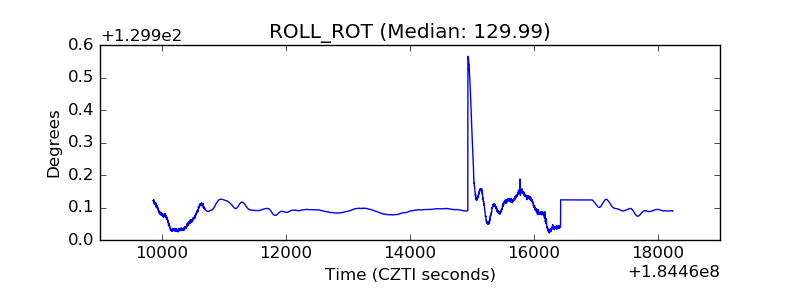 |
| _Roll_DEC | 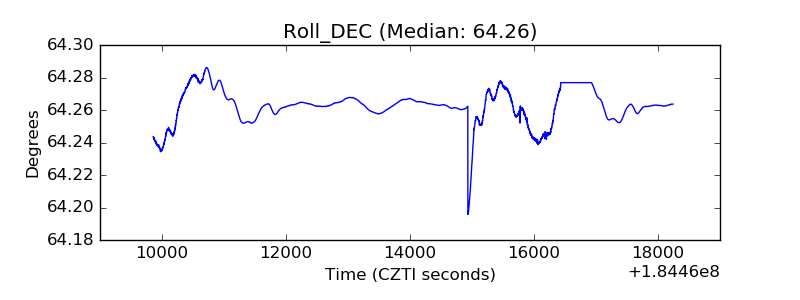 |
| _Roll_RA |  |
| Veto Counter | 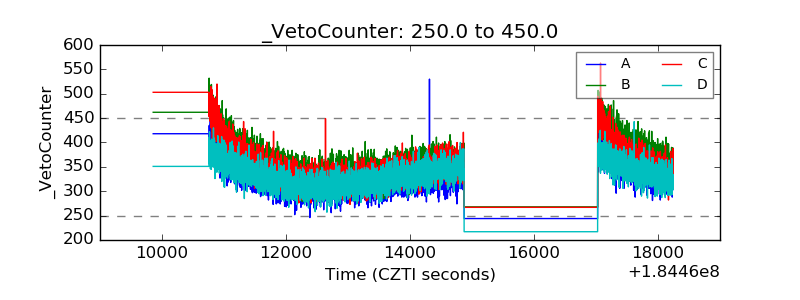 |