| Param | Original file | Final file |
|---|---|---|
| Filename | modeM0/AS1P01_014T01_9000000080_00579cztM0_level2.evt | modeM0/AS1P01_014T01_9000000080_00579cztM0_level2_quad_clean.evt |
| Size (bytes) | 700,606,080 | 59,771,520 |
| Size | 668.2 MB | 57.0 MB |
| Events in quadrant A | 5,653,809 | 378,363 |
| Events in quadrant B | 4,866,768 | 394,283 |
| Events in quadrant C | 4,438,050 | 385,536 |
| Events in quadrant D | 5,985,501 | 361,493 |
| Mode M0 | |||
|---|---|---|---|
| Quadrant | BADHDUFLAG | Total packets | Discarded packets |
| A | 0 | 19767 | 1 |
| B | 0 | 17392 | 1 |
| C | 0 | 16120 | 1 |
| D | 0 | 20661 | 1 |
| Mode M9 | |||
|---|---|---|---|
| Quadrant | BADHDUFLAG | Total packets | Discarded packets |
| A | 0 | 1 | 0 |
| B | 0 | 1 | 0 |
| C | 0 | 1 | 0 |
| D | 0 | 2 | 0 |
| Mode SS | |||
|---|---|---|---|
| Quadrant | BADHDUFLAG | Total packets | Discarded packets |
| A | 0 | 84 | 0 |
| B | 0 | 84 | 0 |
| C | 0 | 84 | 0 |
| D | 0 | 84 | 0 |
| Quadrant | Total seconds | Saturated seconds | Saturation percentage |
|---|---|---|---|
| A | 4115 | 259 | 6.294046% |
| B | 4115 | 2 | 0.048603% |
| C | 4115 | 2 | 0.048603% |
| D | 4115 | 106 | 2.575942% |
Noise dominated data is calculated using 1-second bins in cleaned event files. If a bin has >2000 counts, and if more than 50% of those come from <1% of pixels, then it is considered to be noise-dominated and hence unusable.
| Quadrant | # 1 sec bins | Bins with >0 counts | Bins with >2000 counts | High rate bins dominated by noise | Noise dominated (total time) | Noise dominated (detector-on time) | Marked lightcurve |
|---|---|---|---|---|---|---|---|
| A | 4115 | 4115 | 451 | 451 | 10.96% | 10.96% | 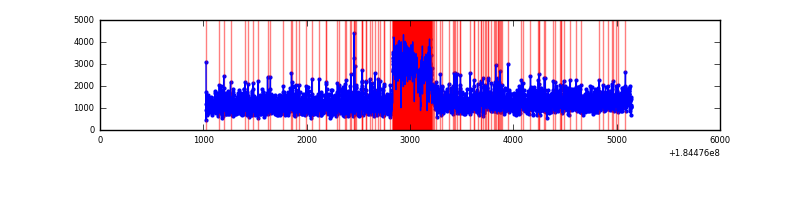 |
| B | 4115 | 4115 | 40 | 40 | 0.97% | 0.97% | 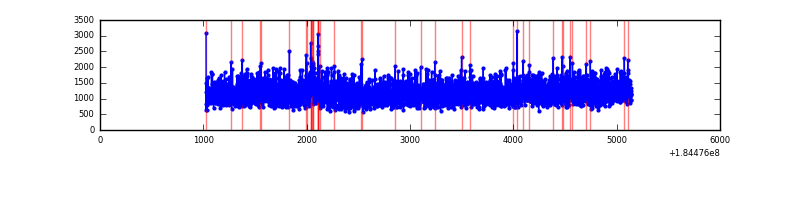 |
| C | 4115 | 4115 | 33 | 33 | 0.80% | 0.80% | 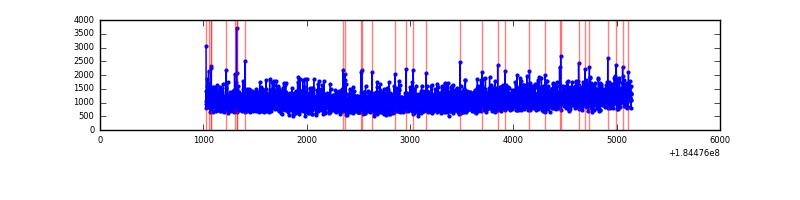 |
| D | 4115 | 4115 | 514 | 514 | 12.49% | 12.49% | 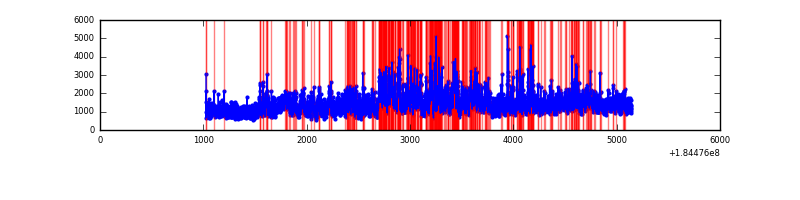 |
Top three noisy pixels from each quadrant. If the there are fewer than three noisy pixels in the level2.evt file, extra rows are filled as -1
| Pixel properties | Quadrant properties | ||||||
|---|---|---|---|---|---|---|---|
| Quadrant | DetID | PixID | Counts | Sigma | Mean | Median | Sigma |
| A | 0 | 149 | 715268 | 2547.7 | 1256 | 1245 | 280.3 |
| A | 0 | 69 | 43774 | 151.75 | 1256 | 1245 | 280.3 |
| A | 0 | 238 | 31447 | 107.76 | 1256 | 1245 | 280.3 |
| B | 5 | 251 | 40108 | 131.64 | 1247 | 1255 | 295.1 |
| B | 4 | 235 | 13994 | 43.16 | 1247 | 1255 | 295.1 |
| B | 4 | 206 | 11462 | 34.58 | 1247 | 1255 | 295.1 |
| C | 15 | 241 | 34724 | 108.87 | 1115 | 1153 | 308.3 |
| C | 9 | 241 | 17755 | 53.84 | 1115 | 1153 | 308.3 |
| C | 9 | 206 | 4690 | 11.47 | 1115 | 1153 | 308.3 |
| D | 1 | 4 | 1189020 | 3494.54 | 1094 | 1138 | 339.9 |
| D | 12 | 237 | 193417 | 565.65 | 1094 | 1138 | 339.9 |
| D | 13 | 51 | 83170 | 241.32 | 1094 | 1138 | 339.9 |
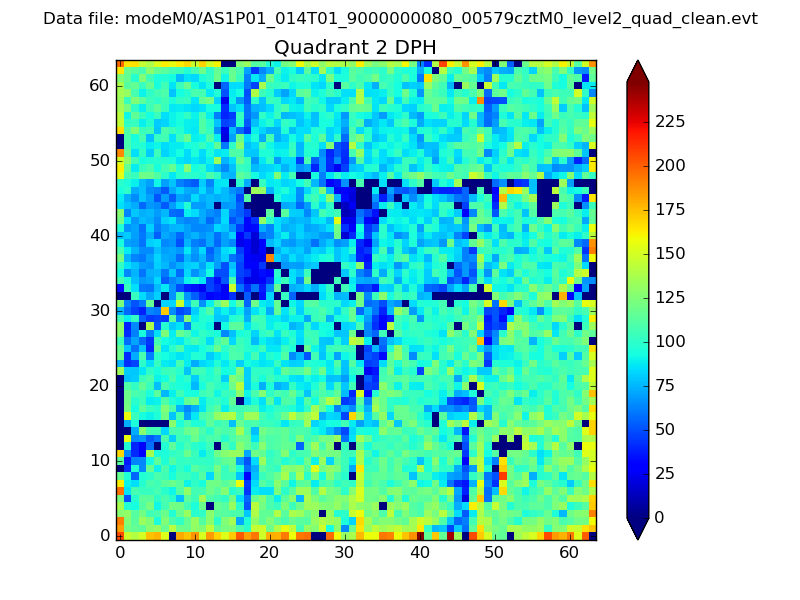
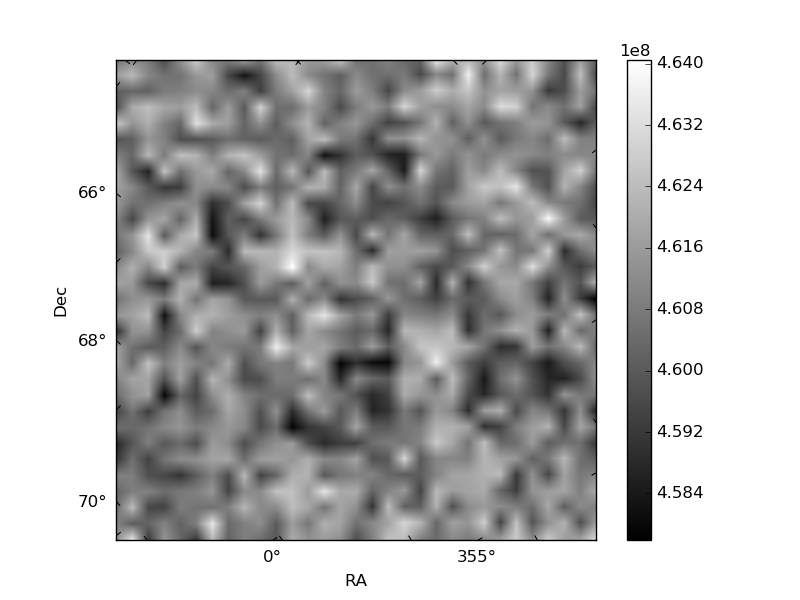
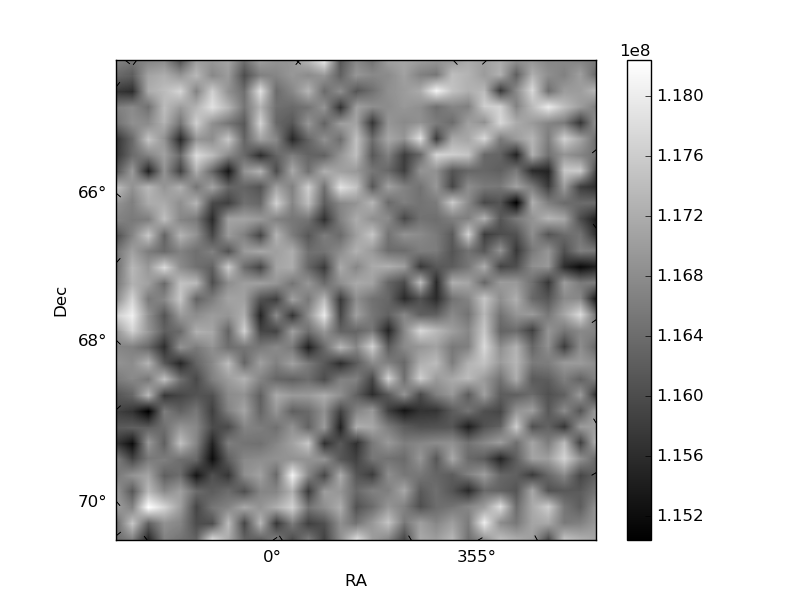
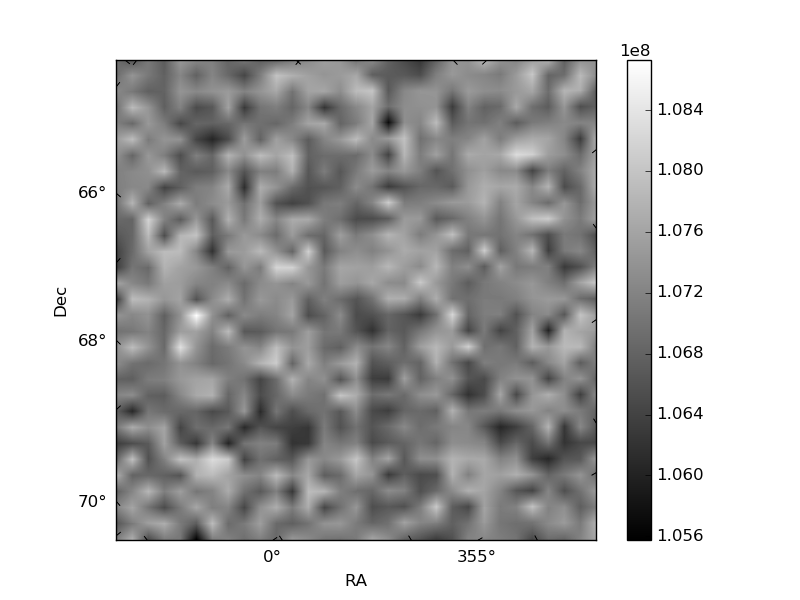
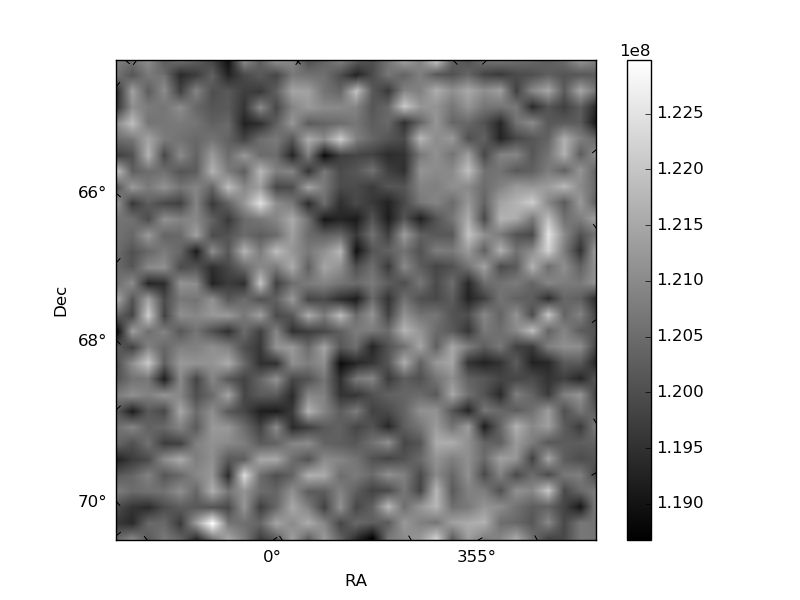
Histogram calculated using DETX and DETY for each event in the final _common_clean file
| Quadrant A | 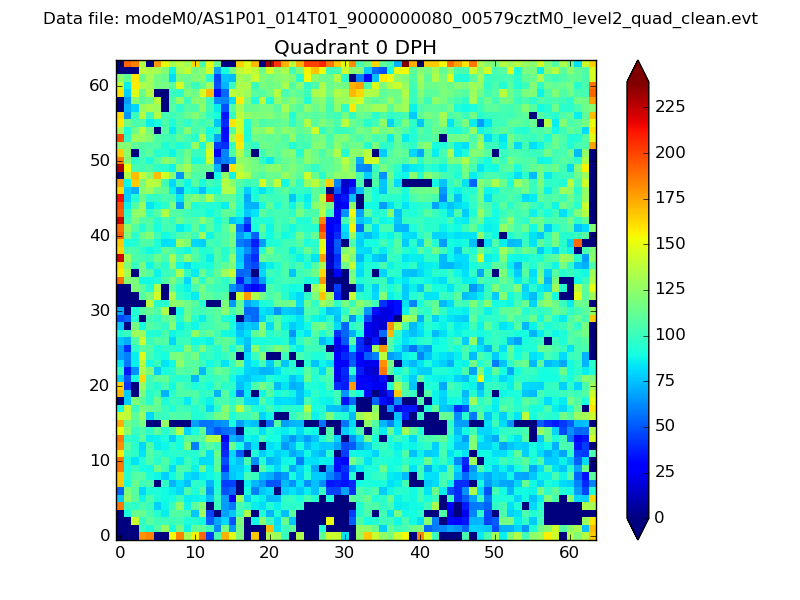 |
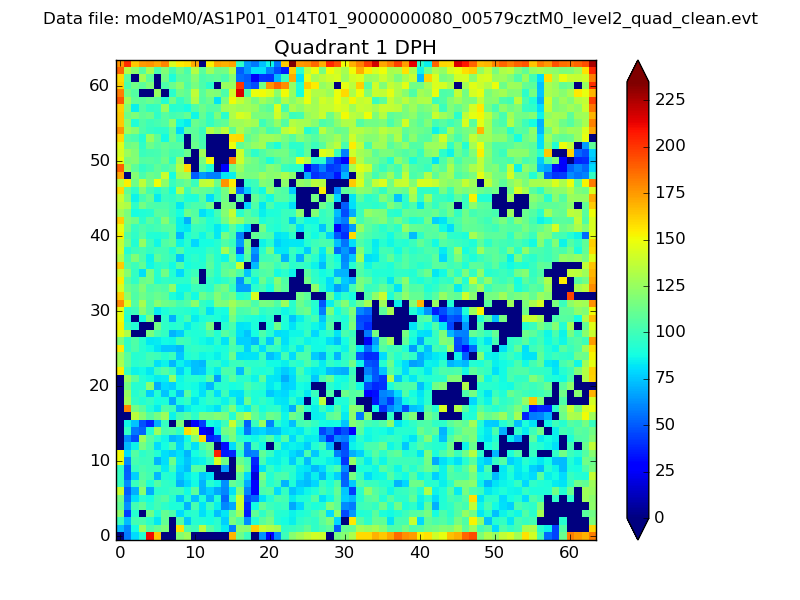 |
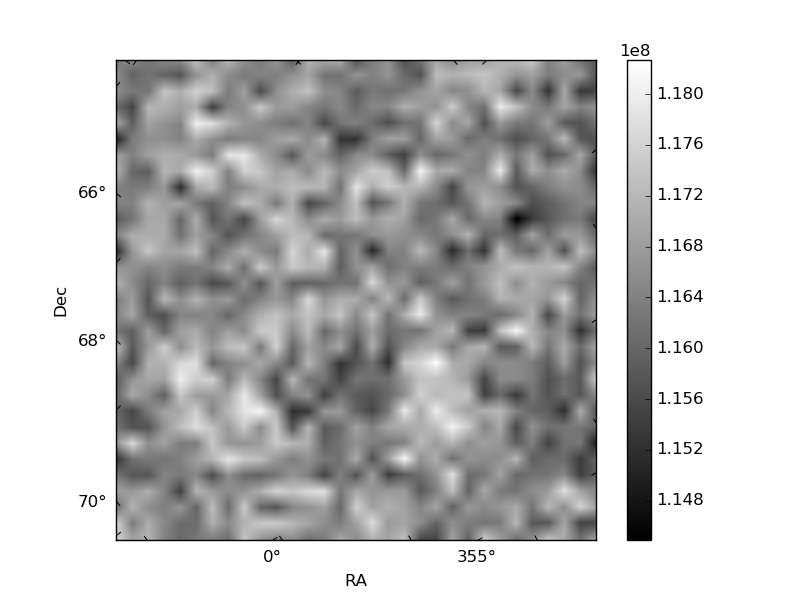
Quadrant B |
|---|---|---|---|
| Quadrant D | 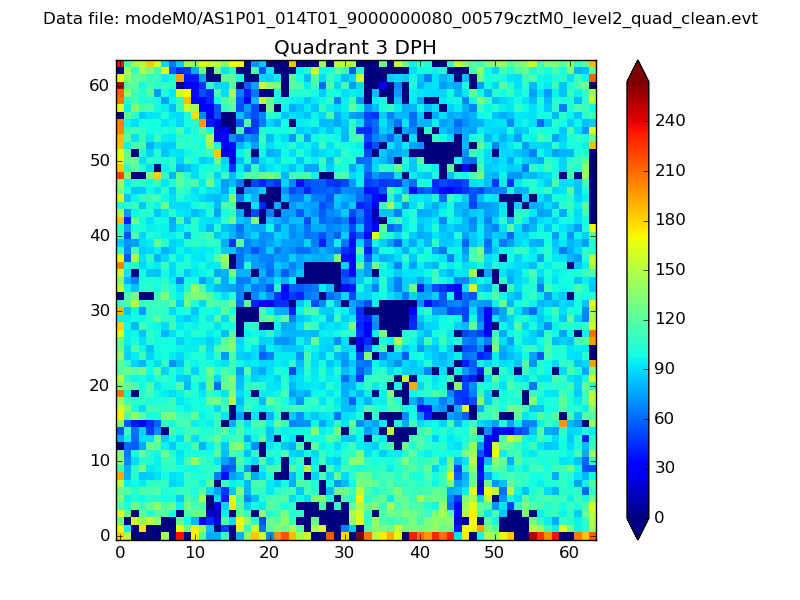 |
 |
Quadrant C |
| Plot type | Count rate plots | Images |
|---|---|---|
| Comparison with Poisson distribution Blue bars denote a histogram of data divided into 1 sec bins. Red curve is a Poisson curve with rate = median count rate of data. |
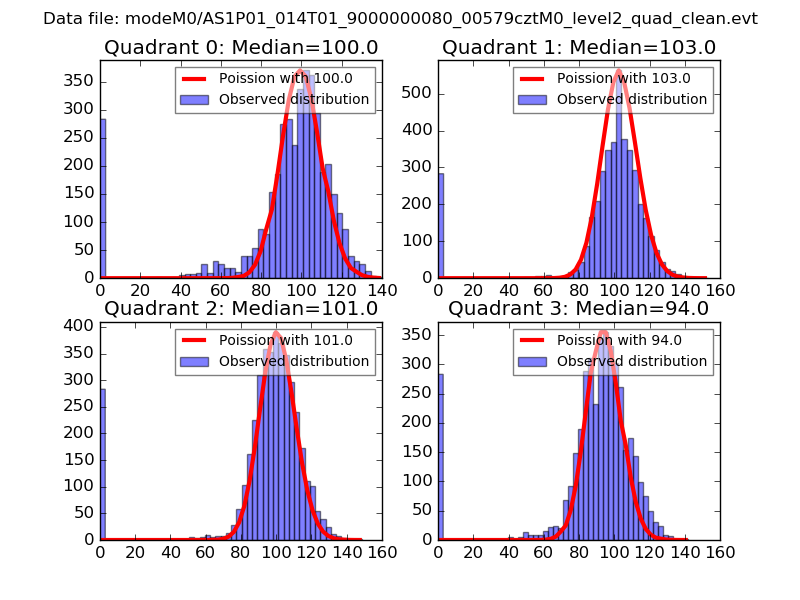 |
 |
| Quadrant-wise count rates Data is divided into 100 sec bins |
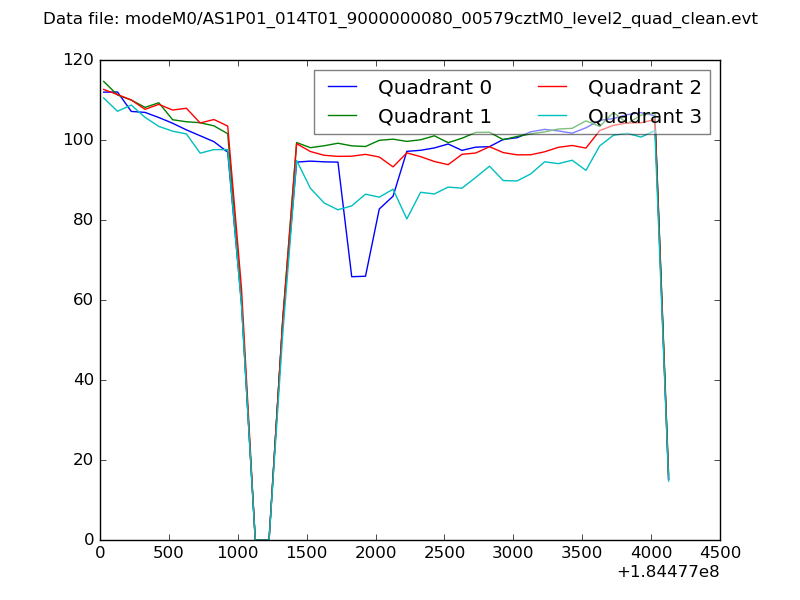 |
|
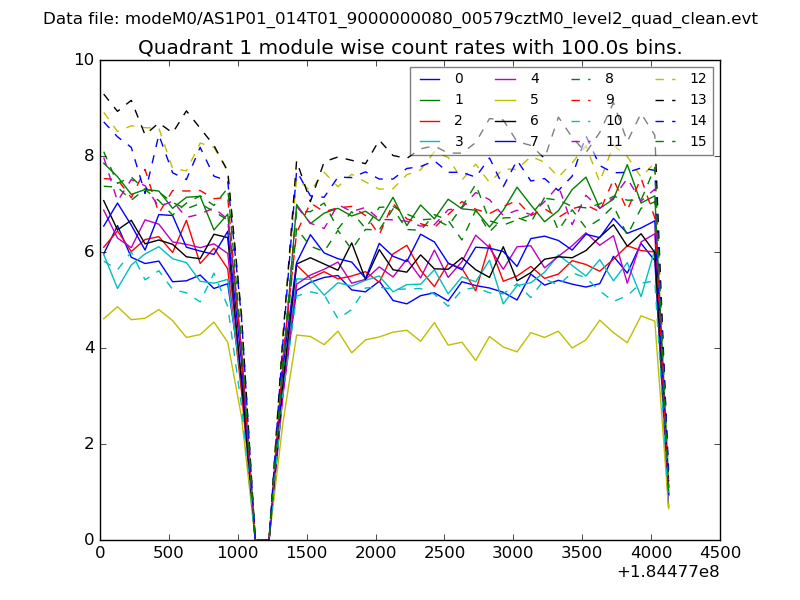
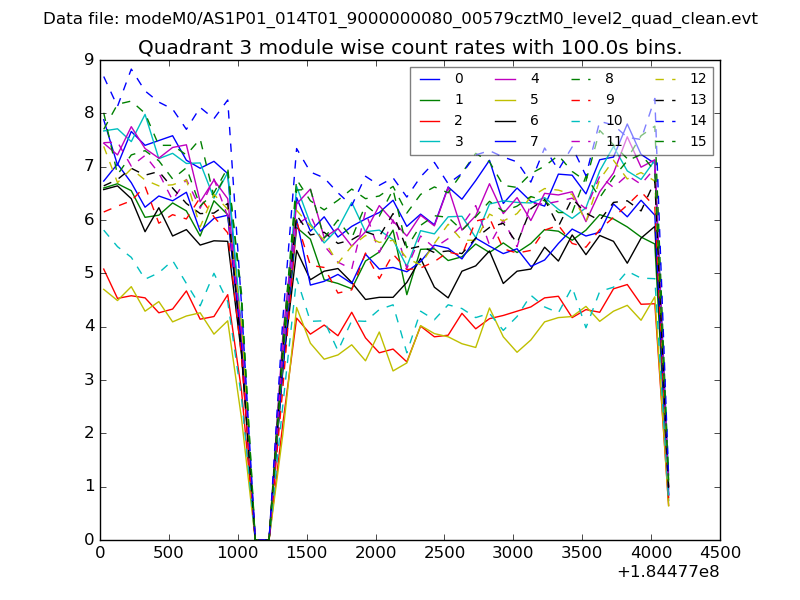
| Module-wise count rates for Quadrant A Data is divided into 100 sec bins |
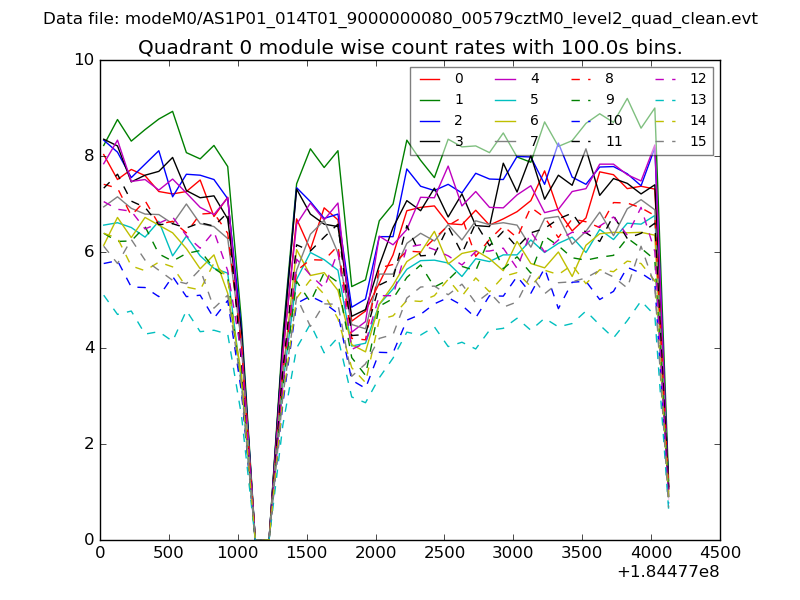 |
 |
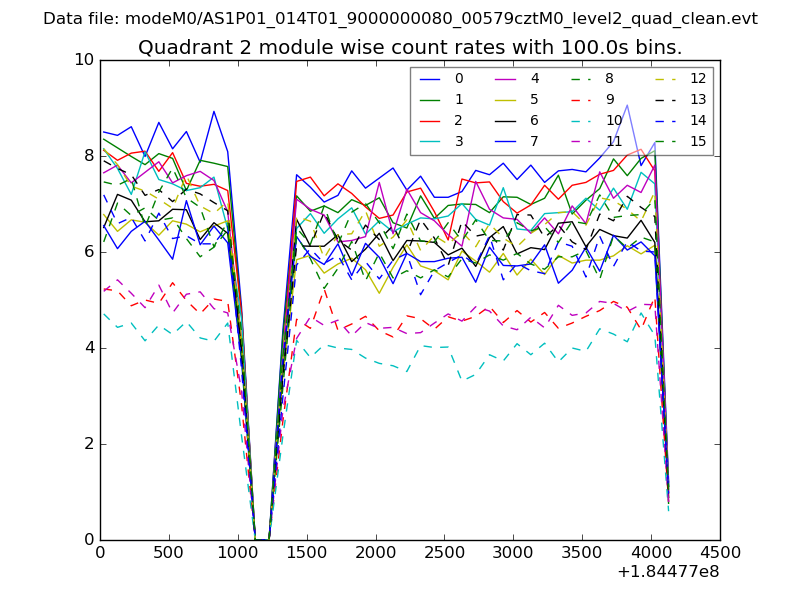
| Module-wise count rates for Quadrant B Data is divided into 100 sec bins |
 |
 |
| Module-wise count rates for Quadrant C Data is divided into 100 sec bins |
 |
 |
| Module-wise count rates for Quadrant D Data is divided into 100 sec bins |
 |
 |
| Parameter | Plot |
|---|---|
| CZT HV Monitor | 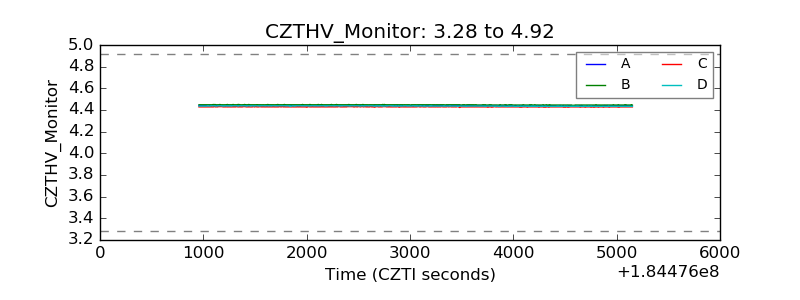 |
| D_VDD | 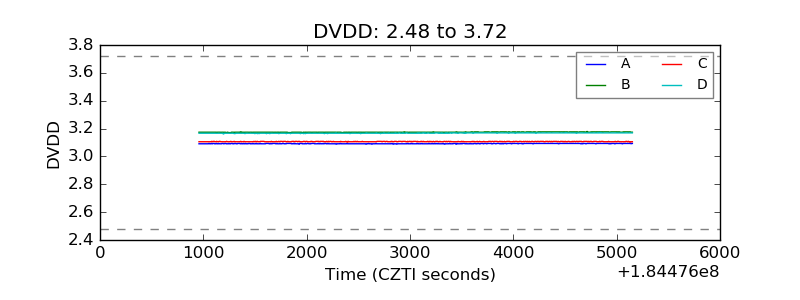 |
| Temperature 1 | 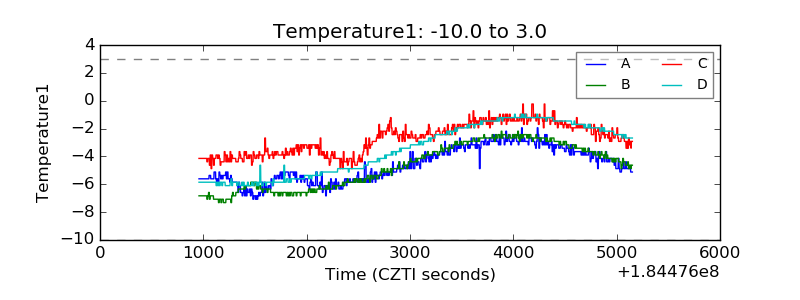 |
| Veto HV Monitor | 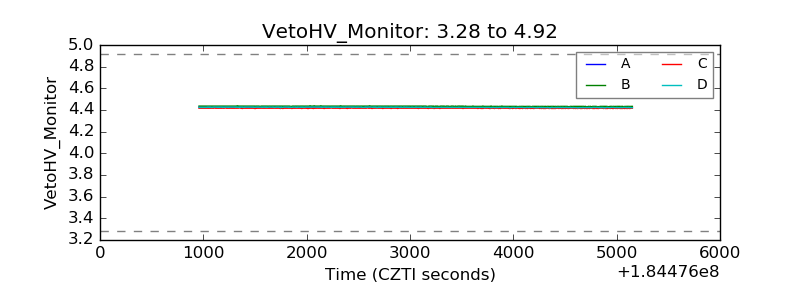 |
| Veto LLD | 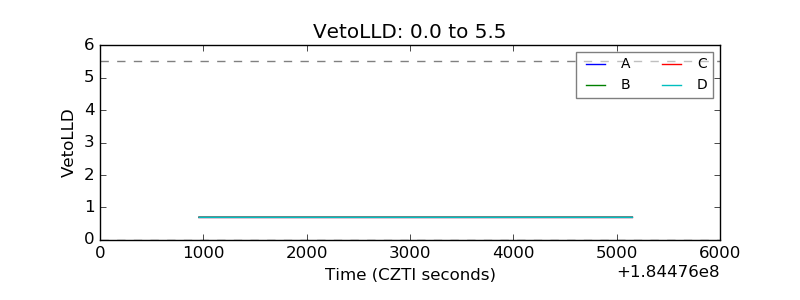 |
| Alpha Counter | 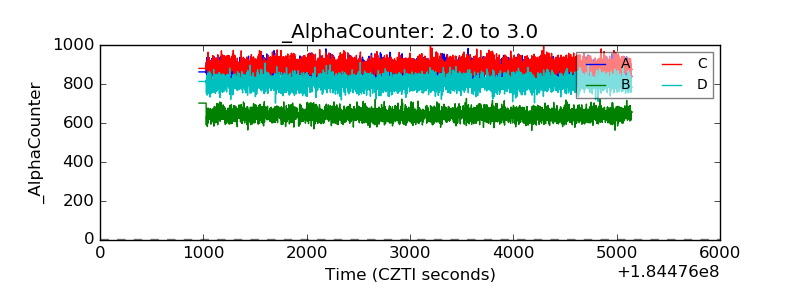 |
| _CPM_Rate | 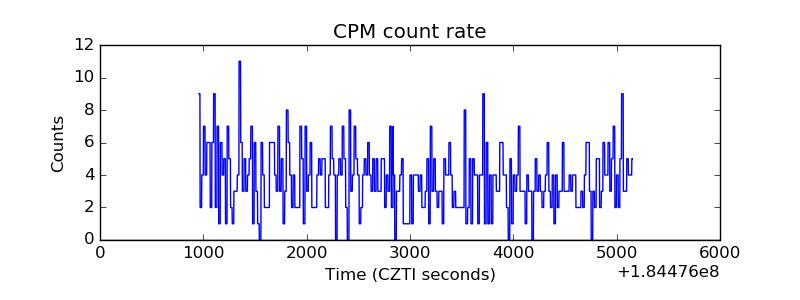 |
| CZT Counter | 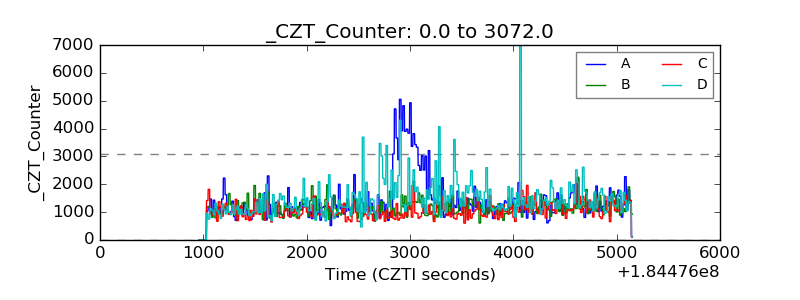 |
| +2.5 Volts monitor | 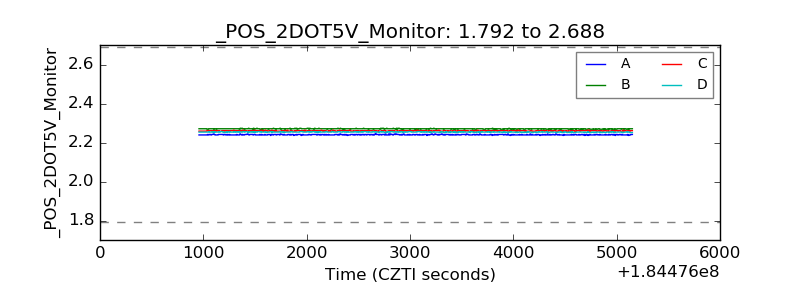 |
| +5 Volts monitor |  |
| _ROLL_ROT | 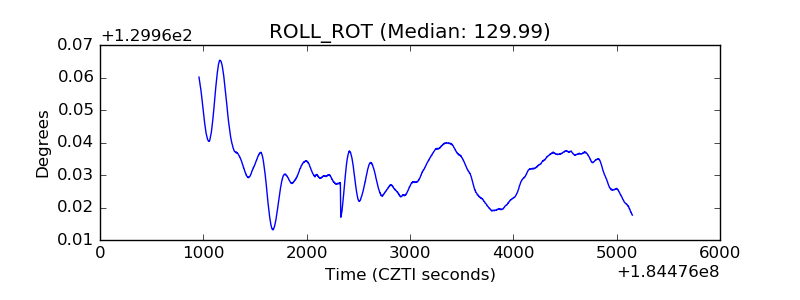 |
| _Roll_DEC | 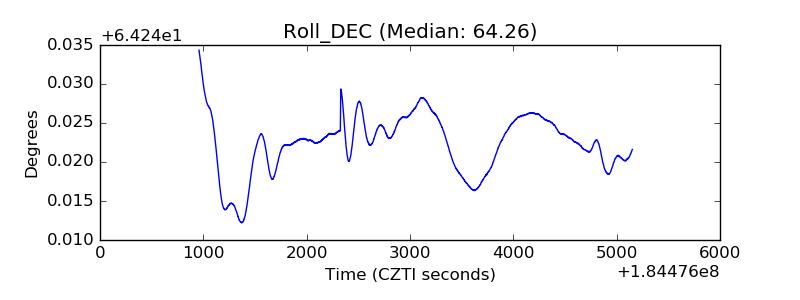 |
| _Roll_RA | 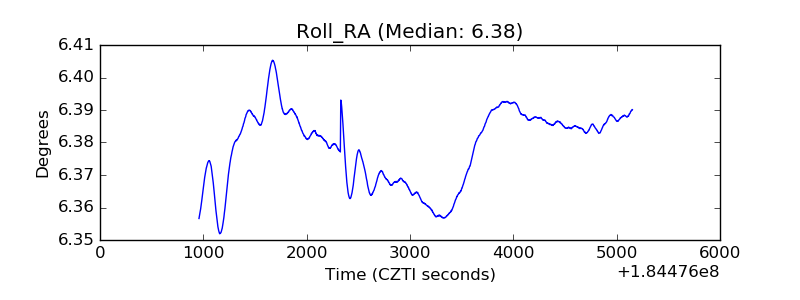 |
| Veto Counter | 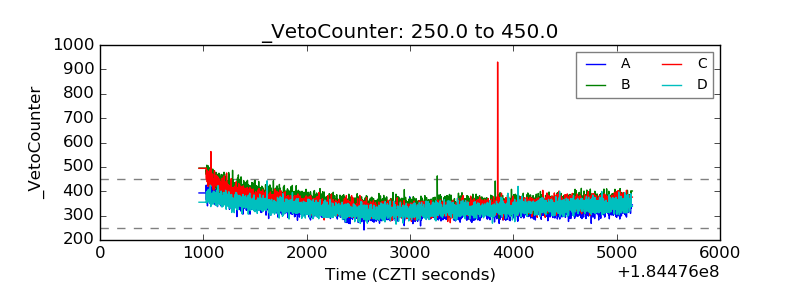 |