| Param | Original file | Final file |
|---|---|---|
| Filename | modeM0/AS1P01_014T06_9000000078cztM0_level2.fits | modeM0/AS1P01_014T06_9000000078cztM0_level2_quad_clean.evt |
| Size (bytes) | 179,012,160 | 197,691,840 |
| Size | 170.7 MB | 188.5 MB |
| Events in quadrant A | 1,019,484 | 1,167,681 |
| Events in quadrant B | 1,019,826 | 1,183,818 |
| Events in quadrant C | 1,010,742 | 1,122,610 |
| Events in quadrant D | 848,744 | 990,221 |
| Mode SS | |||
|---|---|---|---|
| Quadrant | BADHDUFLAG | Total packets | Discarded packets |
| A | 0 | 454 | 0 |
| B | 0 | 454 | 0 |
| C | 0 | 454 | 0 |
| D | 0 | 454 | 0 |
| Mode M9 | |||
|---|---|---|---|
| Quadrant | BADHDUFLAG | Total packets | Discarded packets |
| A | 0 | 130 | 0 |
| B | 0 | 130 | 0 |
| C | 0 | 130 | 0 |
| D | 0 | 130 | 0 |
| Mode M0 | |||
|---|---|---|---|
| Quadrant | BADHDUFLAG | Total packets | Discarded packets |
| A | 0 | 96212 | 0 |
| B | 0 | 95294 | 0 |
| C | 0 | 86412 | 0 |
| D | 0 | 101895 | 0 |
| Quadrant | Total seconds | Saturated seconds | Saturation percentage |
|---|---|---|---|
| A | 22116 | 191 | 0.863628% |
| B | 22116 | 43 | 0.194429% |
| C | 22116 | 9 | 0.040695% |
| D | 22116 | 512 | 2.315066% |
Noise dominated data is calculated using 1-second bins in cleaned event files. If a bin has >2000 counts, and if more than 50% of those come from <1% of pixels, then it is considered to be noise-dominated and hence unusable.
| Quadrant | # 1 sec bins | Bins with >0 counts | Bins with >2000 counts | High rate bins dominated by noise | Noise dominated (total time) | Noise dominated (detector-on time) | Marked lightcurve |
|---|---|---|---|---|---|---|---|
| A | 35051 | 22115 | 0 | 0 | 0.00% | 0.00% | 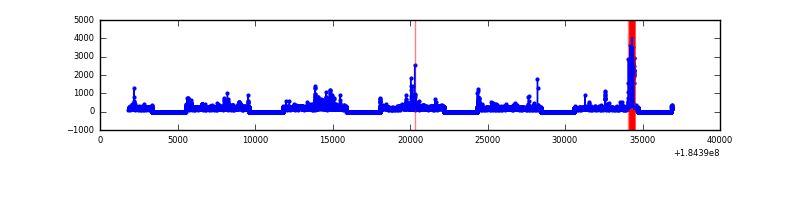 |
| B | 35051 | 22116 | 0 | 0 | 0.00% | 0.00% |  |
| C | 35051 | 22116 | 0 | 0 | 0.00% | 0.00% |  |
| D | 35051 | 22115 | 0 | 0 | 0.00% | 0.00% |  |
Top three noisy pixels from each quadrant. If the there are fewer than three noisy pixels in the level2.evt file, extra rows are filled as -1
| Pixel properties | Quadrant properties | ||||||
|---|---|---|---|---|---|---|---|
| Quadrant | DetID | PixID | Counts | Sigma | Mean | Median | Sigma |
| A | 7 | 110 | 952 | 11.03 | 265 | 248 | 63.8 |
| A | 0 | 29 | 914 | 10.43 | 265 | 248 | 63.8 |
| A | 9 | 239 | 722 | 7.43 | 265 | 248 | 63.8 |
| B | 2 | 9 | 895 | 13.23 | 269 | 257 | 48.2 |
| B | 14 | 254 | 719 | 9.58 | 269 | 257 | 48.2 |
| B | 2 | 18 | 659 | 8.34 | 269 | 257 | 48.2 |
| C | 12 | 241 | 717 | 7.02 | 267 | 247 | 66.9 |
| C | 2 | 191 | 704 | 6.83 | 267 | 247 | 66.9 |
| C | 3 | 187 | 655 | 6.09 | 267 | 247 | 66.9 |
| D | 6 | 231 | 648 | 7.11 | 243 | 223 | 59.8 |
| D | 6 | 44 | 633 | 6.86 | 243 | 223 | 59.8 |
| D | 11 | 82 | 622 | 6.67 | 243 | 223 | 59.8 |
Histogram calculated using DETX and DETY for each event in the final _common_clean file
| Quadrant A | 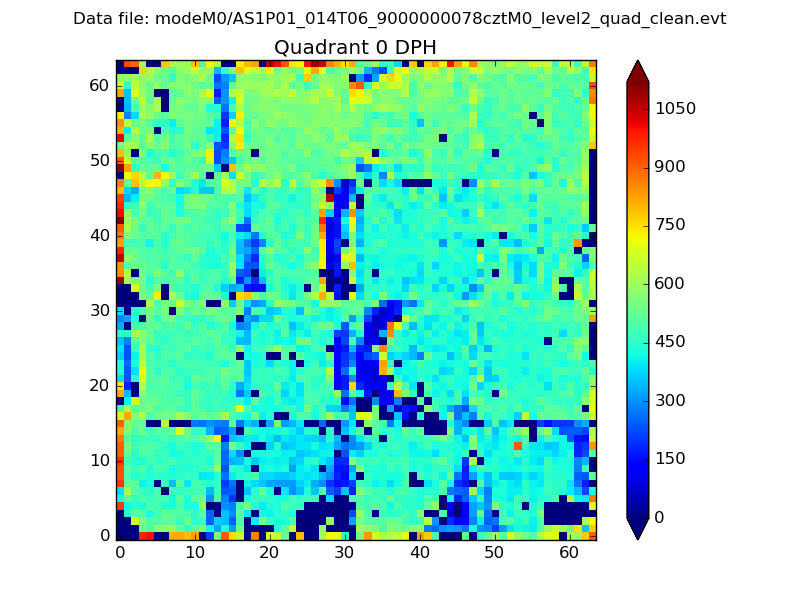 |
 |
Quadrant B |
|---|---|---|---|
| Quadrant D | 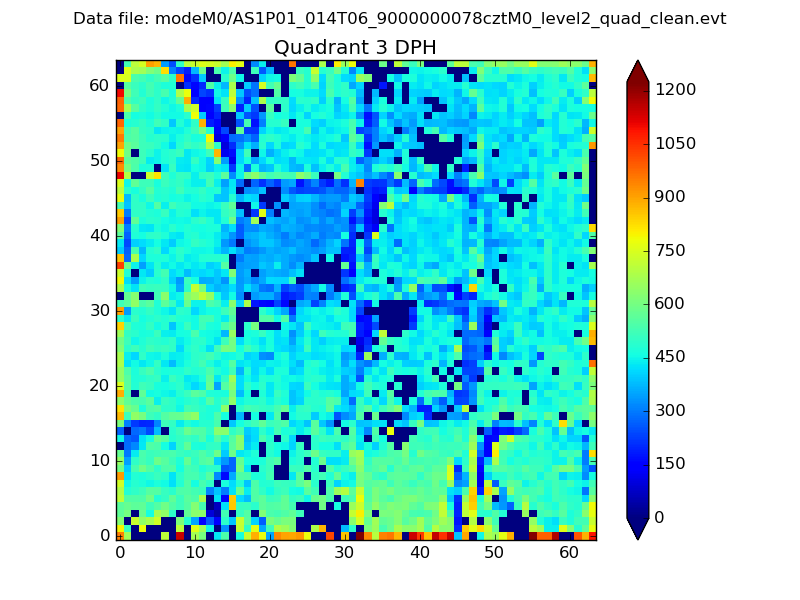 |
 |
Quadrant C |
| Plot type | Count rate plots | Images |
|---|---|---|
| Comparison with Poisson distribution Blue bars denote a histogram of data divided into 1 sec bins. Red curve is a Poisson curve with rate = median count rate of data. |
 |
 |
| Quadrant-wise count rates Data is divided into 100 sec bins |
 |
|
| Module-wise count rates for Quadrant A Data is divided into 100 sec bins |
 |
 |
| Module-wise count rates for Quadrant B Data is divided into 100 sec bins |
 |
 |
| Module-wise count rates for Quadrant C Data is divided into 100 sec bins |
 |
 |
| Module-wise count rates for Quadrant D Data is divided into 100 sec bins |
 |
 |
| Parameter | Plot |
|---|---|
| CZT HV Monitor |  |
| D_VDD |  |
| Temperature 1 |  |
| Veto HV Monitor |  |
| Veto LLD |  |
| Alpha Counter | 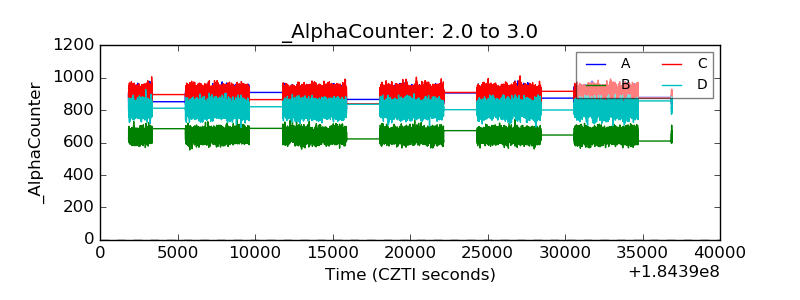 |
| _CPM_Rate | 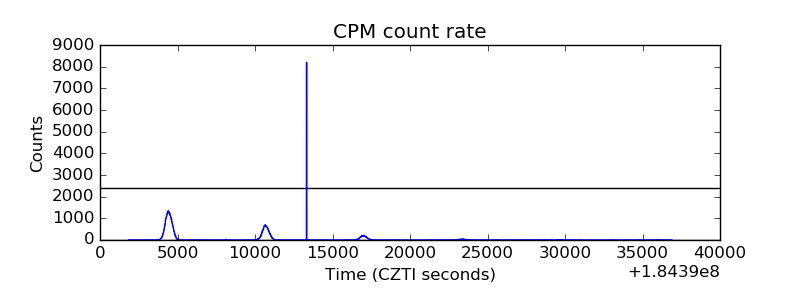 |
| CZT Counter |  |
| +2.5 Volts monitor |  |
| +5 Volts monitor |  |
| _ROLL_ROT |  |
| _Roll_DEC |  |
| _Roll_RA |  |
| Veto Counter |  |