| Param | Original file | Final file |
|---|---|---|
| Filename | modeM0/AS1P01_014T06_9000000078_00564cztM0_level2.evt | modeM0/AS1P01_014T06_9000000078_00564cztM0_level2_quad_clean.evt |
| Size (bytes) | 418,008,960 | 24,644,160 |
| Size | 398.6 MB | 23.5 MB |
| Events in quadrant A | 3,209,846 | 144,698 |
| Events in quadrant B | 3,396,636 | 137,254 |
| Events in quadrant C | 2,843,345 | 141,769 |
| Events in quadrant D | 3,038,440 | 139,021 |
| Mode SS | |||
|---|---|---|---|
| Quadrant | BADHDUFLAG | Total packets | Discarded packets |
| A | 0 | 54 | 0 |
| B | 0 | 54 | 0 |
| C | 0 | 54 | 0 |
| D | 0 | 54 | 0 |
| Mode M9 | |||
|---|---|---|---|
| Quadrant | BADHDUFLAG | Total packets | Discarded packets |
| A | 0 | 21 | 0 |
| B | 0 | 21 | 0 |
| C | 0 | 21 | 0 |
| D | 0 | 21 | 0 |
| Mode M0 | |||
|---|---|---|---|
| Quadrant | BADHDUFLAG | Total packets | Discarded packets |
| A | 0 | 11308 | 2 |
| B | 0 | 11920 | 1 |
| C | 0 | 10252 | 1 |
| D | 0 | 10829 | 1 |
| Quadrant | Total seconds | Saturated seconds | Saturation percentage |
|---|---|---|---|
| A | 2546 | 2 | 0.078555% |
| B | 2546 | 20 | 0.785546% |
| C | 2546 | 2 | 0.078555% |
| D | 2546 | 2 | 0.078555% |
Noise dominated data is calculated using 1-second bins in cleaned event files. If a bin has >2000 counts, and if more than 50% of those come from <1% of pixels, then it is considered to be noise-dominated and hence unusable.
| Quadrant | # 1 sec bins | Bins with >0 counts | Bins with >2000 counts | High rate bins dominated by noise | Noise dominated (total time) | Noise dominated (detector-on time) | Marked lightcurve |
|---|---|---|---|---|---|---|---|
| A | 4701 | 2547 | 64 | 64 | 1.36% | 2.51% | 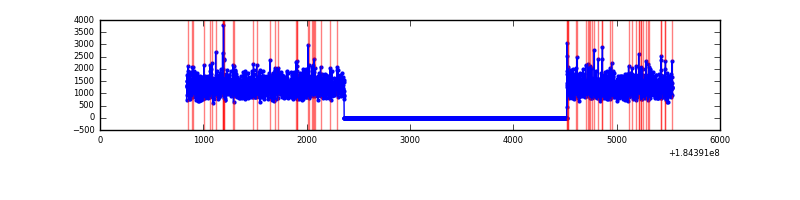 |
| B | 4701 | 2547 | 111 | 111 | 2.36% | 4.36% | 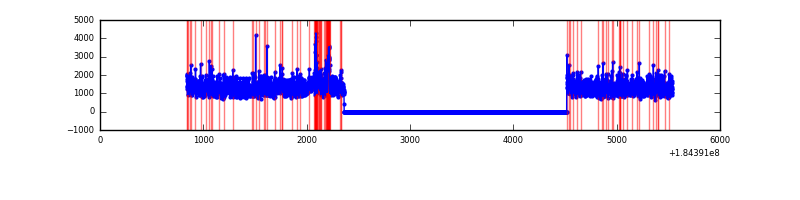 |
| C | 4701 | 2547 | 19 | 19 | 0.40% | 0.75% | 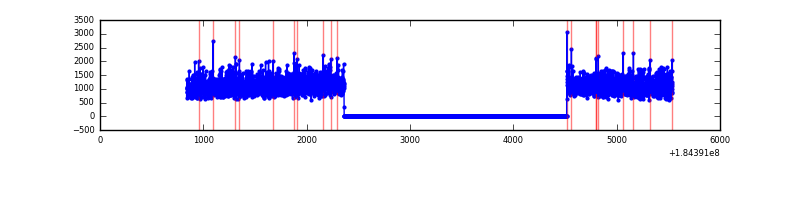 |
| D | 4701 | 2547 | 42 | 42 | 0.89% | 1.65% | 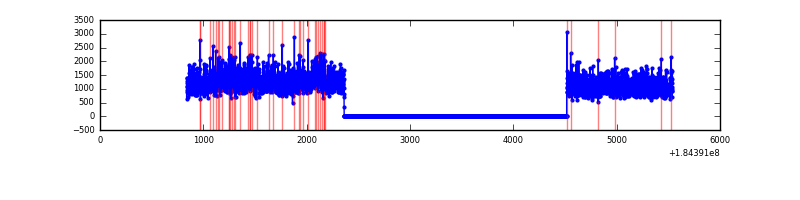 |
Top three noisy pixels from each quadrant. If the there are fewer than three noisy pixels in the level2.evt file, extra rows are filled as -1
| Pixel properties | Quadrant properties | ||||||
|---|---|---|---|---|---|---|---|
| Quadrant | DetID | PixID | Counts | Sigma | Mean | Median | Sigma |
| A | 0 | 238 | 23814 | 127.63 | 811 | 805 | 180.3 |
| A | 14 | 79 | 15436 | 81.16 | 811 | 805 | 180.3 |
| A | 15 | 171 | 10126 | 51.7 | 811 | 805 | 180.3 |
| B | 4 | 250 | 191682 | 1005.37 | 796 | 799 | 189.9 |
| B | 5 | 249 | 30732 | 157.65 | 796 | 799 | 189.9 |
| B | 5 | 46 | 30626 | 157.1 | 796 | 799 | 189.9 |
| C | 0 | 64 | 6570 | 29.18 | 718 | 745 | 199.7 |
| C | 15 | 241 | 6401 | 28.33 | 718 | 745 | 199.7 |
| C | 9 | 241 | 3610 | 14.35 | 718 | 745 | 199.7 |
| D | 1 | 4 | 120718 | 533.73 | 717 | 745 | 224.8 |
| D | 12 | 22 | 40793 | 178.16 | 717 | 745 | 224.8 |
| D | 13 | 221 | 25442 | 109.87 | 717 | 745 | 224.8 |
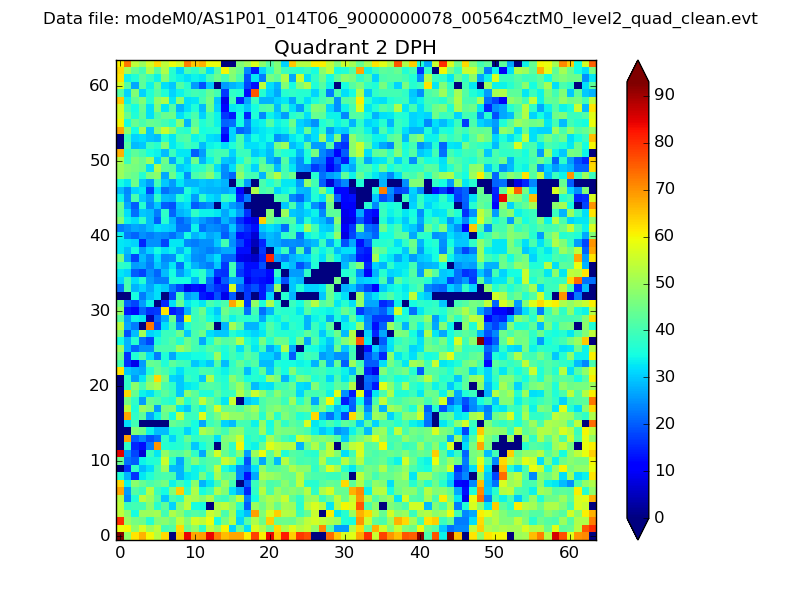
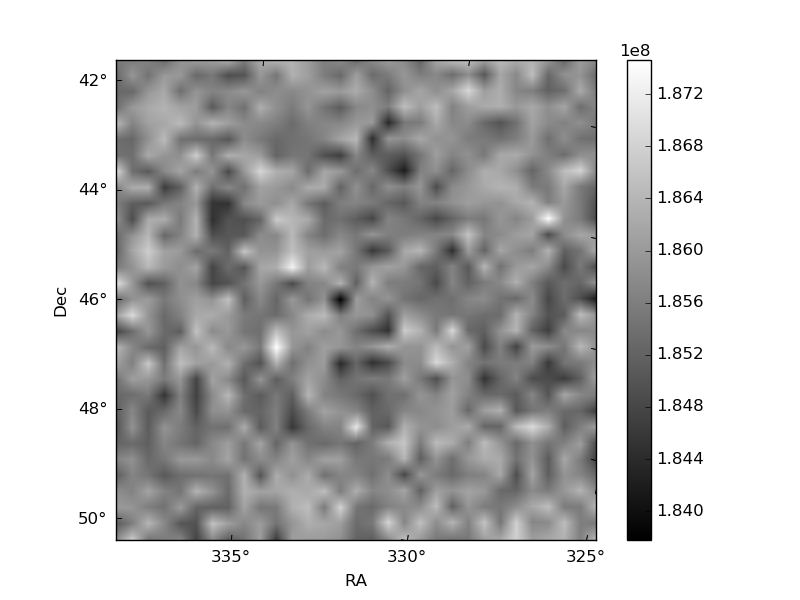
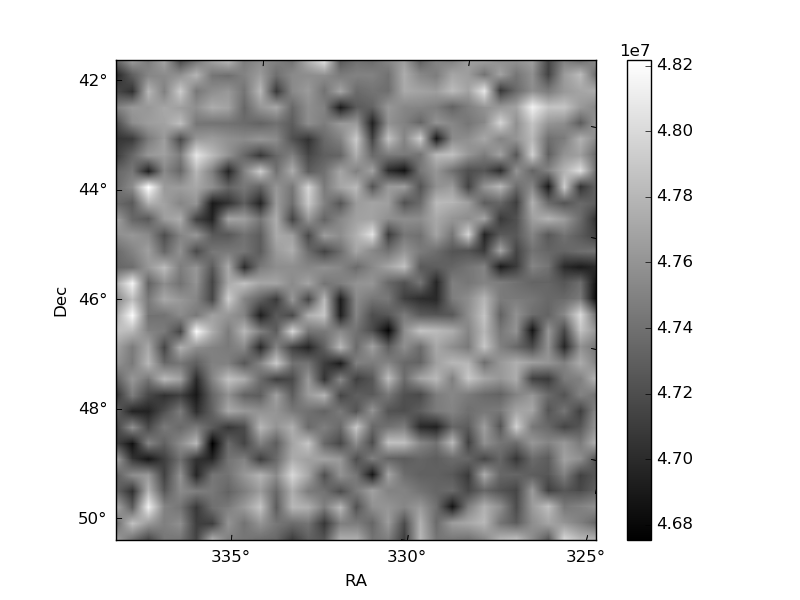
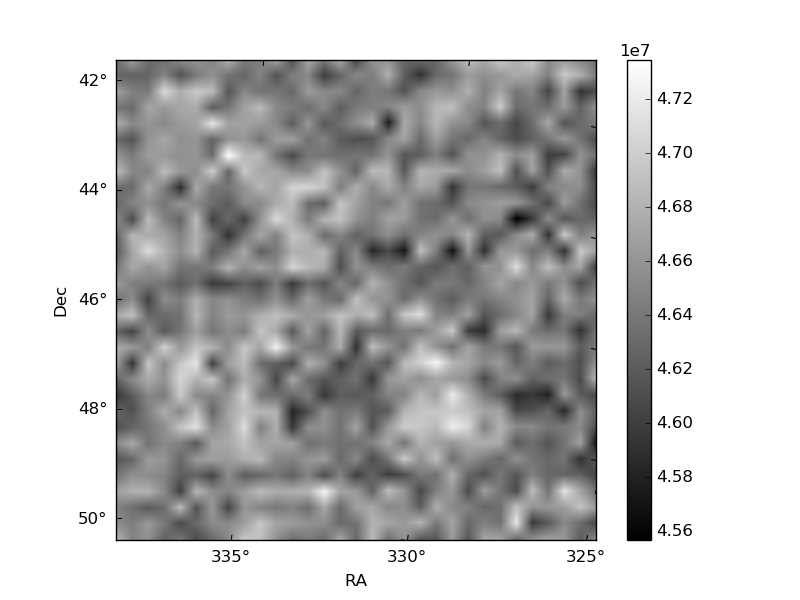
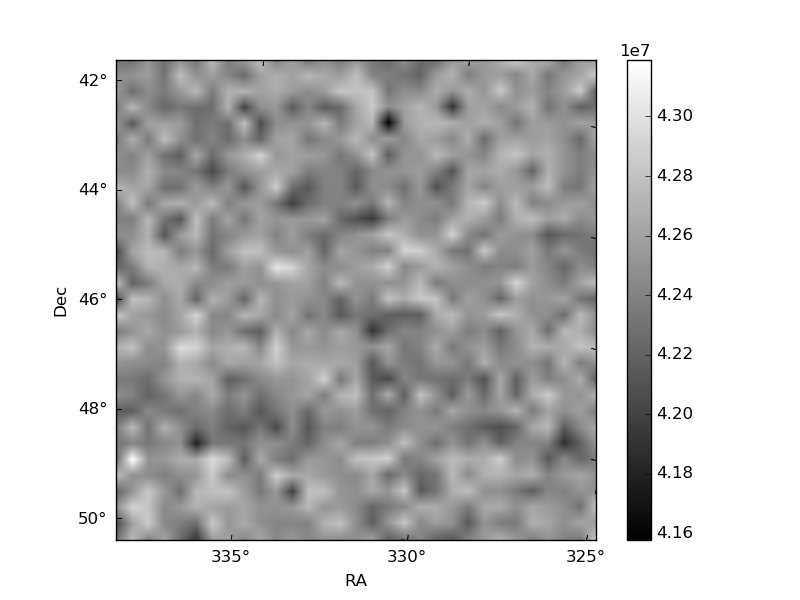
Histogram calculated using DETX and DETY for each event in the final _common_clean file
| Quadrant A | 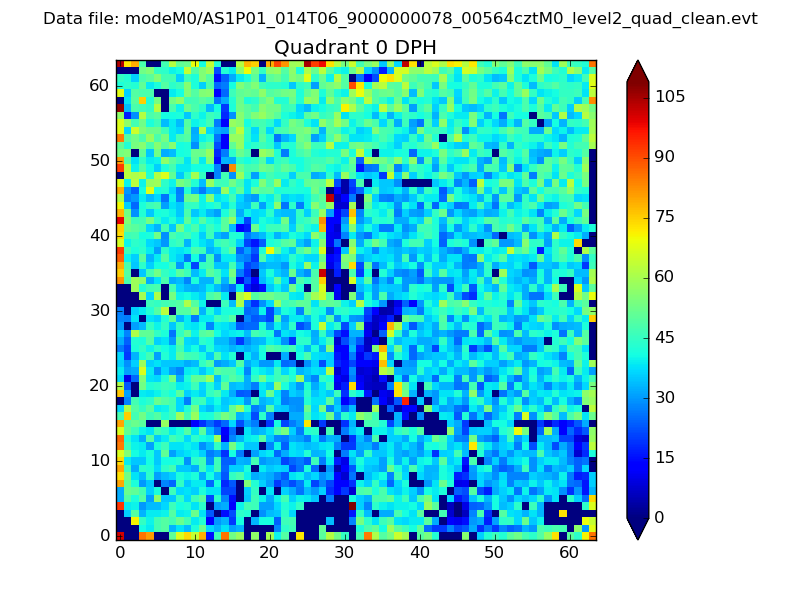 |
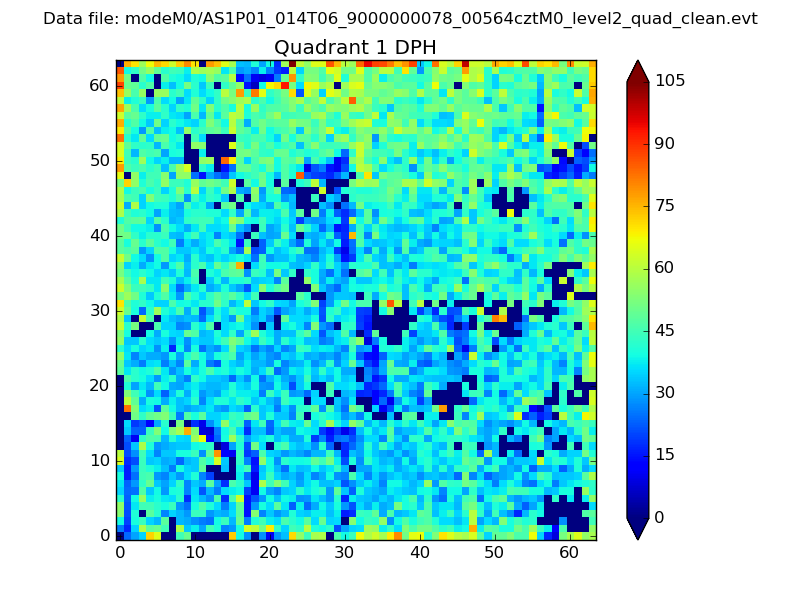 |
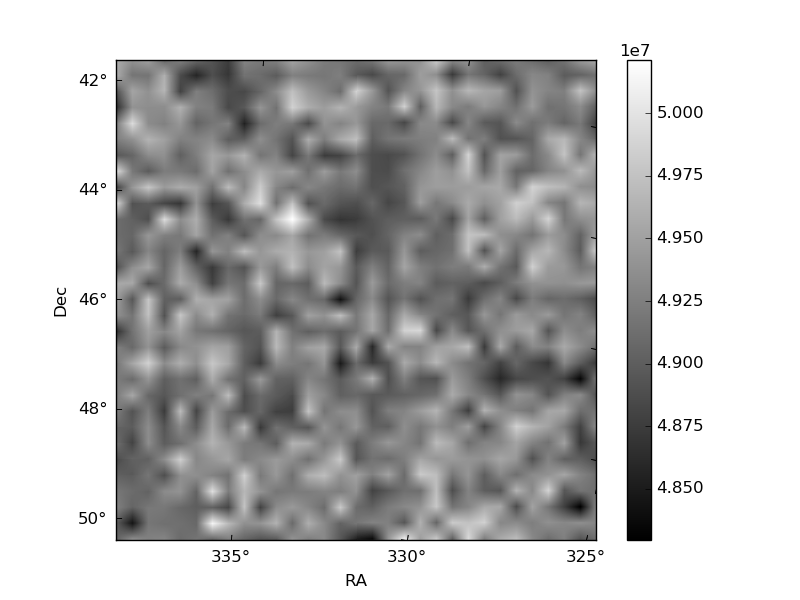
Quadrant B |
|---|---|---|---|
| Quadrant D | 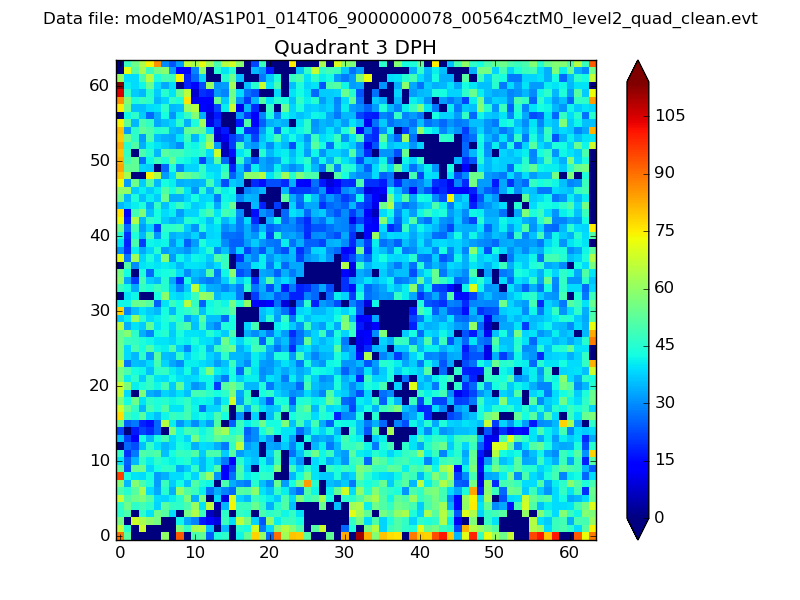 |
 |
Quadrant C |
| Plot type | Count rate plots | Images |
|---|---|---|
| Comparison with Poisson distribution Blue bars denote a histogram of data divided into 1 sec bins. Red curve is a Poisson curve with rate = median count rate of data. |
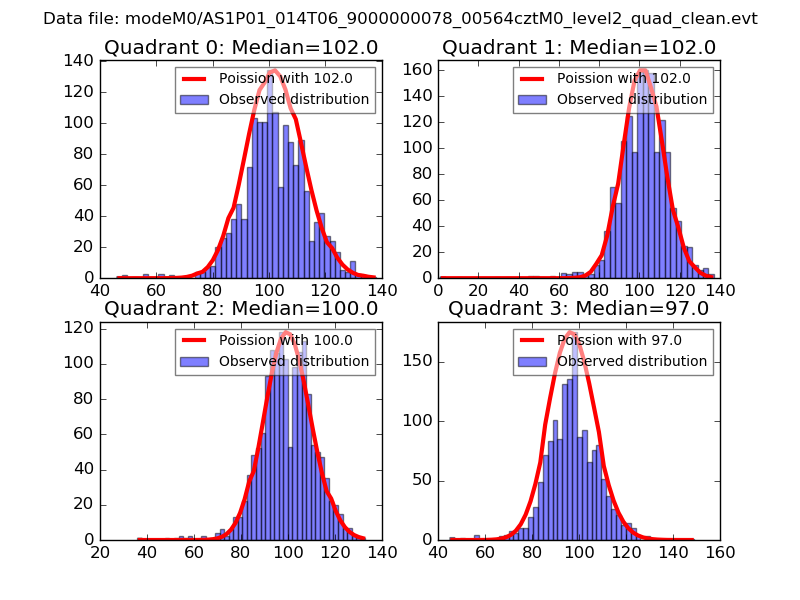 |
 |
| Quadrant-wise count rates Data is divided into 100 sec bins |
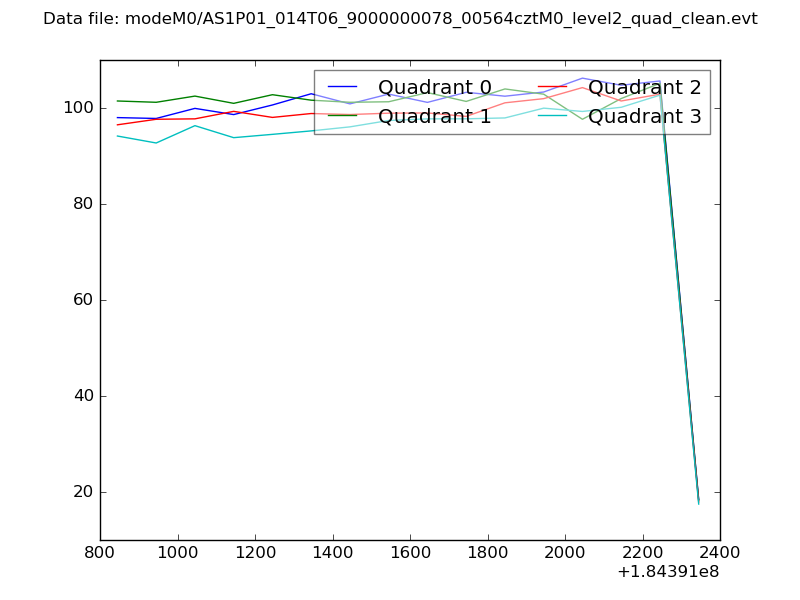 |
|
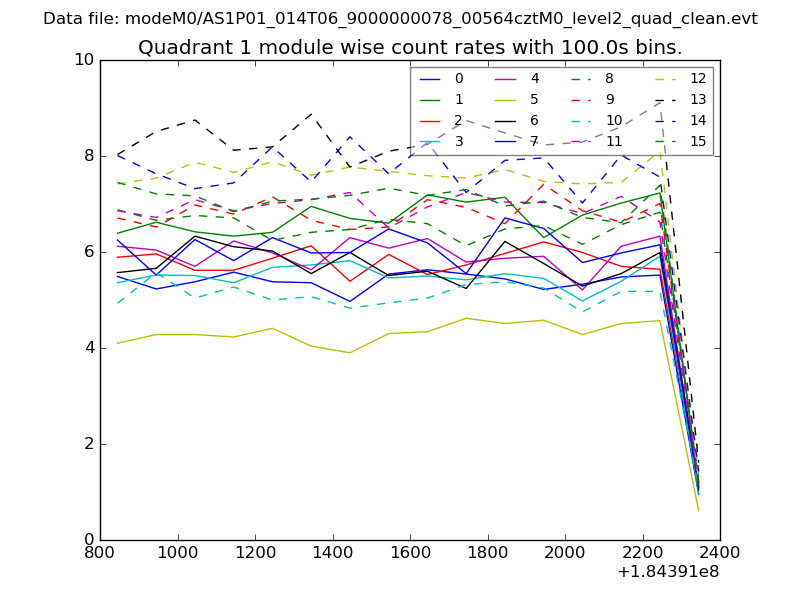
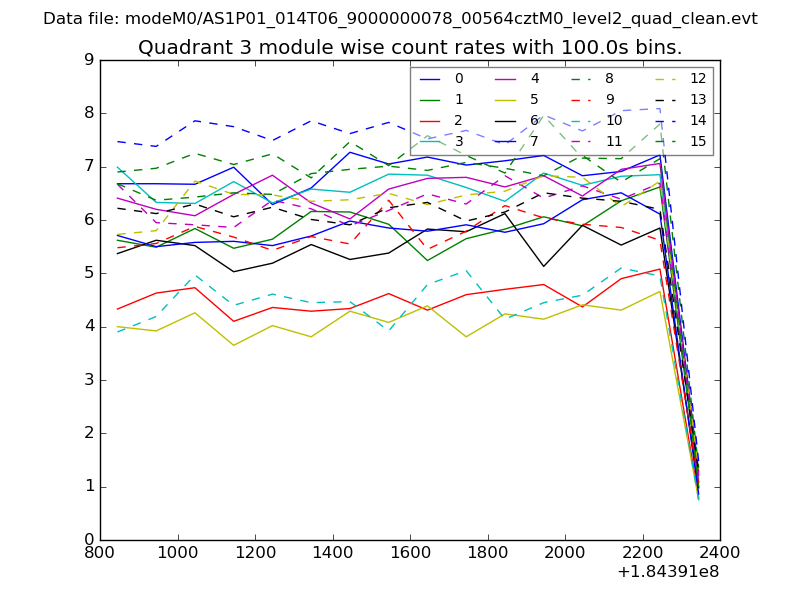
| Module-wise count rates for Quadrant A Data is divided into 100 sec bins |
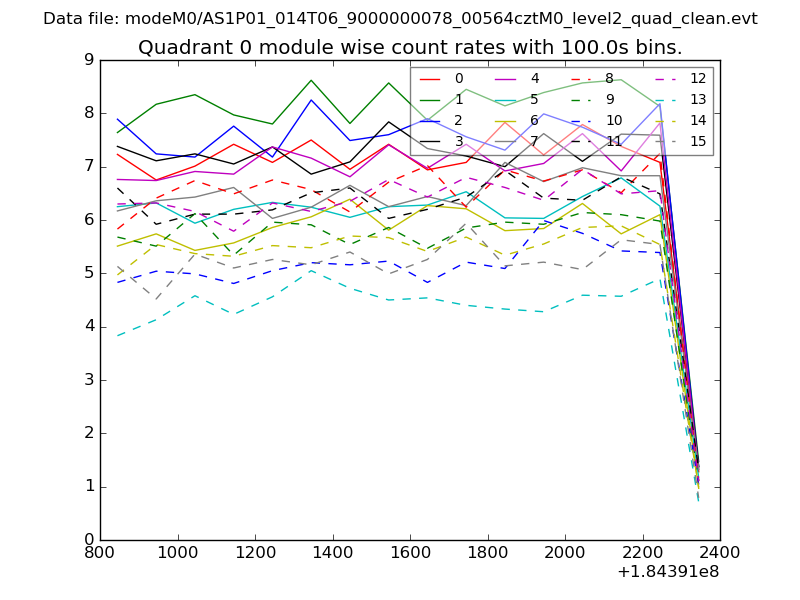 |
 |
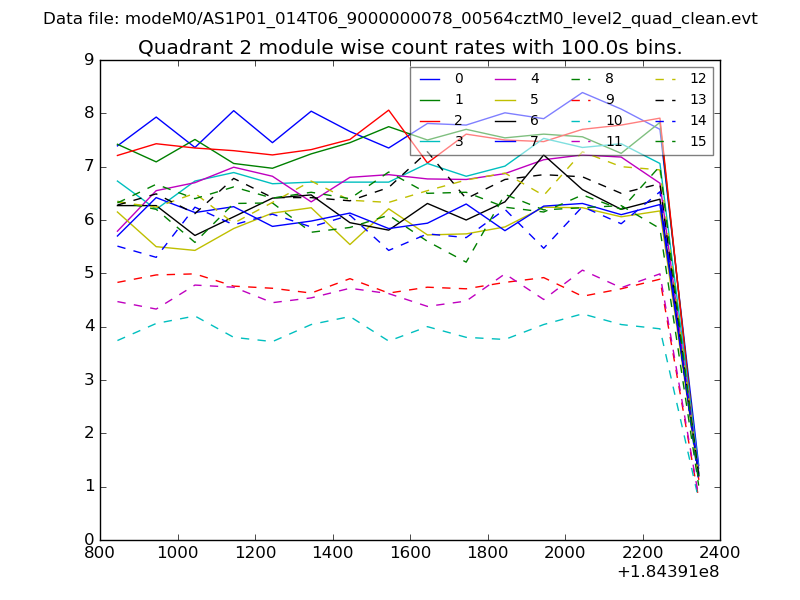
| Module-wise count rates for Quadrant B Data is divided into 100 sec bins |
 |
 |
| Module-wise count rates for Quadrant C Data is divided into 100 sec bins |
 |
 |
| Module-wise count rates for Quadrant D Data is divided into 100 sec bins |
 |
 |
| Parameter | Plot |
|---|---|
| CZT HV Monitor | 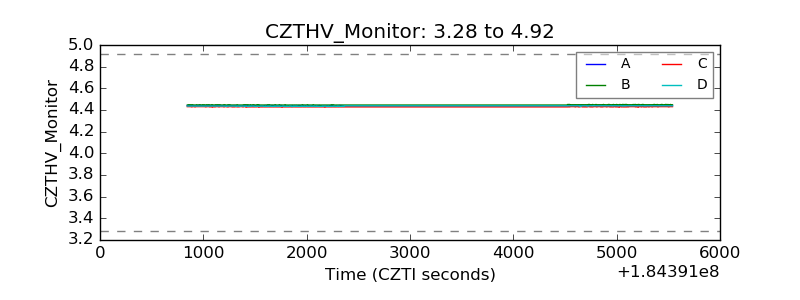 |
| D_VDD | 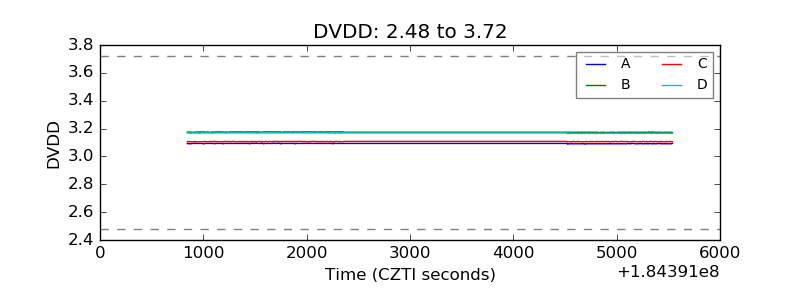 |
| Temperature 1 | 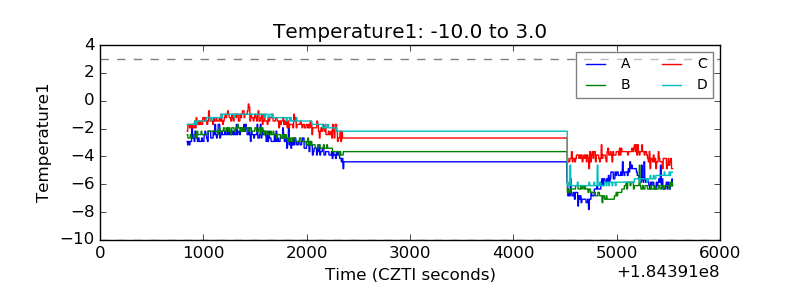 |
| Veto HV Monitor | 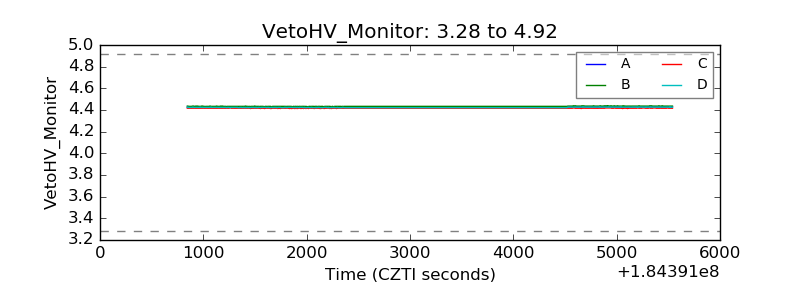 |
| Veto LLD | 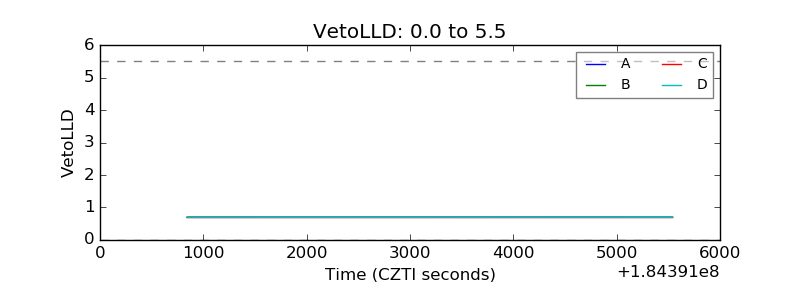 |
| Alpha Counter | 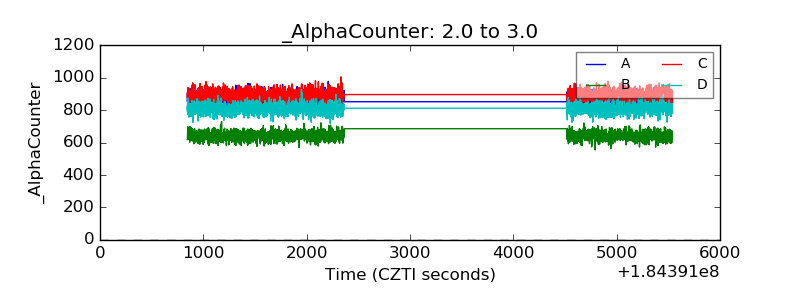 |
| _CPM_Rate | 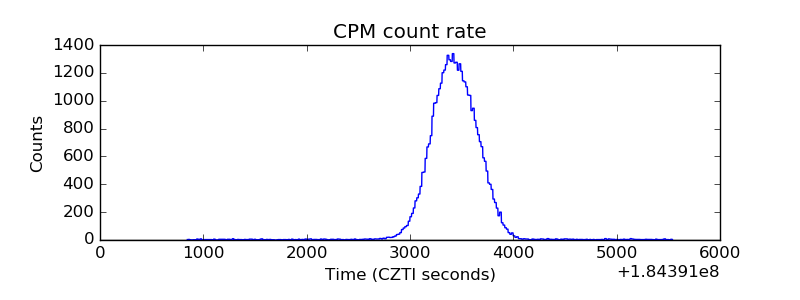 |
| CZT Counter | 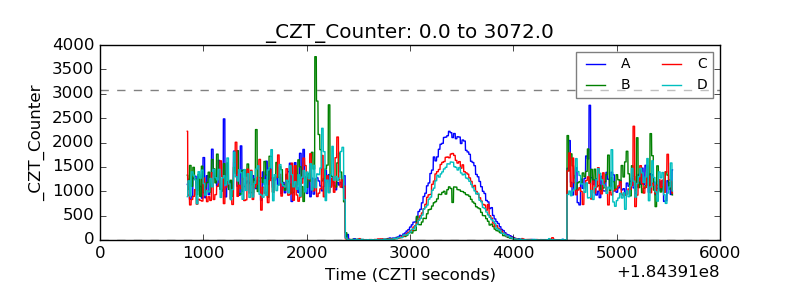 |
| +2.5 Volts monitor | 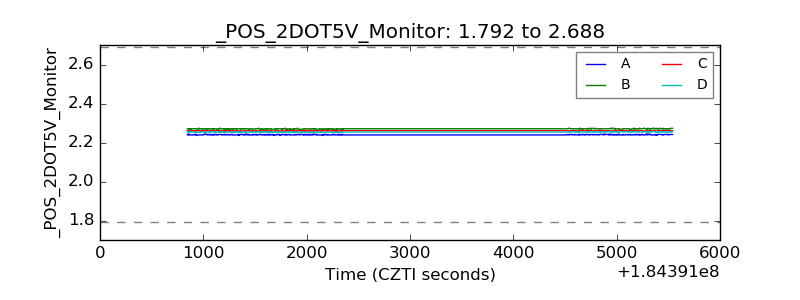 |
| +5 Volts monitor |  |
| _ROLL_ROT | 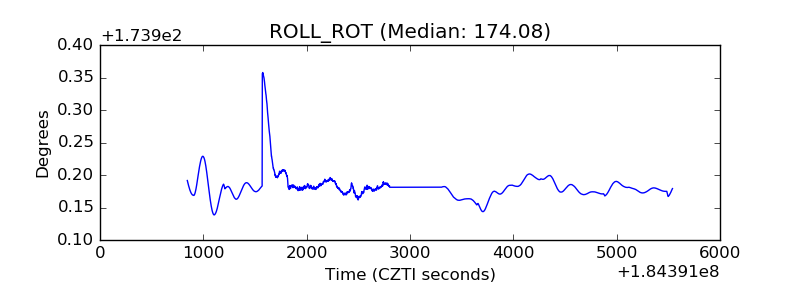 |
| _Roll_DEC | 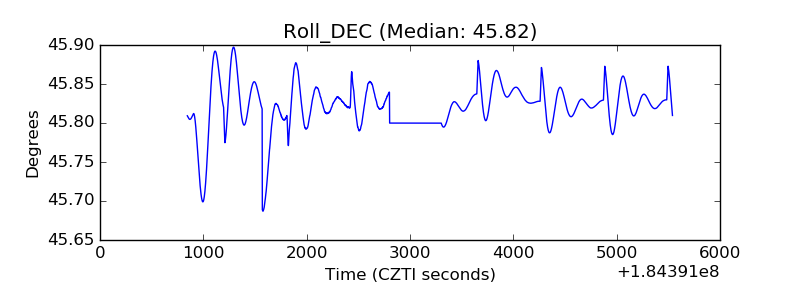 |
| _Roll_RA | 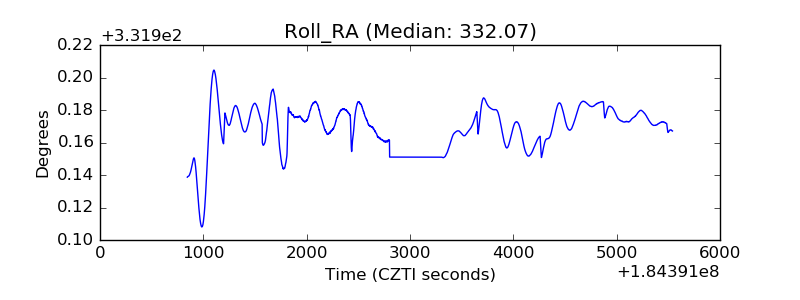 |
| Veto Counter | 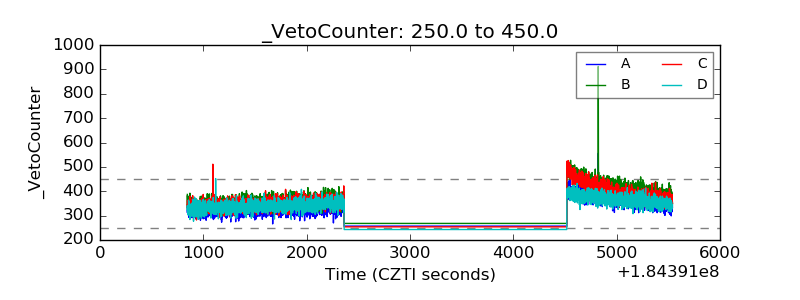 |