| Param | Original file | Final file |
|---|---|---|
| Filename | modeM0/AS1P01_014T06_9000000078_00565cztM0_level2.evt | modeM0/AS1P01_014T06_9000000078_00565cztM0_level2_quad_clean.evt |
| Size (bytes) | 787,029,120 | 49,864,320 |
| Size | 750.6 MB | 47.6 MB |
| Events in quadrant A | 6,207,558 | 291,981 |
| Events in quadrant B | 6,135,402 | 299,124 |
| Events in quadrant C | 5,425,533 | 290,171 |
| Events in quadrant D | 5,734,547 | 278,061 |
| Mode SS | |||
|---|---|---|---|
| Quadrant | BADHDUFLAG | Total packets | Discarded packets |
| A | 0 | 102 | 0 |
| B | 0 | 102 | 0 |
| C | 0 | 102 | 0 |
| D | 0 | 102 | 0 |
| Mode M9 | |||
|---|---|---|---|
| Quadrant | BADHDUFLAG | Total packets | Discarded packets |
| A | 0 | 33 | 0 |
| B | 0 | 33 | 0 |
| C | 0 | 33 | 0 |
| D | 0 | 34 | 0 |
| Mode M0 | |||
|---|---|---|---|
| Quadrant | BADHDUFLAG | Total packets | Discarded packets |
| A | 0 | 21973 | 3 |
| B | 0 | 21800 | 2 |
| C | 0 | 19651 | 2 |
| D | 0 | 20586 | 2 |
| Quadrant | Total seconds | Saturated seconds | Saturation percentage |
|---|---|---|---|
| A | 4992 | 5 | 0.100160% |
| B | 4992 | 4 | 0.080128% |
| C | 4992 | 2 | 0.040064% |
| D | 4992 | 14 | 0.280449% |
Noise dominated data is calculated using 1-second bins in cleaned event files. If a bin has >2000 counts, and if more than 50% of those come from <1% of pixels, then it is considered to be noise-dominated and hence unusable.
| Quadrant | # 1 sec bins | Bins with >0 counts | Bins with >2000 counts | High rate bins dominated by noise | Noise dominated (total time) | Noise dominated (detector-on time) | Marked lightcurve |
|---|---|---|---|---|---|---|---|
| A | 7147 | 4993 | 124 | 124 | 1.73% | 2.48% | 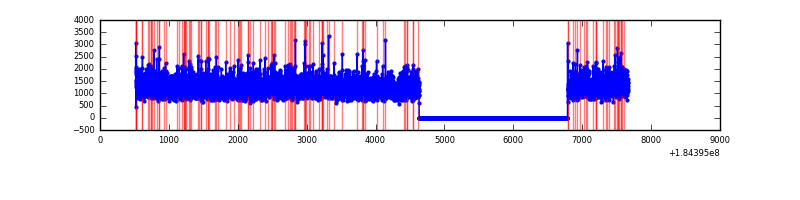 |
| B | 7147 | 4993 | 80 | 80 | 1.12% | 1.60% |  |
| C | 7147 | 4993 | 29 | 29 | 0.41% | 0.58% | 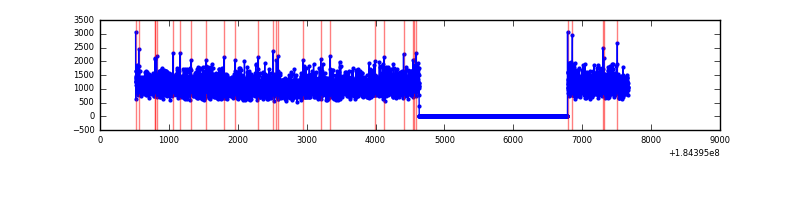 |
| D | 7147 | 4993 | 99 | 99 | 1.39% | 1.98% | 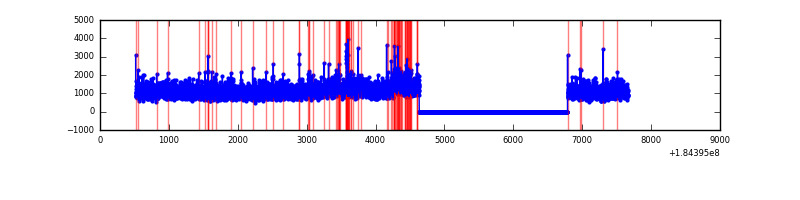 |
Top three noisy pixels from each quadrant. If the there are fewer than three noisy pixels in the level2.evt file, extra rows are filled as -1
| Pixel properties | Quadrant properties | ||||||
|---|---|---|---|---|---|---|---|
| Quadrant | DetID | PixID | Counts | Sigma | Mean | Median | Sigma |
| A | 0 | 238 | 64422 | 183.89 | 1558 | 1547 | 341.9 |
| A | 15 | 143 | 50008 | 141.74 | 1558 | 1547 | 341.9 |
| A | 0 | 69 | 35425 | 99.08 | 1558 | 1547 | 341.9 |
| B | 4 | 250 | 82697 | 223.65 | 1545 | 1558 | 362.8 |
| B | 8 | 4 | 21803 | 55.8 | 1545 | 1558 | 362.8 |
| B | 4 | 235 | 20576 | 52.42 | 1545 | 1558 | 362.8 |
| C | 15 | 241 | 13189 | 31.05 | 1371 | 1420 | 379.0 |
| C | 3 | 159 | 10454 | 23.83 | 1371 | 1420 | 379.0 |
| C | 5 | 249 | 10037 | 22.73 | 1371 | 1420 | 379.0 |
| D | 13 | 221 | 142046 | 332.37 | 1352 | 1401 | 423.2 |
| D | 1 | 4 | 118032 | 275.62 | 1352 | 1401 | 423.2 |
| D | 13 | 216 | 80522 | 186.98 | 1352 | 1401 | 423.2 |
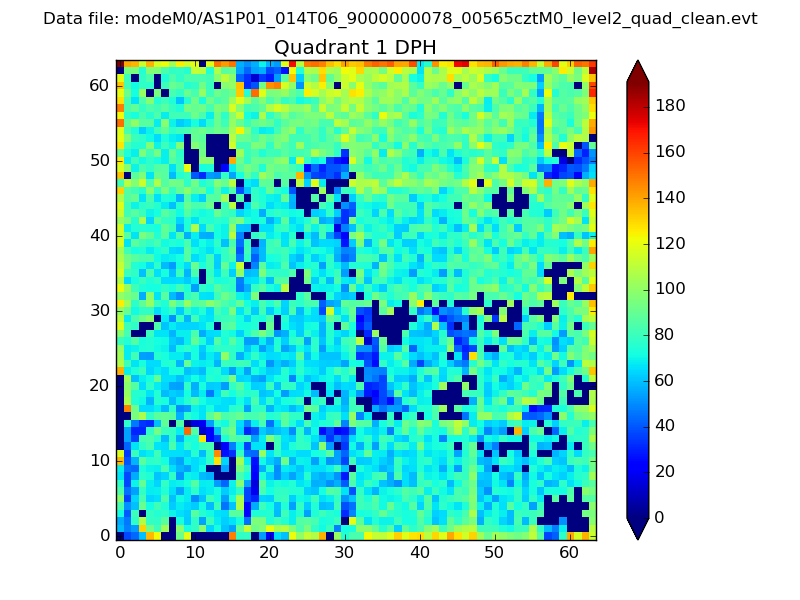
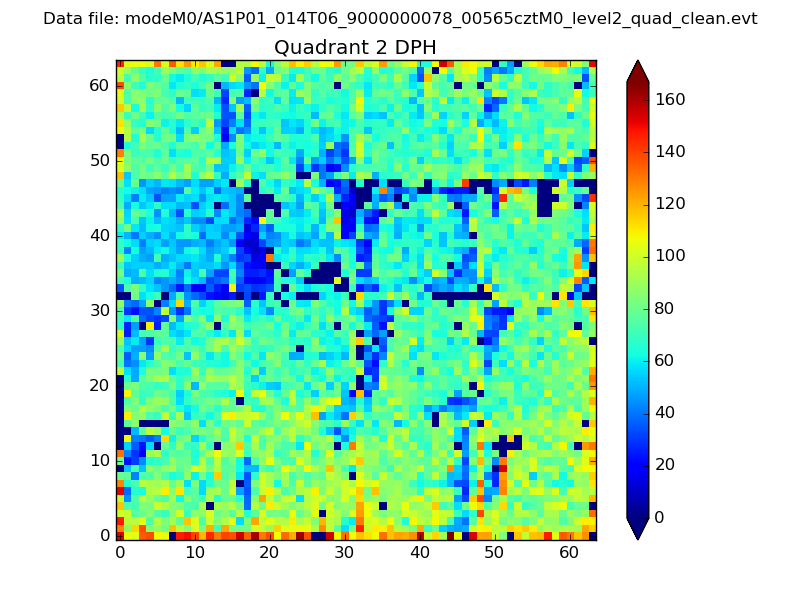
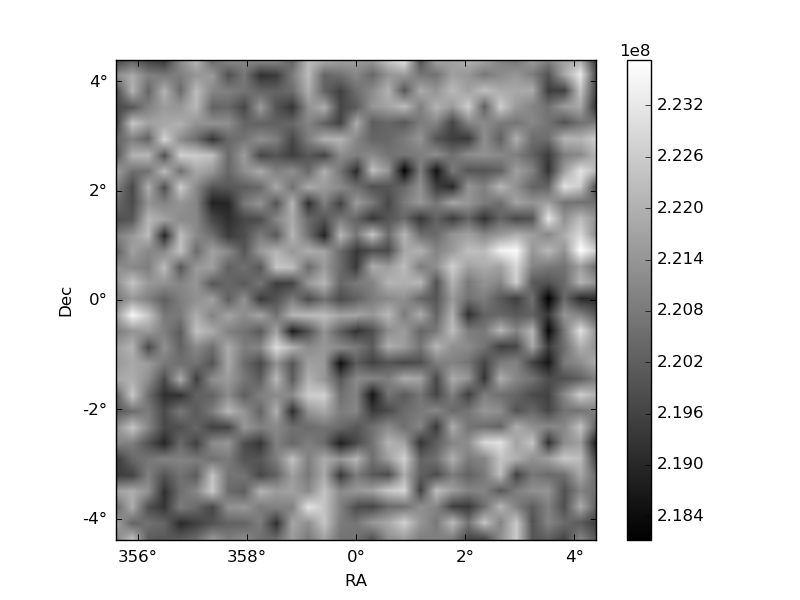
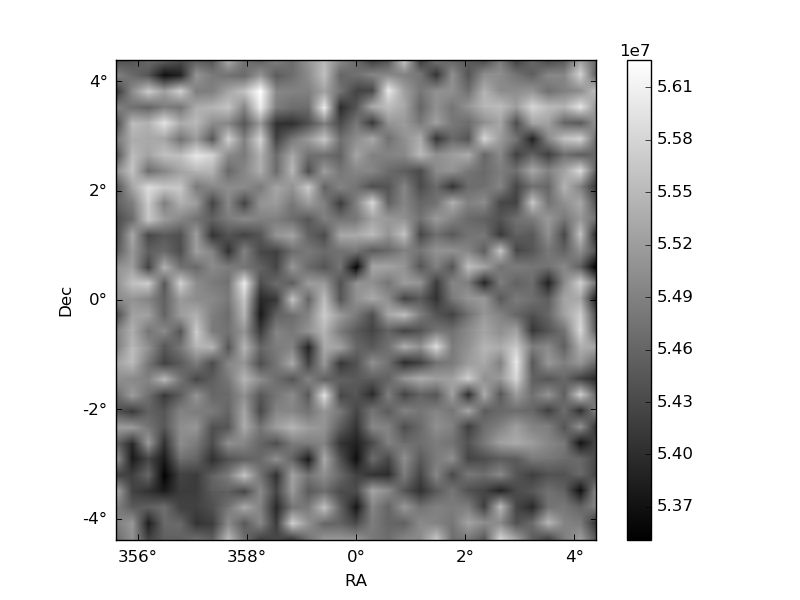
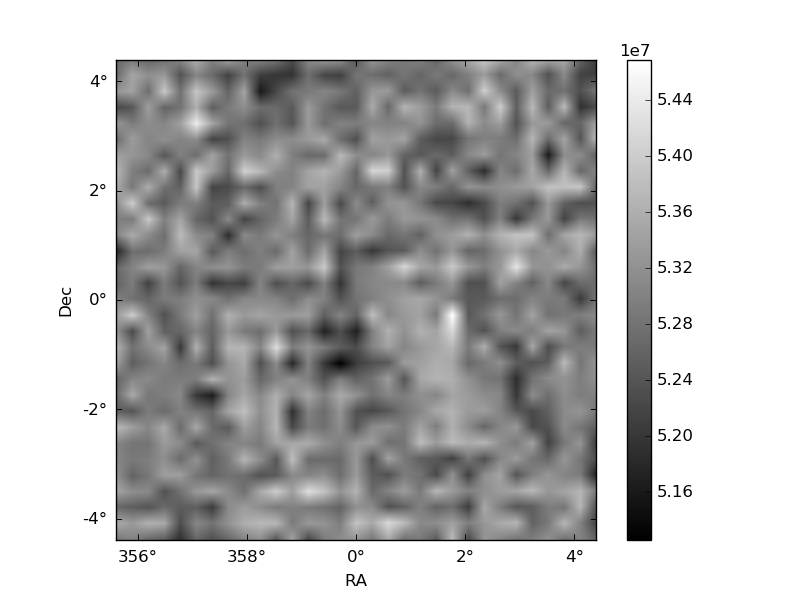
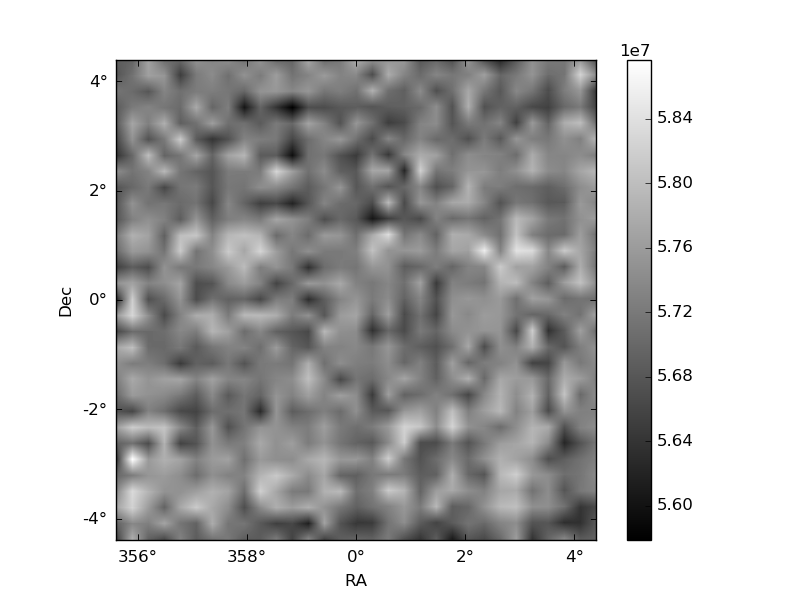
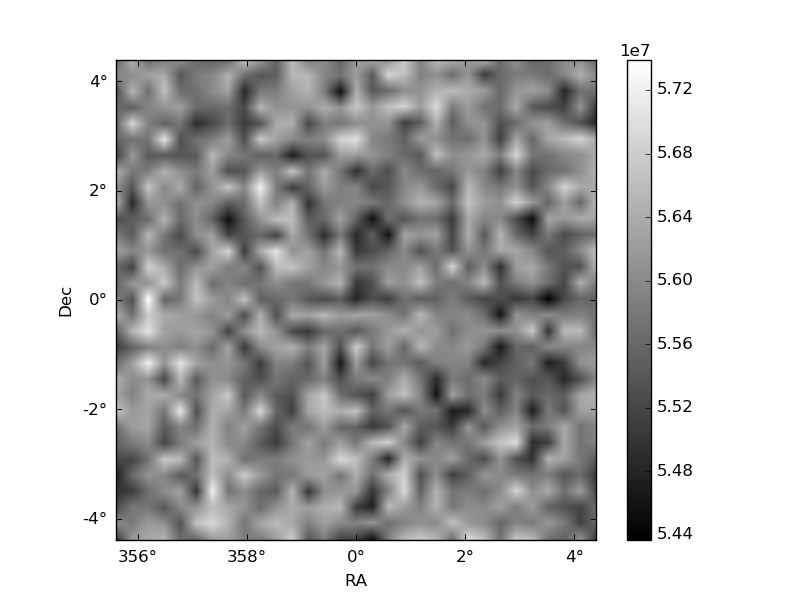
Histogram calculated using DETX and DETY for each event in the final _common_clean file
| Quadrant A | 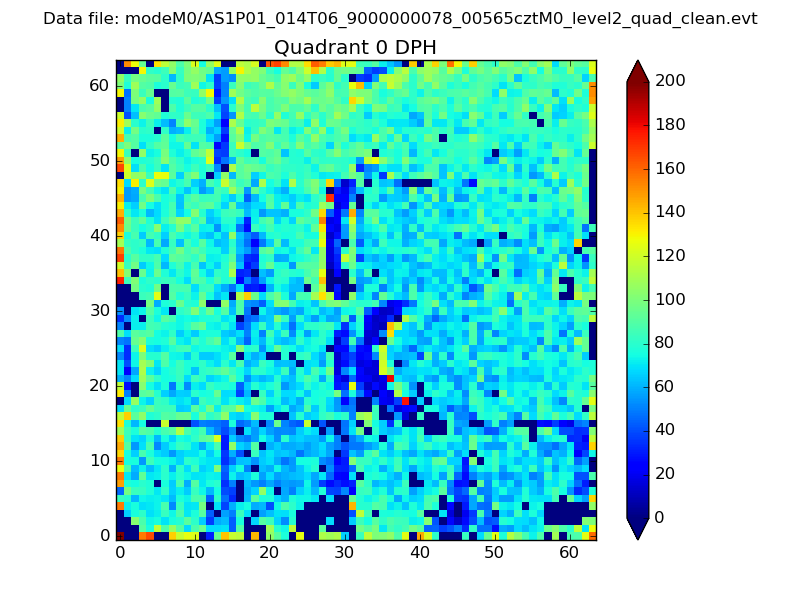 |
 |
Quadrant B |
|---|---|---|---|
| Quadrant D | 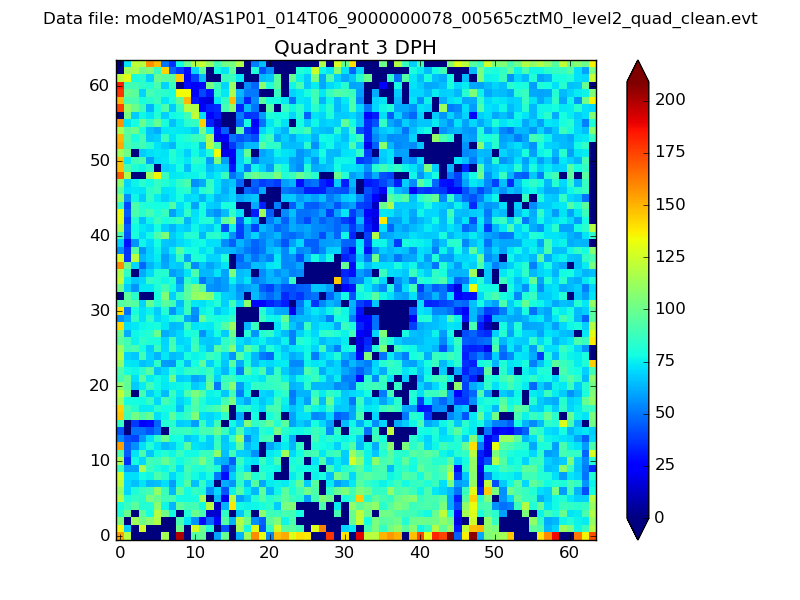 |
 |
Quadrant C |
| Plot type | Count rate plots | Images |
|---|---|---|
| Comparison with Poisson distribution Blue bars denote a histogram of data divided into 1 sec bins. Red curve is a Poisson curve with rate = median count rate of data. |
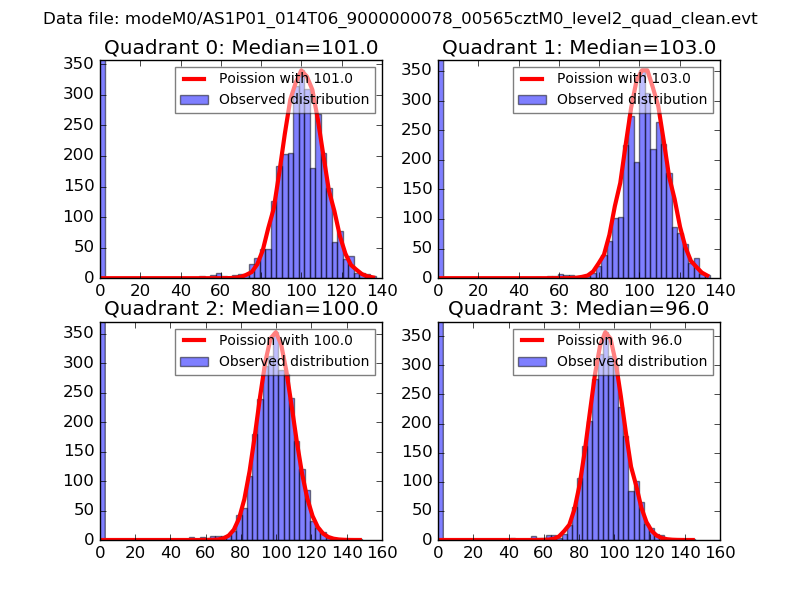 |
 |
| Quadrant-wise count rates Data is divided into 100 sec bins |
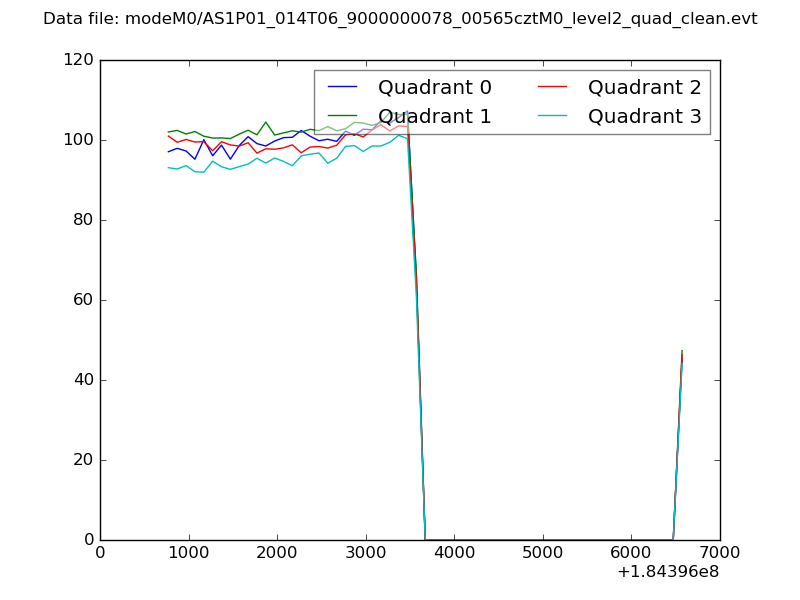 |
|
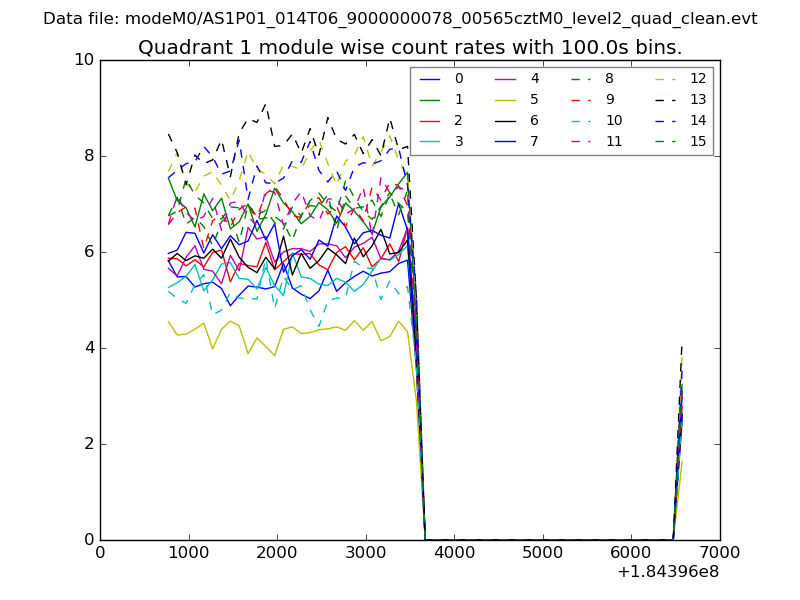
| Module-wise count rates for Quadrant A Data is divided into 100 sec bins |
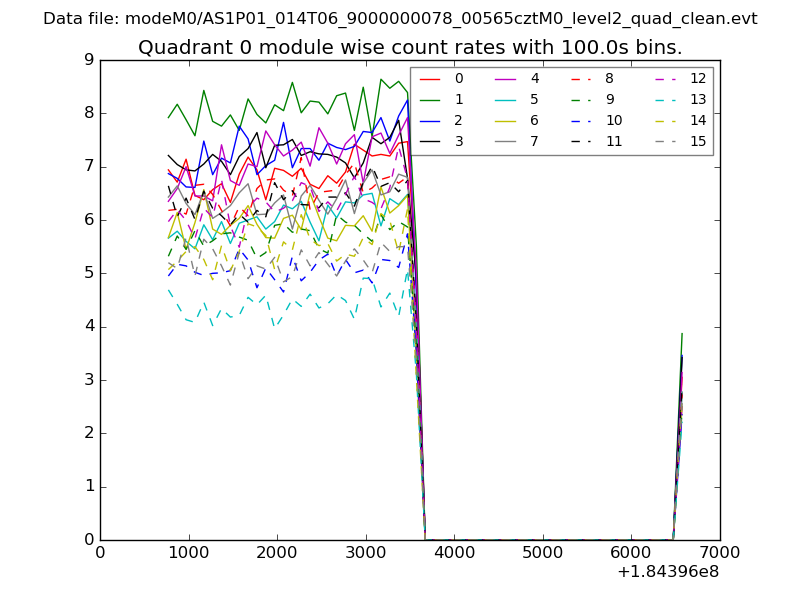 |
 |
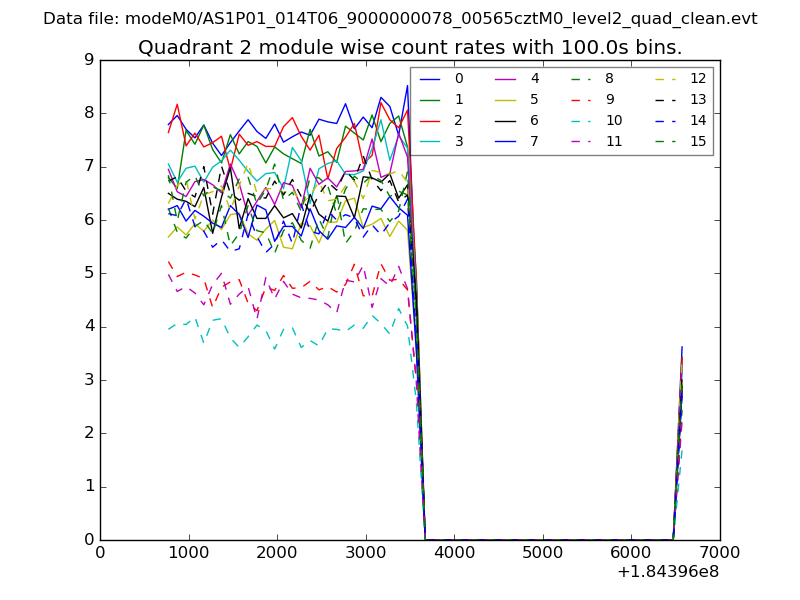
| Module-wise count rates for Quadrant B Data is divided into 100 sec bins |
 |
 |
| Module-wise count rates for Quadrant C Data is divided into 100 sec bins |
 |
 |
| Module-wise count rates for Quadrant D Data is divided into 100 sec bins |
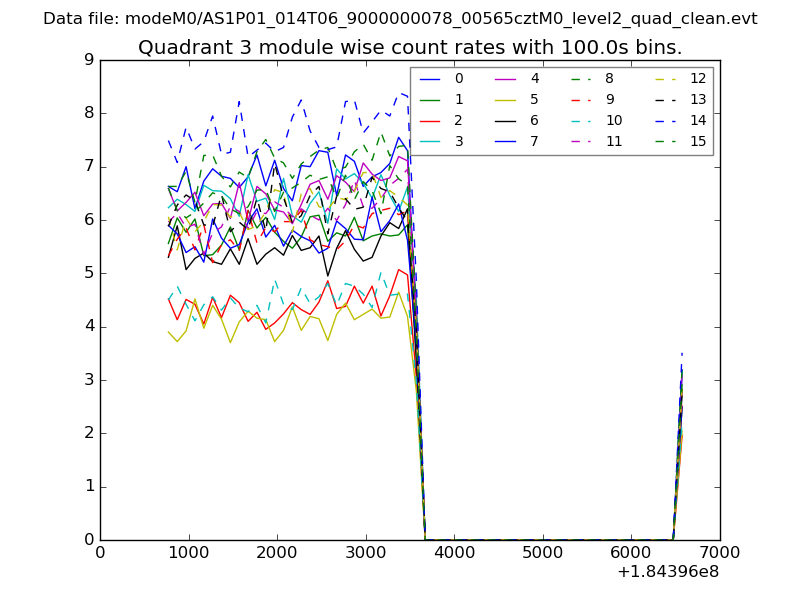 |
 |
| Parameter | Plot |
|---|---|
| CZT HV Monitor | 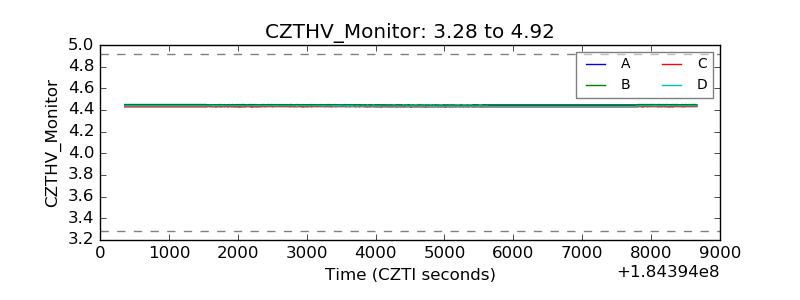 |
| D_VDD |  |
| Temperature 1 | 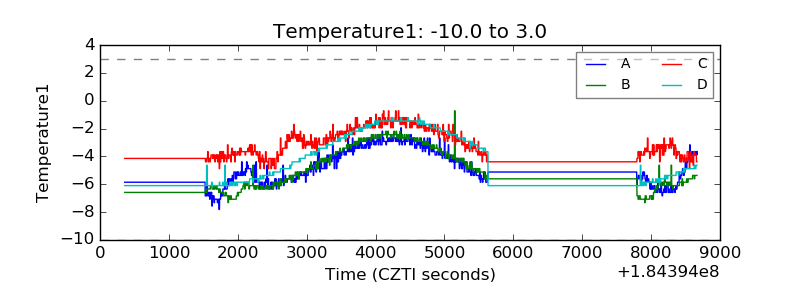 |
| Veto HV Monitor | 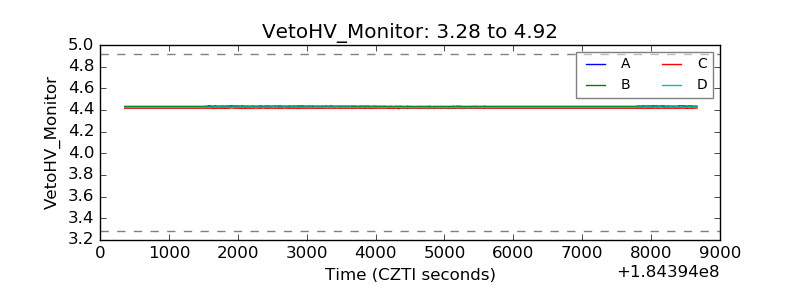 |
| Veto LLD | 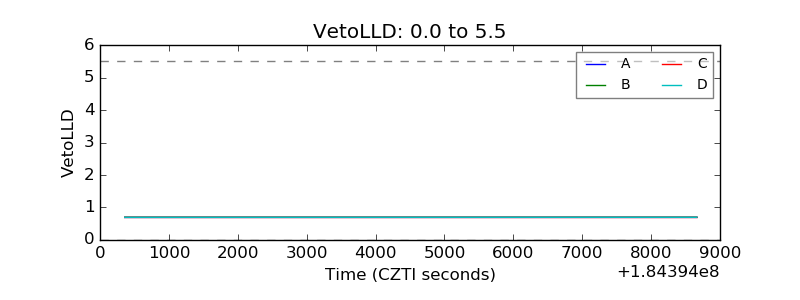 |
| Alpha Counter | 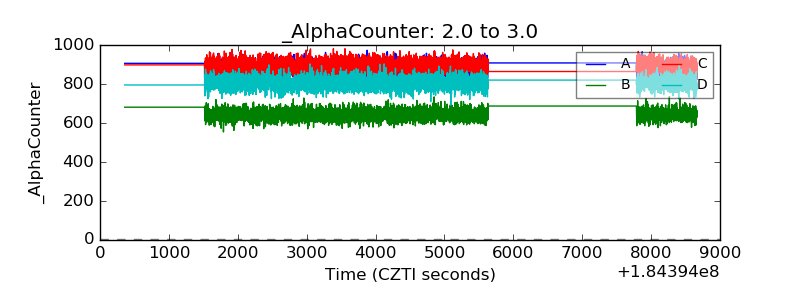 |
| _CPM_Rate | 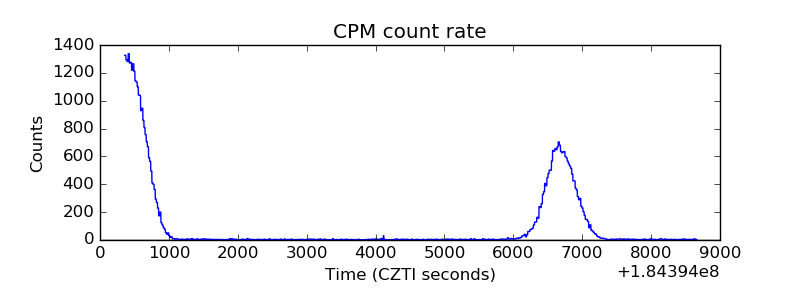 |
| CZT Counter | 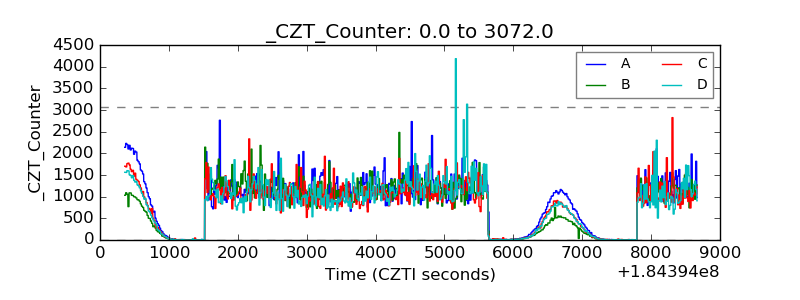 |
| +2.5 Volts monitor | 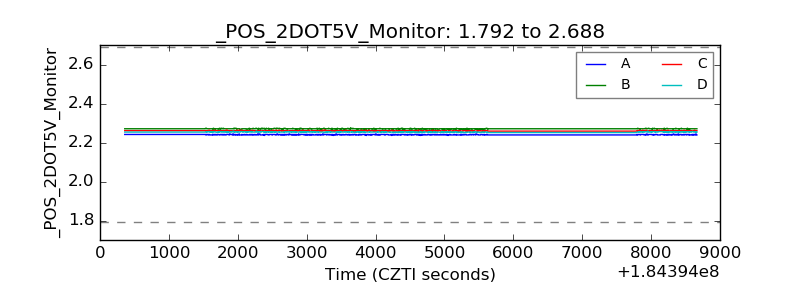 |
| +5 Volts monitor |  |
| _ROLL_ROT | 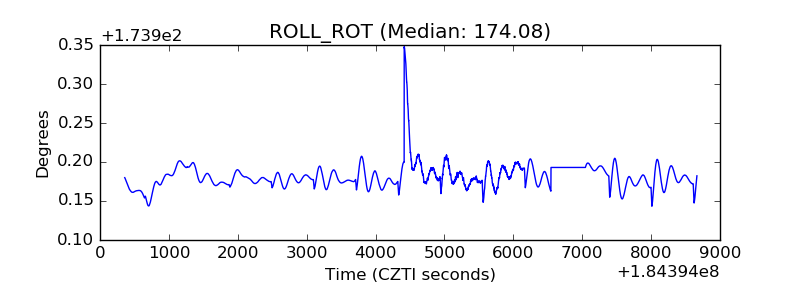 |
| _Roll_DEC | 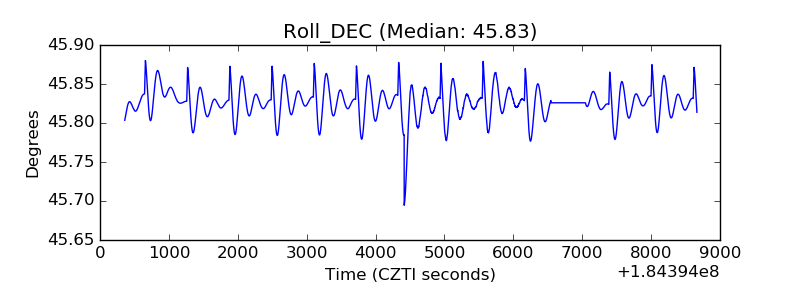 |
| _Roll_RA | 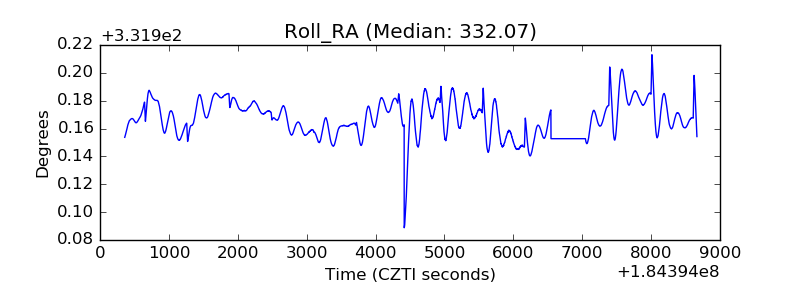 |
| Veto Counter | 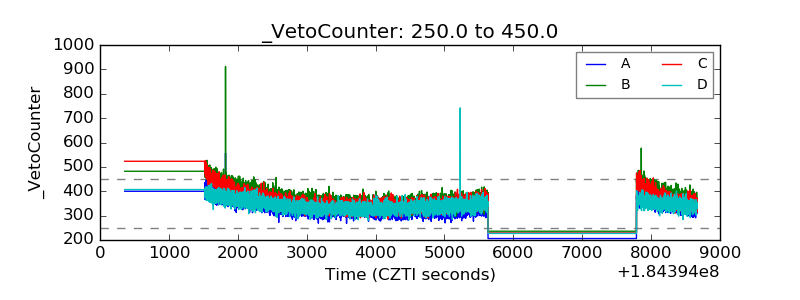 |