| Param | Original file | Final file |
|---|---|---|
| Filename | modeM0/AS1P01_014T06_9000000078_00566cztM0_level2.evt | modeM0/AS1P01_014T06_9000000078_00566cztM0_level2_quad_clean.evt |
| Size (bytes) | 785,851,200 | 59,195,520 |
| Size | 749.4 MB | 56.5 MB |
| Events in quadrant A | 6,259,181 | 362,796 |
| Events in quadrant B | 6,037,919 | 371,034 |
| Events in quadrant C | 5,387,376 | 363,702 |
| Events in quadrant D | 5,785,984 | 347,578 |
| Mode SS | |||
|---|---|---|---|
| Quadrant | BADHDUFLAG | Total packets | Discarded packets |
| A | 0 | 100 | 0 |
| B | 0 | 100 | 0 |
| C | 0 | 100 | 0 |
| D | 0 | 100 | 0 |
| Mode M9 | |||
|---|---|---|---|
| Quadrant | BADHDUFLAG | Total packets | Discarded packets |
| A | 0 | 29 | 0 |
| B | 0 | 29 | 0 |
| C | 0 | 29 | 0 |
| D | 0 | 30 | 0 |
| Mode M0 | |||
|---|---|---|---|
| Quadrant | BADHDUFLAG | Total packets | Discarded packets |
| A | 0 | 22110 | 3 |
| B | 0 | 21468 | 2 |
| C | 0 | 19497 | 2 |
| D | 0 | 20683 | 2 |
| Quadrant | Total seconds | Saturated seconds | Saturation percentage |
|---|---|---|---|
| A | 4951 | 18 | 0.363563% |
| B | 4951 | 4 | 0.080792% |
| C | 4951 | 3 | 0.060594% |
| D | 4951 | 19 | 0.383761% |
Noise dominated data is calculated using 1-second bins in cleaned event files. If a bin has >2000 counts, and if more than 50% of those come from <1% of pixels, then it is considered to be noise-dominated and hence unusable.
| Quadrant | # 1 sec bins | Bins with >0 counts | Bins with >2000 counts | High rate bins dominated by noise | Noise dominated (total time) | Noise dominated (detector-on time) | Marked lightcurve |
|---|---|---|---|---|---|---|---|
| A | 7106 | 4952 | 161 | 161 | 2.27% | 3.25% | 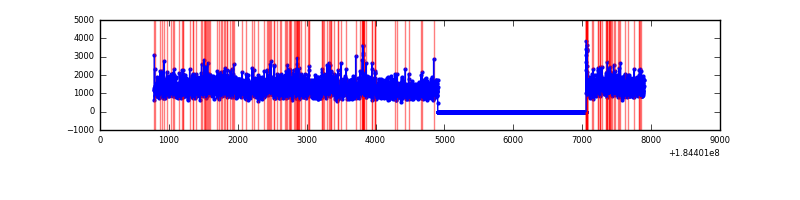 |
| B | 7106 | 4952 | 82 | 82 | 1.15% | 1.66% | 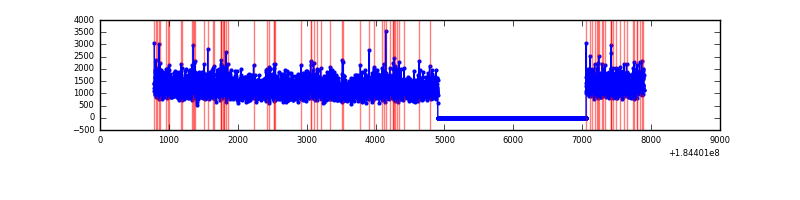 |
| C | 7106 | 4952 | 32 | 32 | 0.45% | 0.65% | 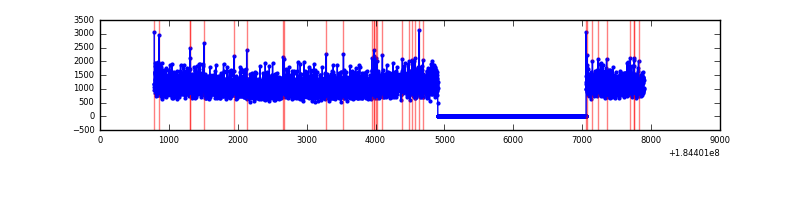 |
| D | 7106 | 4952 | 93 | 93 | 1.31% | 1.88% | 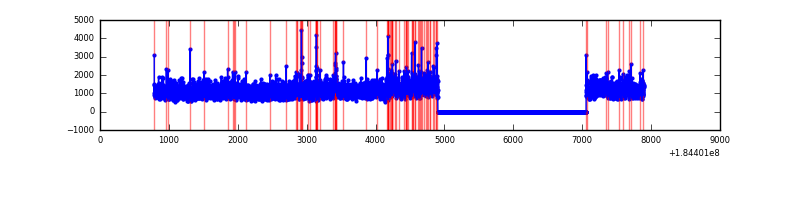 |
Top three noisy pixels from each quadrant. If the there are fewer than three noisy pixels in the level2.evt file, extra rows are filled as -1
| Pixel properties | Quadrant properties | ||||||
|---|---|---|---|---|---|---|---|
| Quadrant | DetID | PixID | Counts | Sigma | Mean | Median | Sigma |
| A | 14 | 79 | 123929 | 362.33 | 1534 | 1521 | 337.8 |
| A | 15 | 143 | 83916 | 243.89 | 1534 | 1521 | 337.8 |
| A | 0 | 238 | 78859 | 228.92 | 1534 | 1521 | 337.8 |
| B | 4 | 250 | 211055 | 591.43 | 1504 | 1517 | 354.3 |
| B | 4 | 235 | 15407 | 39.2 | 1504 | 1517 | 354.3 |
| B | 5 | 46 | 11106 | 27.07 | 1504 | 1517 | 354.3 |
| C | 5 | 249 | 49419 | 127.18 | 1352 | 1398 | 377.6 |
| C | 15 | 241 | 17310 | 42.14 | 1352 | 1398 | 377.6 |
| C | 14 | 239 | 13066 | 30.9 | 1352 | 1398 | 377.6 |
| D | 13 | 221 | 207022 | 495.65 | 1333 | 1388 | 414.9 |
| D | 1 | 4 | 144320 | 344.51 | 1333 | 1388 | 414.9 |
| D | 12 | 237 | 101289 | 240.79 | 1333 | 1388 | 414.9 |
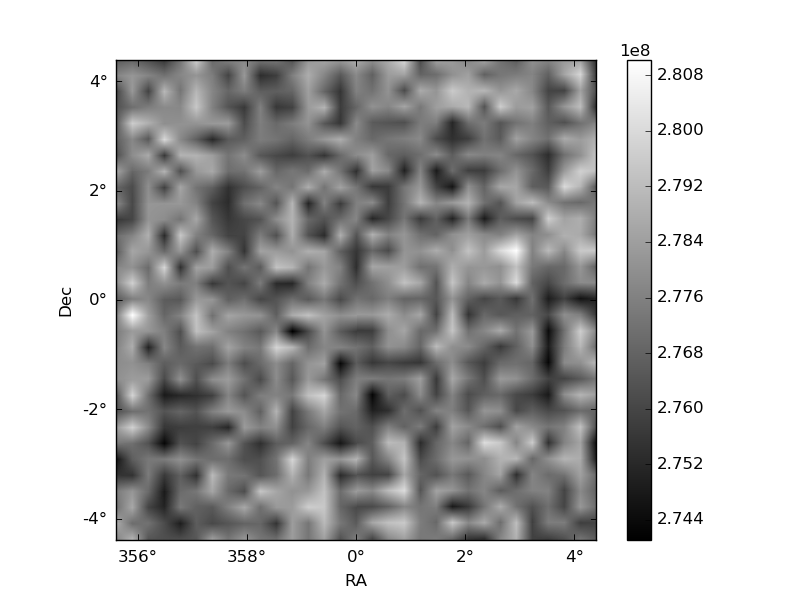
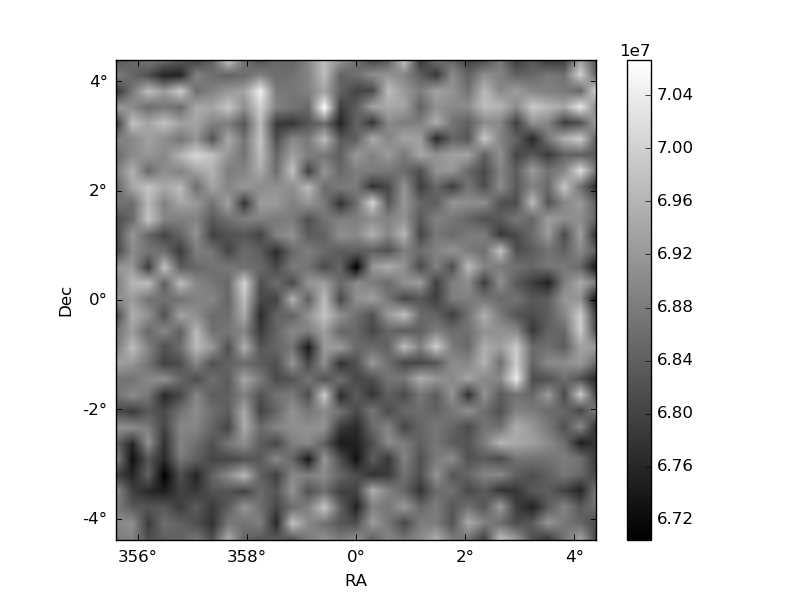
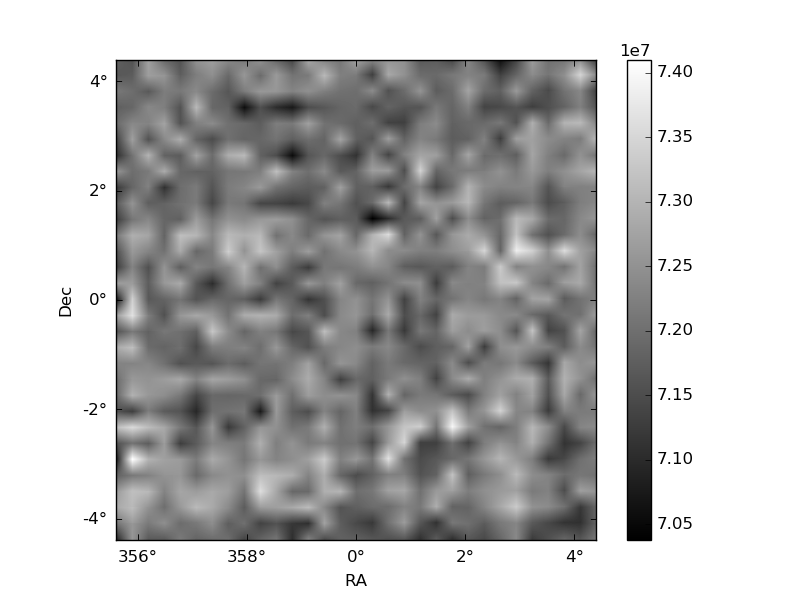
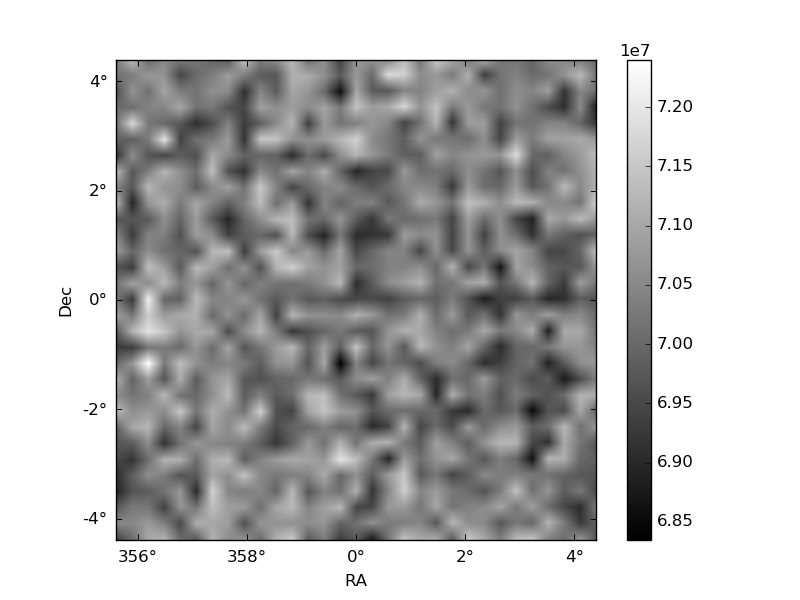
Histogram calculated using DETX and DETY for each event in the final _common_clean file
| Quadrant A | 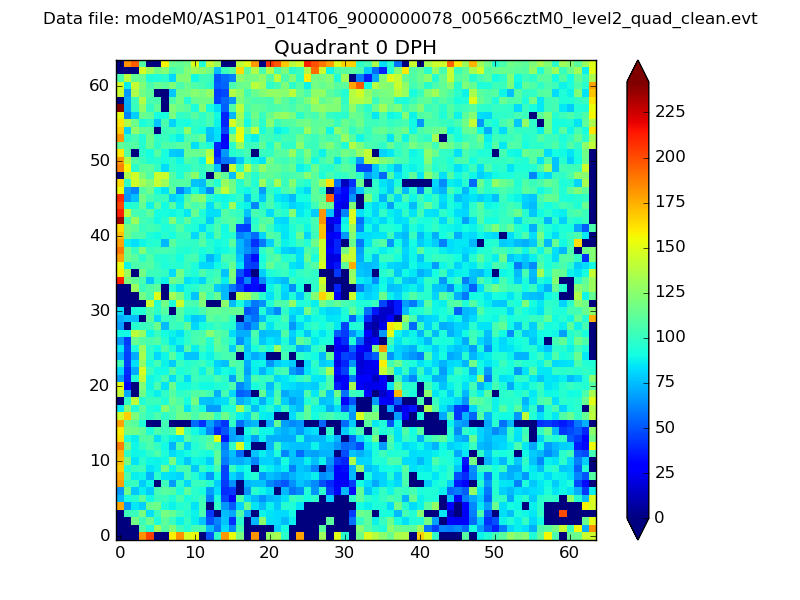 |
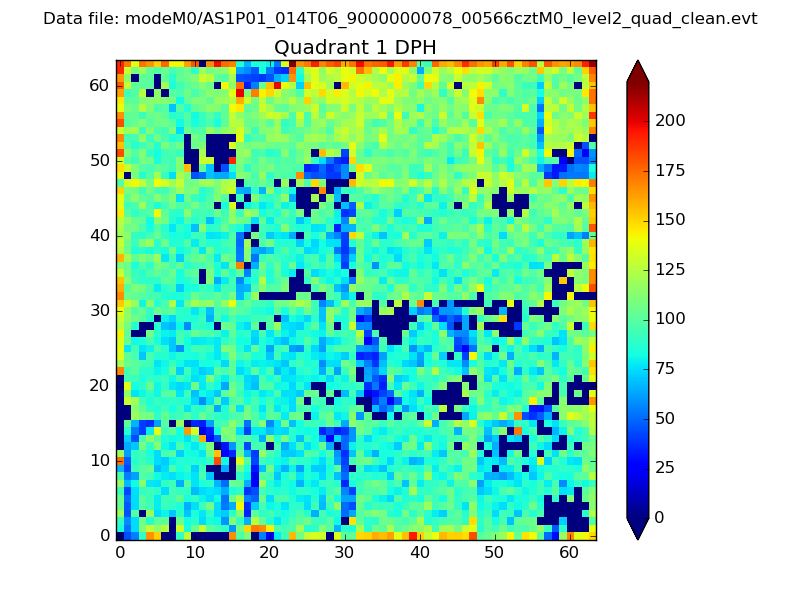 |
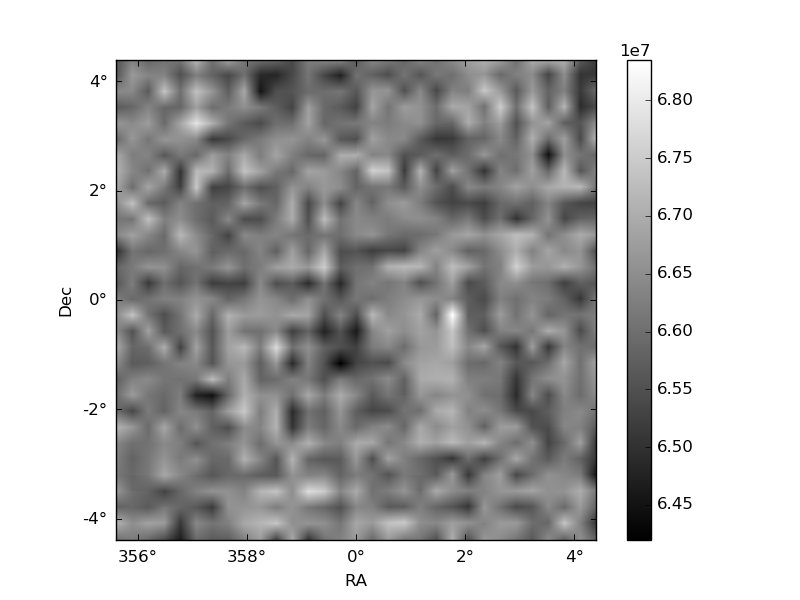
Quadrant B |
|---|---|---|---|
| Quadrant D | 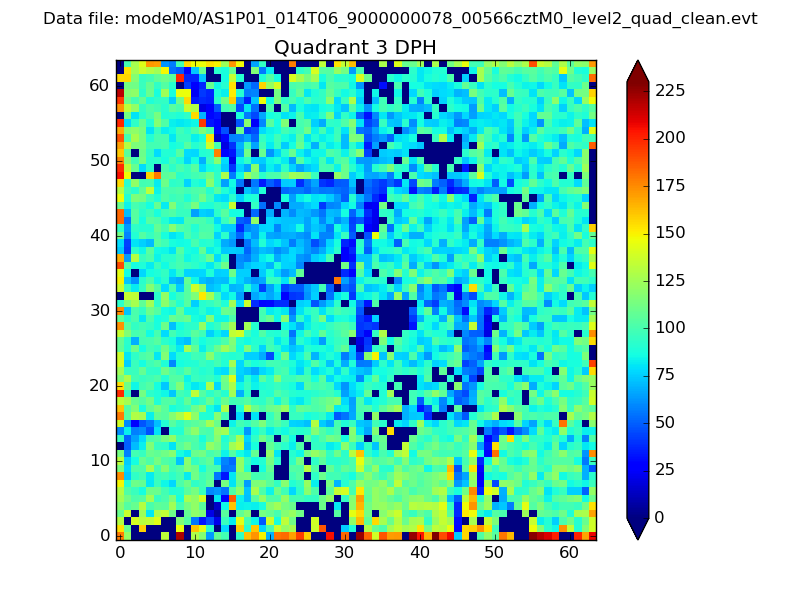 |
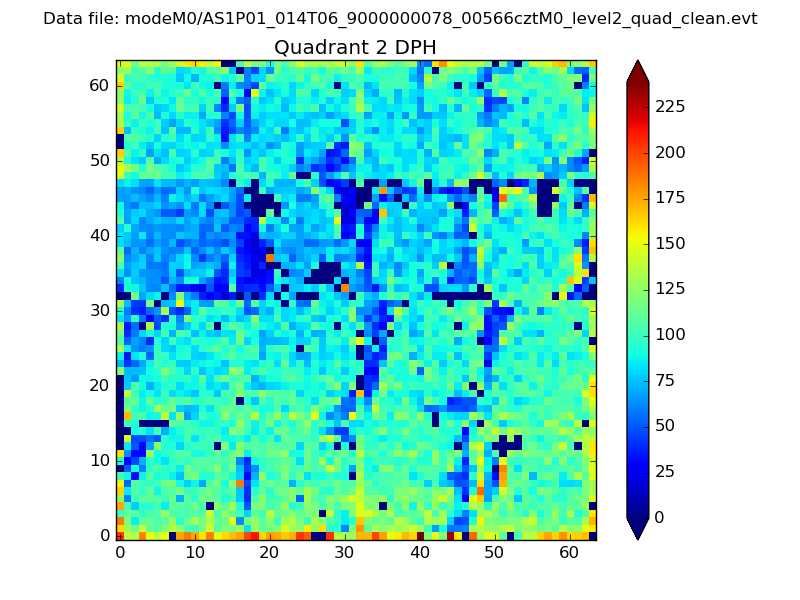 |
Quadrant C |
| Plot type | Count rate plots | Images |
|---|---|---|
| Comparison with Poisson distribution Blue bars denote a histogram of data divided into 1 sec bins. Red curve is a Poisson curve with rate = median count rate of data. |
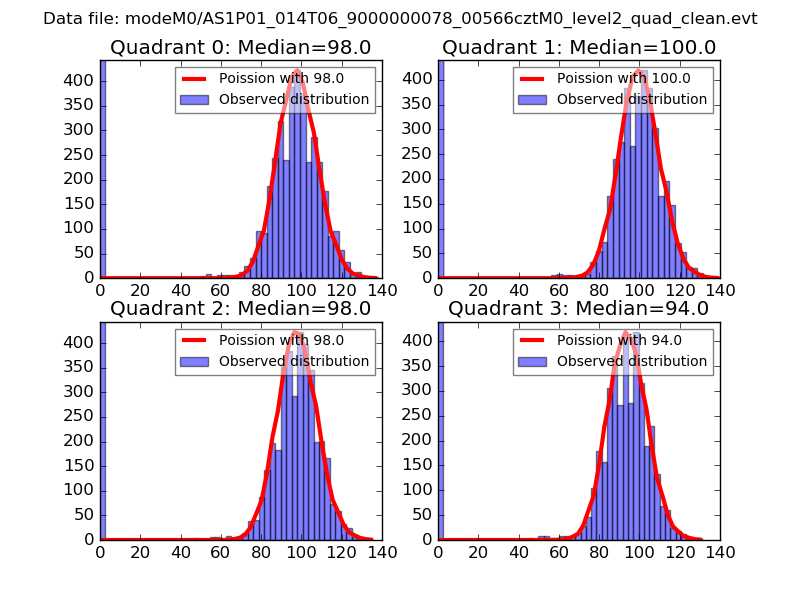 |
 |
| Quadrant-wise count rates Data is divided into 100 sec bins |
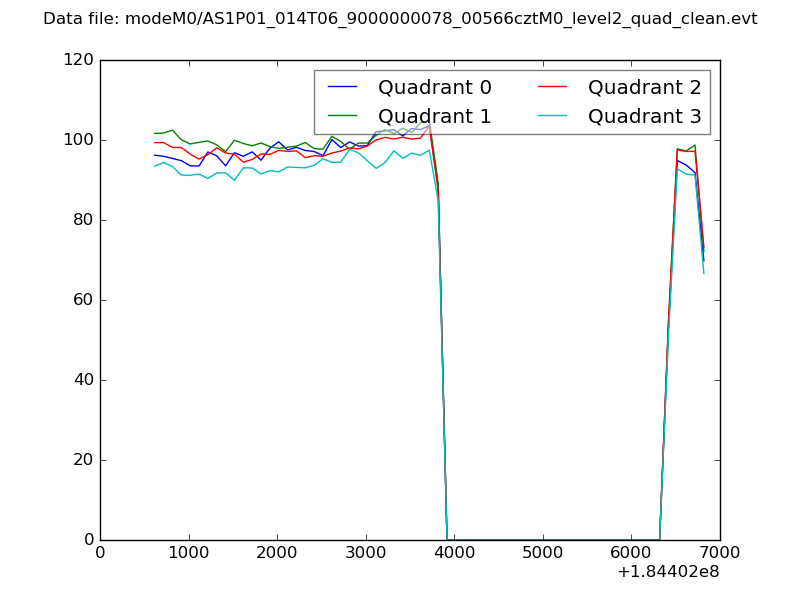 |
|
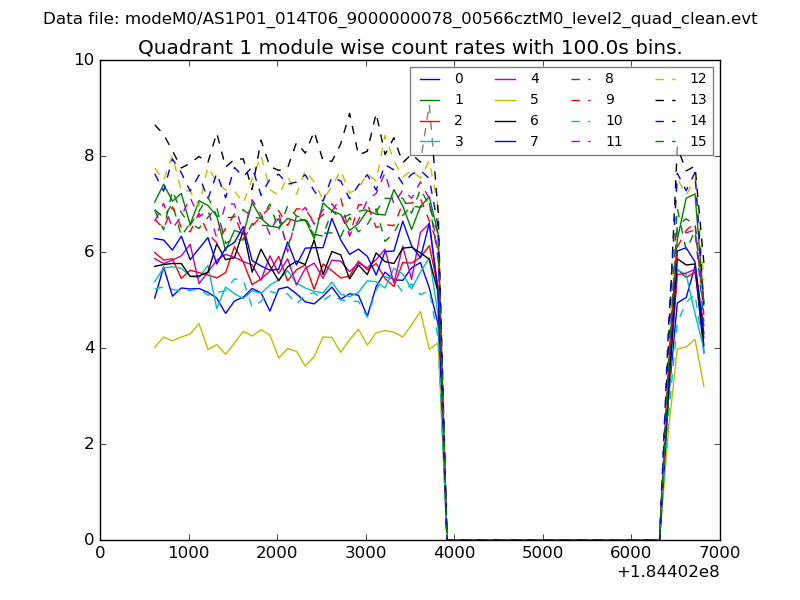
| Module-wise count rates for Quadrant A Data is divided into 100 sec bins |
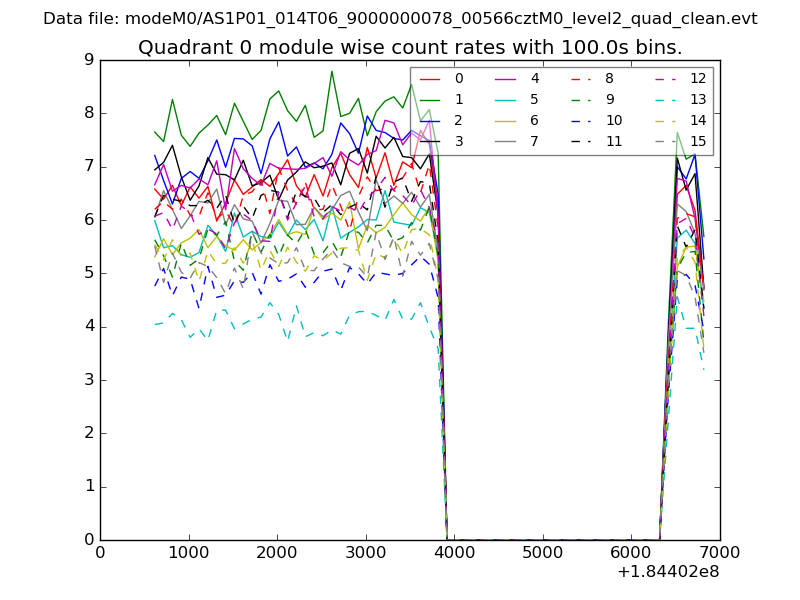 |
 |
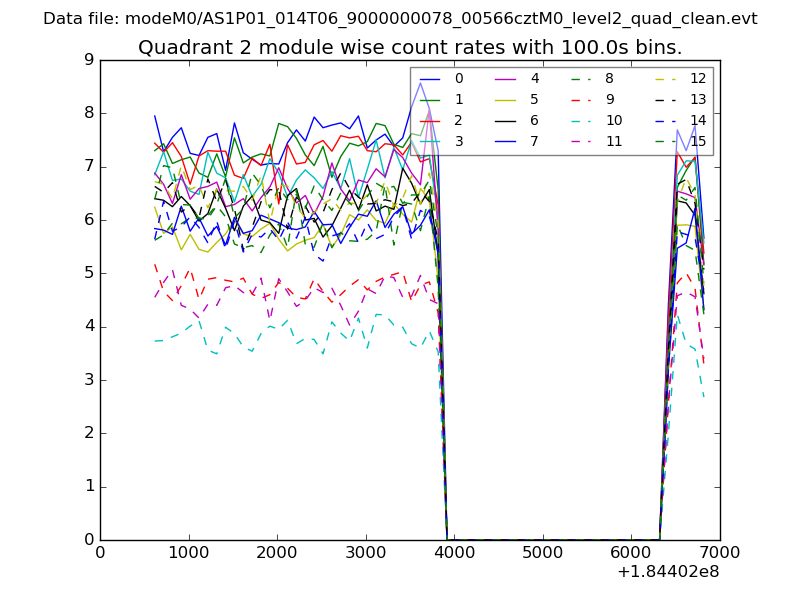
| Module-wise count rates for Quadrant B Data is divided into 100 sec bins |
 |
 |
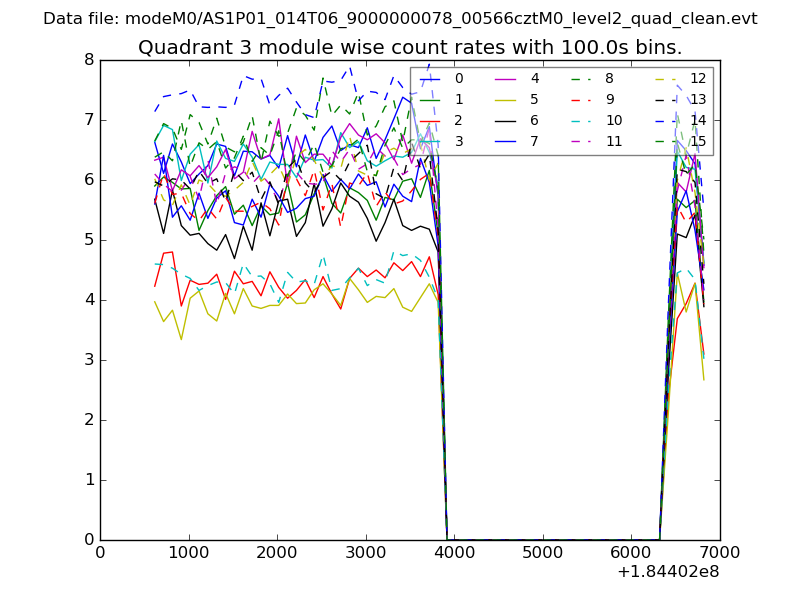
| Module-wise count rates for Quadrant C Data is divided into 100 sec bins |
 |
 |
| Module-wise count rates for Quadrant D Data is divided into 100 sec bins |
 |
 |
| Parameter | Plot |
|---|---|
| CZT HV Monitor | 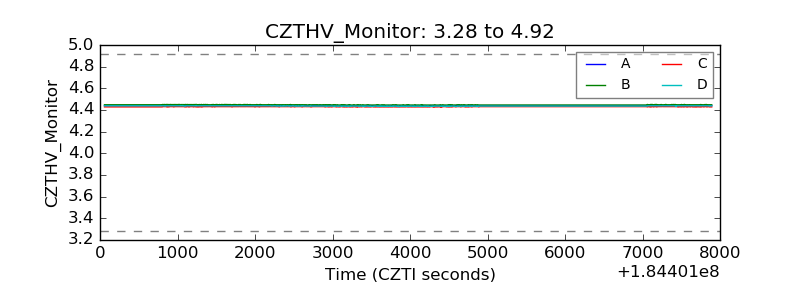 |
| D_VDD |  |
| Temperature 1 | 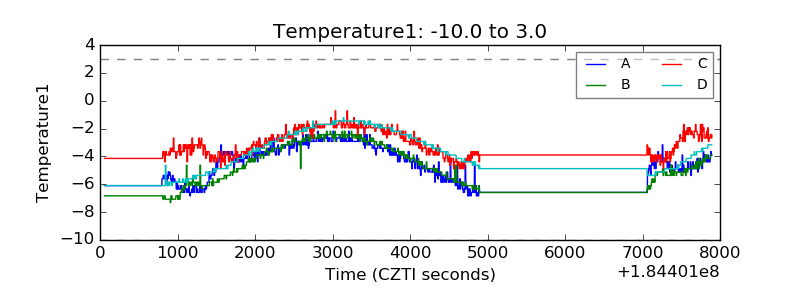 |
| Veto HV Monitor |  |
| Veto LLD | 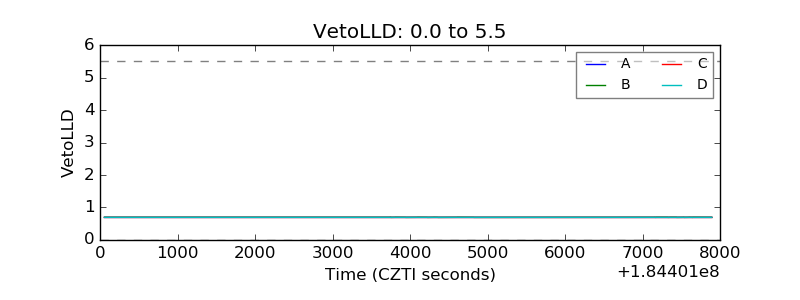 |
| Alpha Counter | 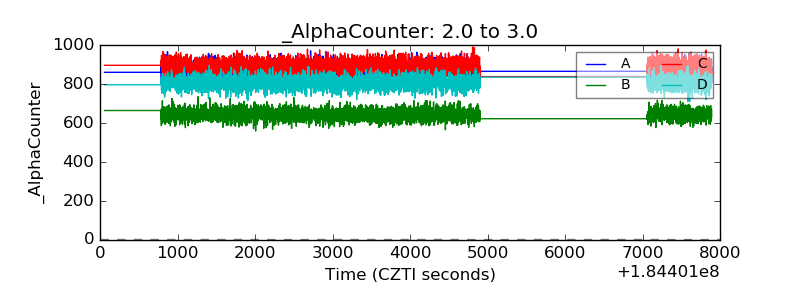 |
| _CPM_Rate | 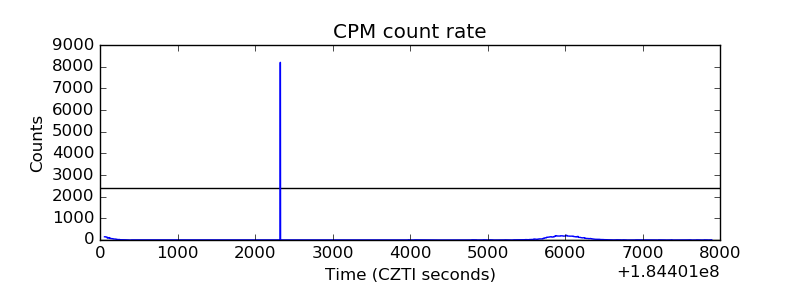 |
| CZT Counter | 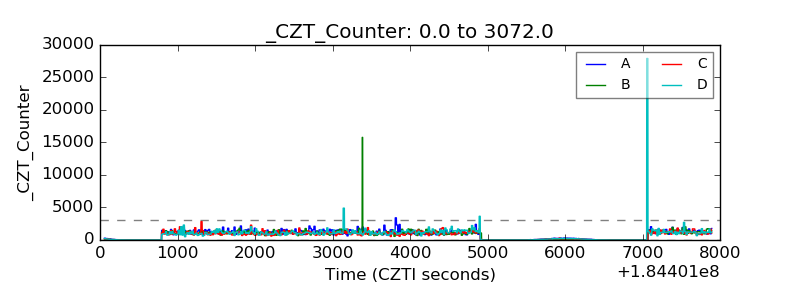 |
| +2.5 Volts monitor | 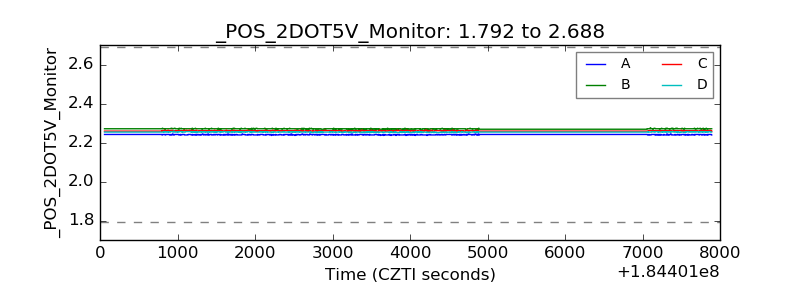 |
| +5 Volts monitor |  |
| _ROLL_ROT | 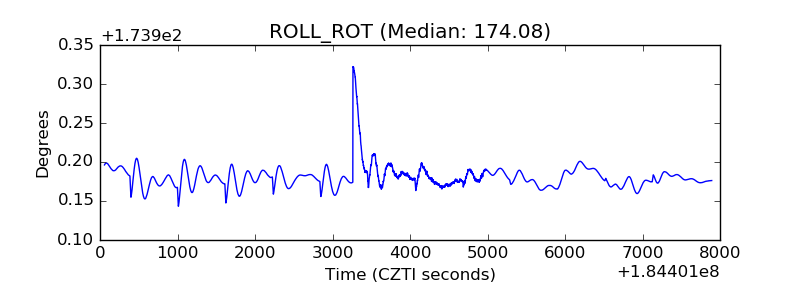 |
| _Roll_DEC | 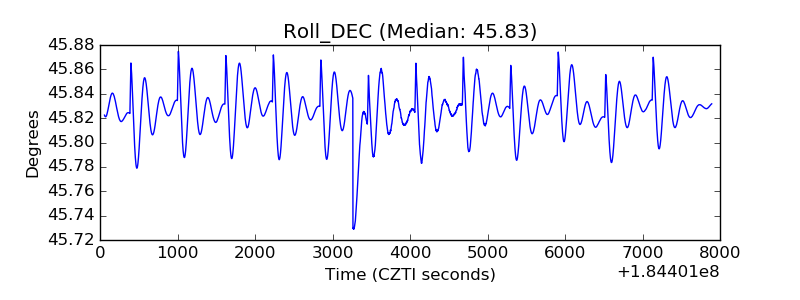 |
| _Roll_RA | 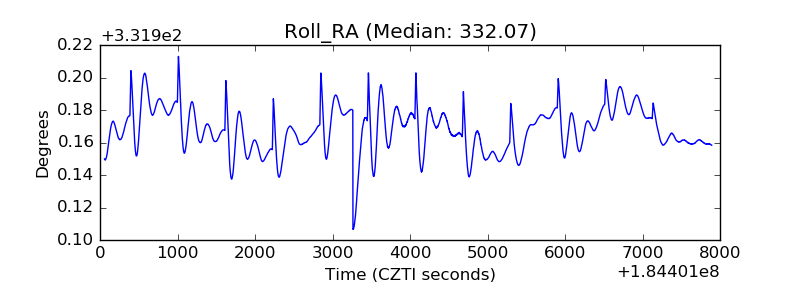 |
| Veto Counter | 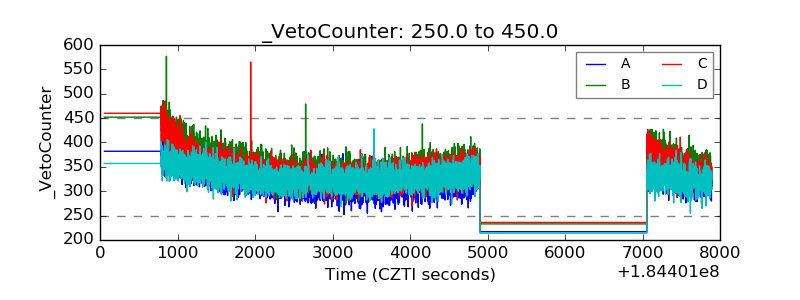 |