| Param | Original file | Final file |
|---|---|---|
| Filename | modeM0/AS1P01_014T06_9000000078_00567cztM0_level2.evt | modeM0/AS1P01_014T06_9000000078_00567cztM0_level2_quad_clean.evt |
| Size (bytes) | 794,675,520 | 68,633,280 |
| Size | 757.9 MB | 65.5 MB |
| Events in quadrant A | 6,089,952 | 436,545 |
| Events in quadrant B | 6,016,551 | 445,107 |
| Events in quadrant C | 5,319,026 | 437,506 |
| Events in quadrant D | 6,315,804 | 415,347 |
| Mode SS | |||
|---|---|---|---|
| Quadrant | BADHDUFLAG | Total packets | Discarded packets |
| A | 0 | 100 | 0 |
| B | 0 | 100 | 0 |
| C | 0 | 100 | 0 |
| D | 0 | 100 | 0 |
| Mode M9 | |||
|---|---|---|---|
| Quadrant | BADHDUFLAG | Total packets | Discarded packets |
| A | 0 | 21 | 0 |
| B | 0 | 21 | 0 |
| C | 0 | 21 | 0 |
| D | 0 | 21 | 0 |
| Mode M0 | |||
|---|---|---|---|
| Quadrant | BADHDUFLAG | Total packets | Discarded packets |
| A | 0 | 21561 | 2 |
| B | 0 | 21350 | 1 |
| C | 0 | 19287 | 1 |
| D | 0 | 22250 | 1 |
| Quadrant | Total seconds | Saturated seconds | Saturation percentage |
|---|---|---|---|
| A | 4897 | 8 | 0.163365% |
| B | 4897 | 8 | 0.163365% |
| C | 4897 | 2 | 0.040841% |
| D | 4897 | 81 | 1.654074% |
Noise dominated data is calculated using 1-second bins in cleaned event files. If a bin has >2000 counts, and if more than 50% of those come from <1% of pixels, then it is considered to be noise-dominated and hence unusable.
| Quadrant | # 1 sec bins | Bins with >0 counts | Bins with >2000 counts | High rate bins dominated by noise | Noise dominated (total time) | Noise dominated (detector-on time) | Marked lightcurve |
|---|---|---|---|---|---|---|---|
| A | 7053 | 4898 | 155 | 155 | 2.20% | 3.16% | 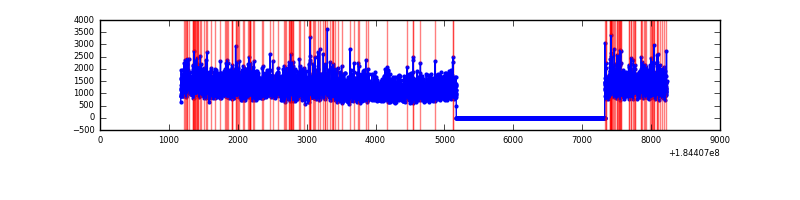 |
| B | 7053 | 4898 | 102 | 102 | 1.45% | 2.08% | 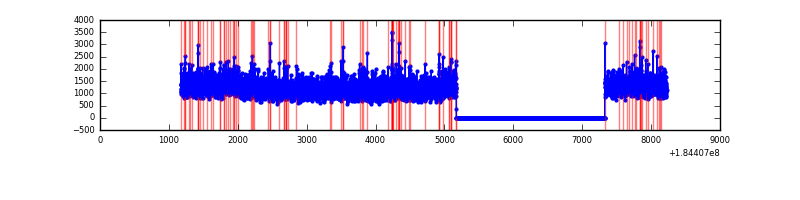 |
| C | 7053 | 4898 | 35 | 35 | 0.50% | 0.71% | 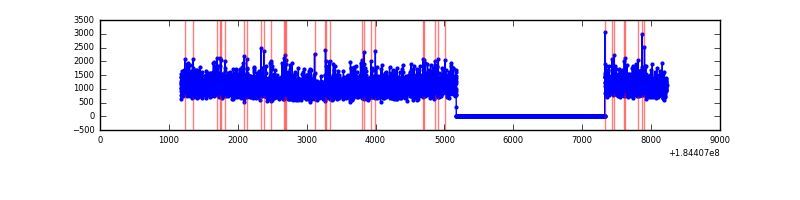 |
| D | 7053 | 4898 | 257 | 257 | 3.64% | 5.25% | 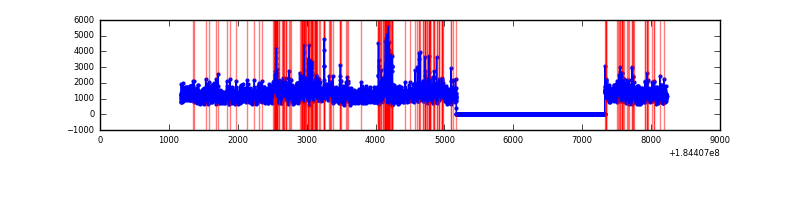 |
Top three noisy pixels from each quadrant. If the there are fewer than three noisy pixels in the level2.evt file, extra rows are filled as -1
| Pixel properties | Quadrant properties | ||||||
|---|---|---|---|---|---|---|---|
| Quadrant | DetID | PixID | Counts | Sigma | Mean | Median | Sigma |
| A | 0 | 238 | 89716 | 263.96 | 1504 | 1484 | 334.3 |
| A | 0 | 149 | 79192 | 232.47 | 1504 | 1484 | 334.3 |
| A | 15 | 143 | 62368 | 182.14 | 1504 | 1484 | 334.3 |
| B | 4 | 250 | 284954 | 816.17 | 1466 | 1479 | 347.3 |
| B | 8 | 4 | 19876 | 52.97 | 1466 | 1479 | 347.3 |
| B | 15 | 185 | 18427 | 48.8 | 1466 | 1479 | 347.3 |
| C | 5 | 249 | 46112 | 119.28 | 1335 | 1384 | 375.0 |
| C | 15 | 241 | 23374 | 58.64 | 1335 | 1384 | 375.0 |
| C | 3 | 159 | 6241 | 12.95 | 1335 | 1384 | 375.0 |
| D | 12 | 237 | 496914 | 1202.58 | 1311 | 1362 | 412.1 |
| D | 1 | 4 | 262235 | 633.07 | 1311 | 1362 | 412.1 |
| D | 13 | 221 | 104947 | 251.37 | 1311 | 1362 | 412.1 |
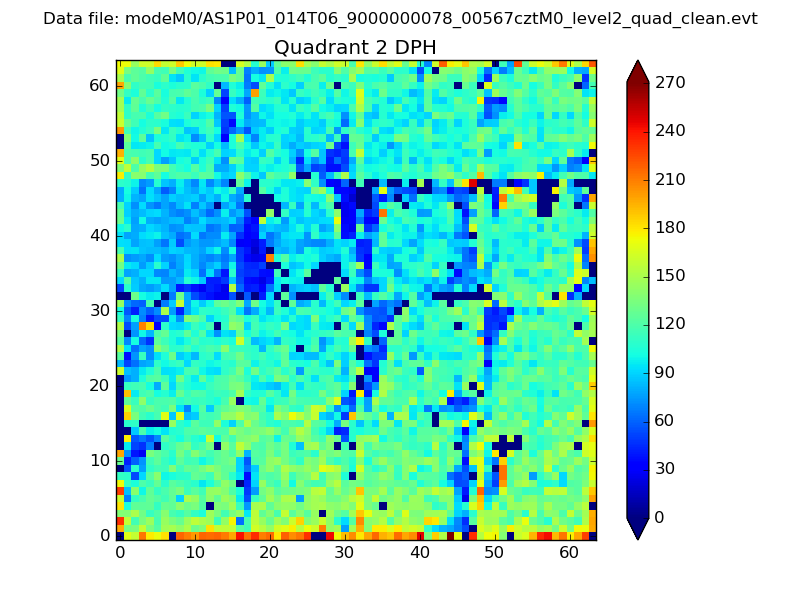
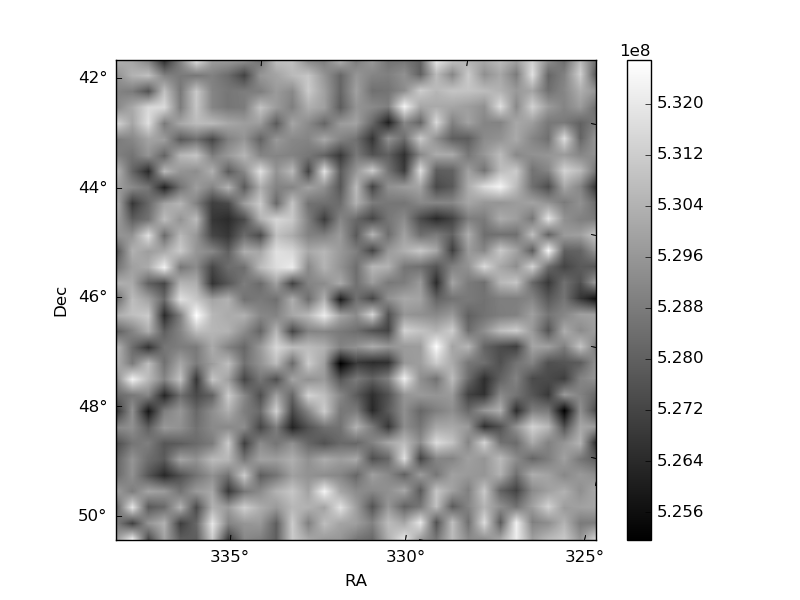
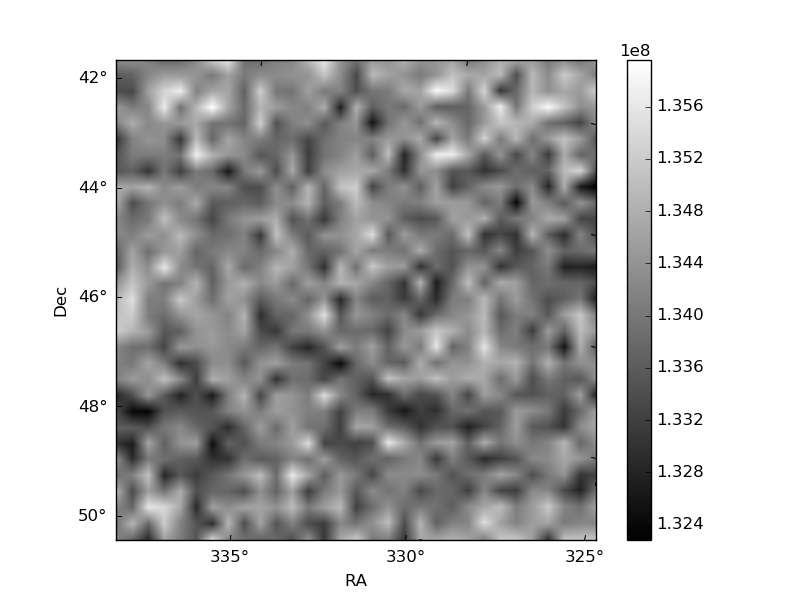
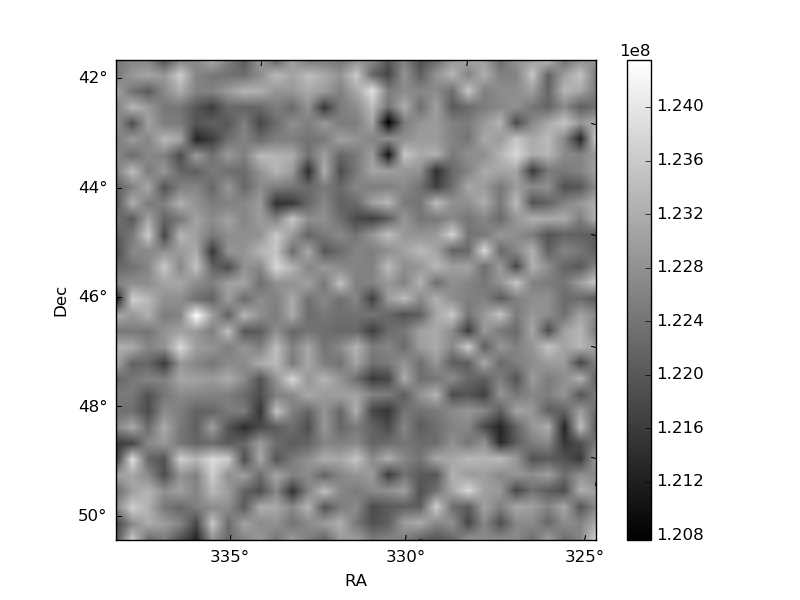
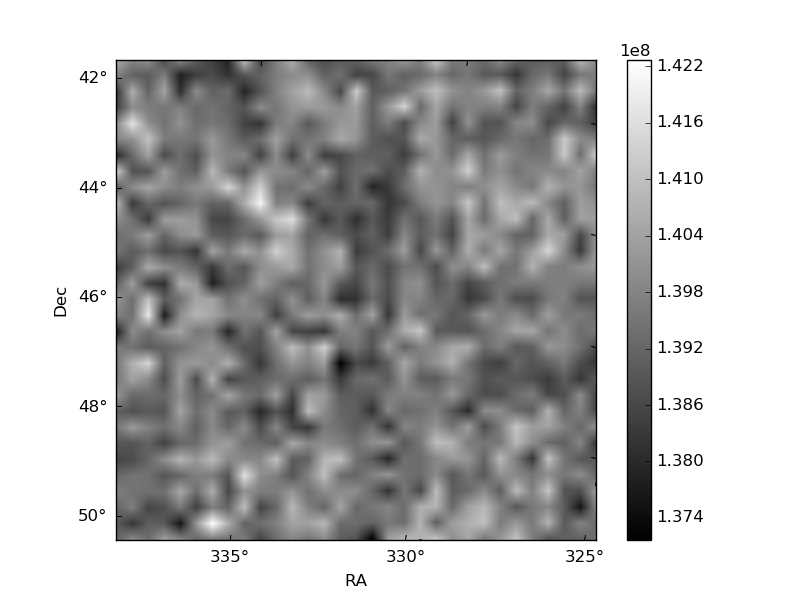
Histogram calculated using DETX and DETY for each event in the final _common_clean file
| Quadrant A | 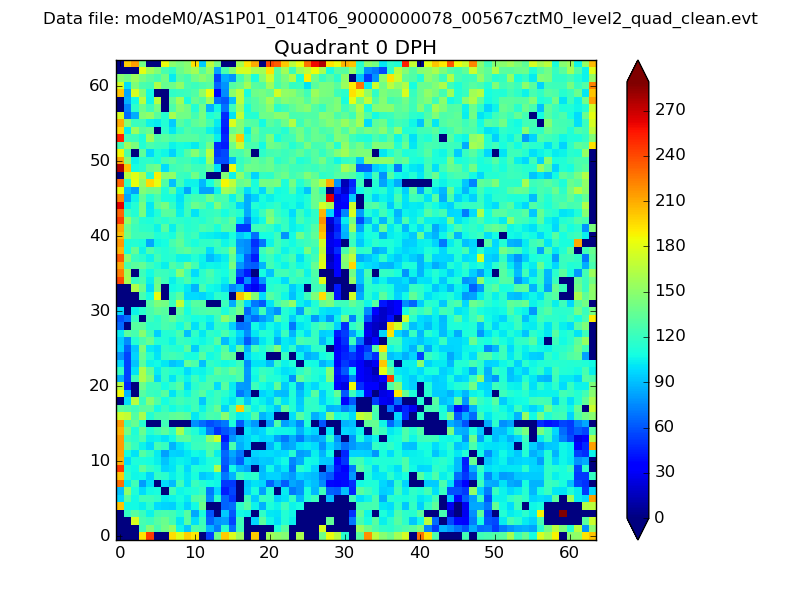 |
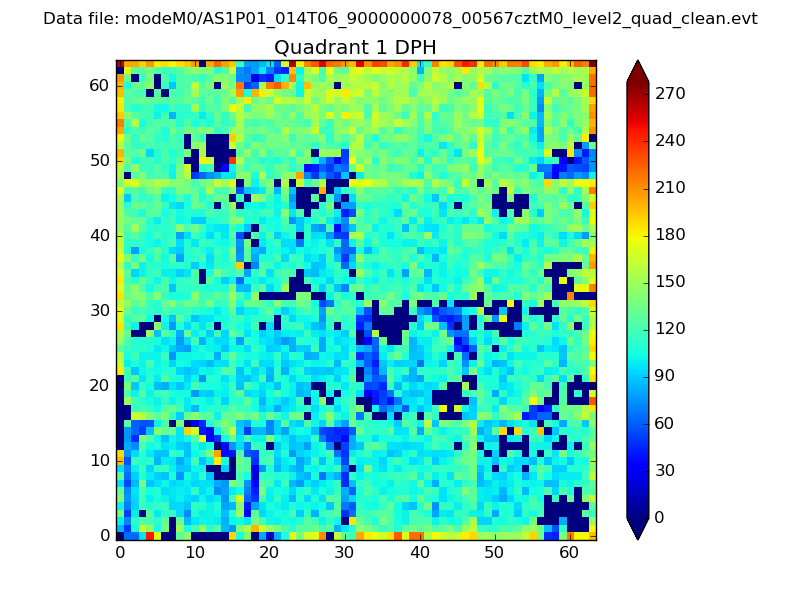 |
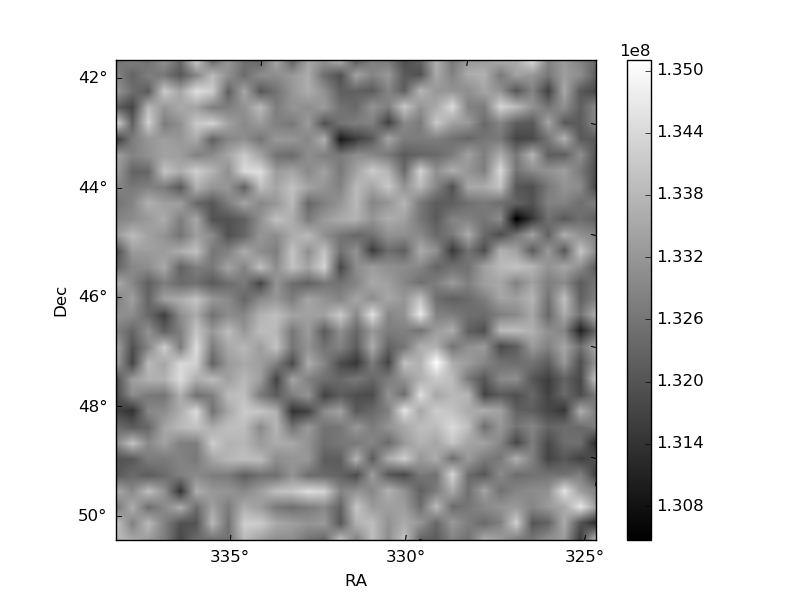
Quadrant B |
|---|---|---|---|
| Quadrant D | 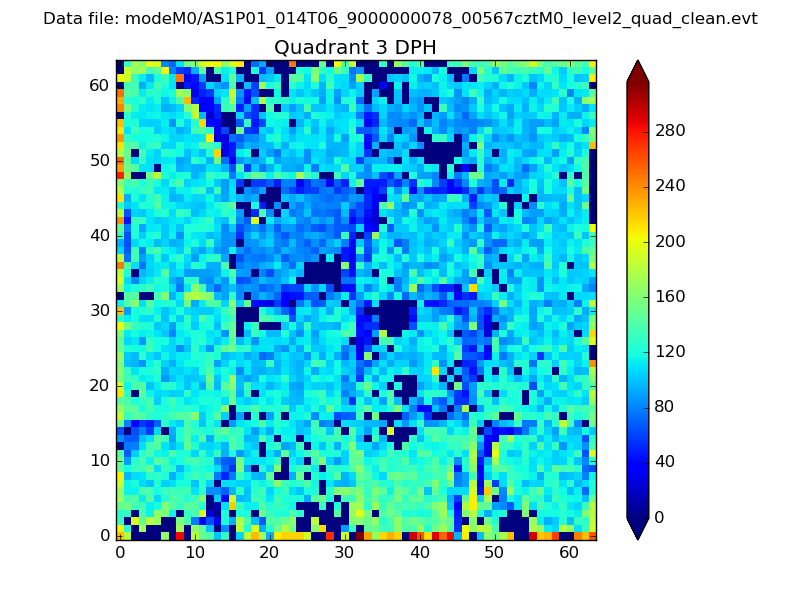 |
 |
Quadrant C |
| Plot type | Count rate plots | Images |
|---|---|---|
| Comparison with Poisson distribution Blue bars denote a histogram of data divided into 1 sec bins. Red curve is a Poisson curve with rate = median count rate of data. |
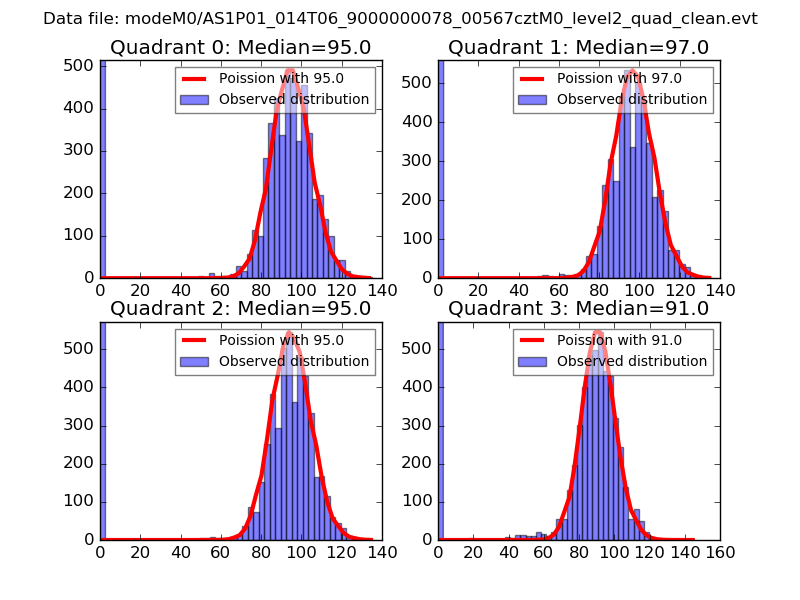 |
 |
| Quadrant-wise count rates Data is divided into 100 sec bins |
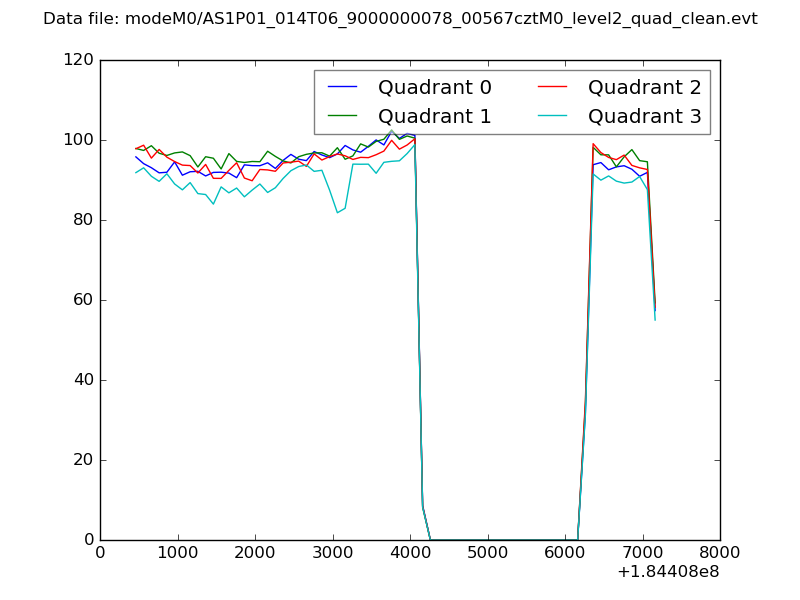 |
|
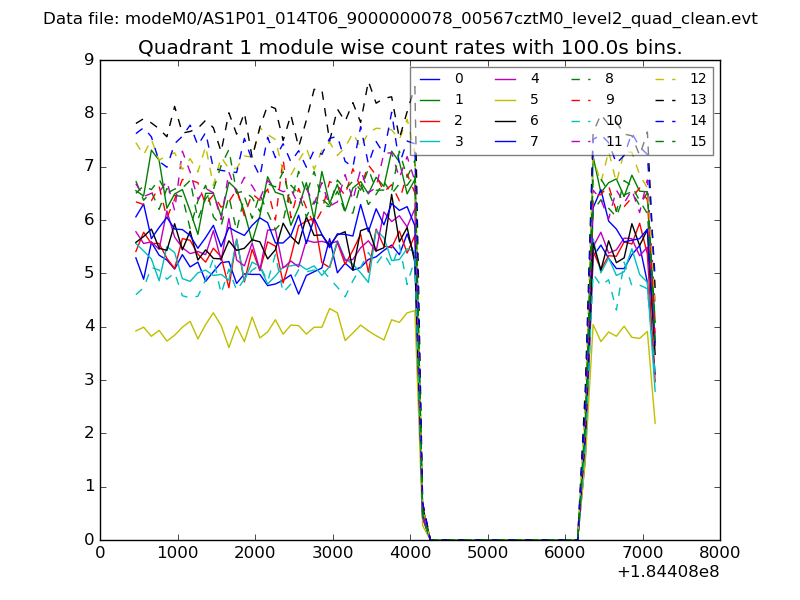
| Module-wise count rates for Quadrant A Data is divided into 100 sec bins |
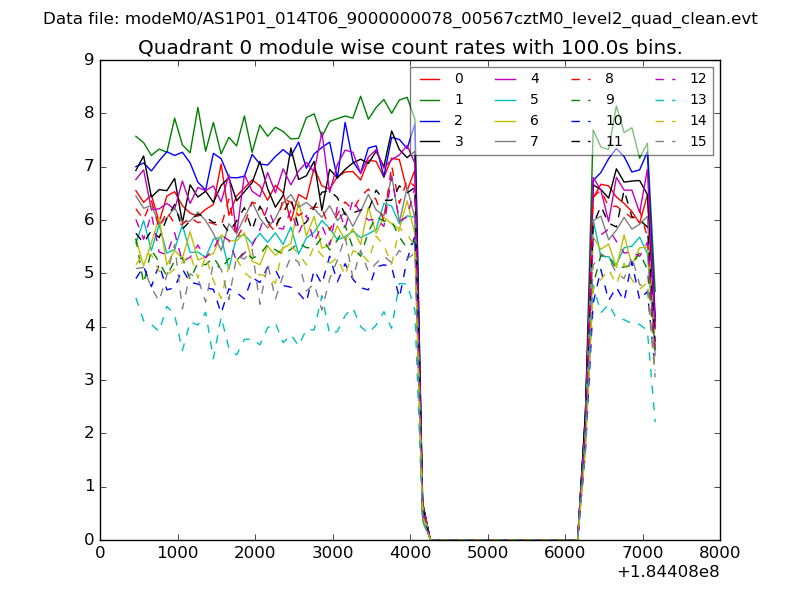 |
 |
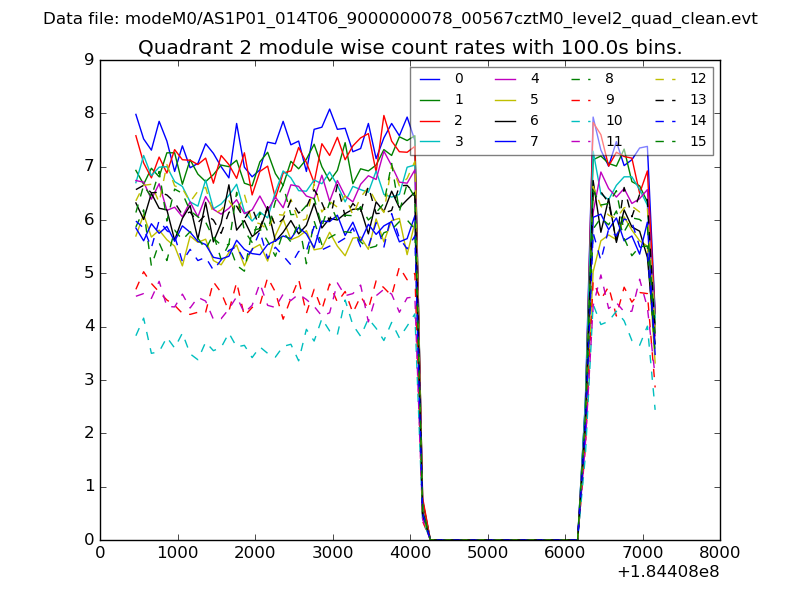
| Module-wise count rates for Quadrant B Data is divided into 100 sec bins |
 |
 |
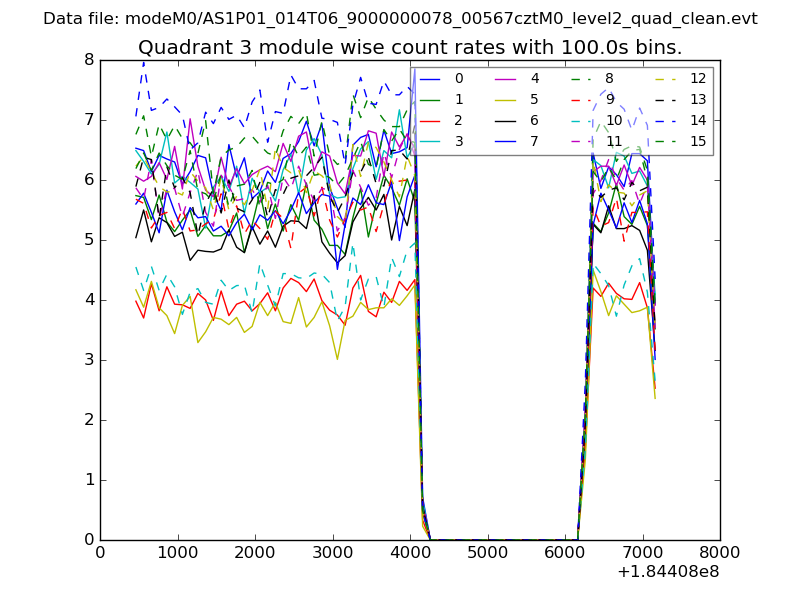
| Module-wise count rates for Quadrant C Data is divided into 100 sec bins |
 |
 |
| Module-wise count rates for Quadrant D Data is divided into 100 sec bins |
 |
 |
| Parameter | Plot |
|---|---|
| CZT HV Monitor | 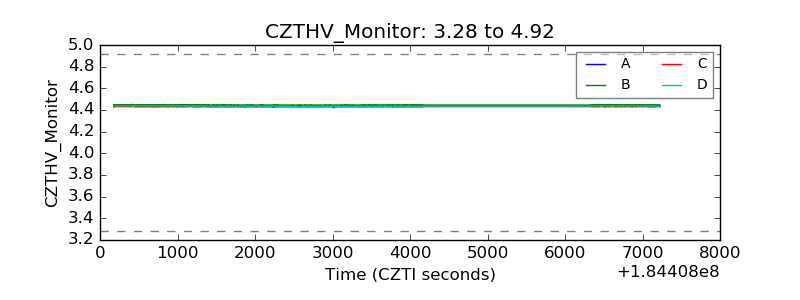 |
| D_VDD | 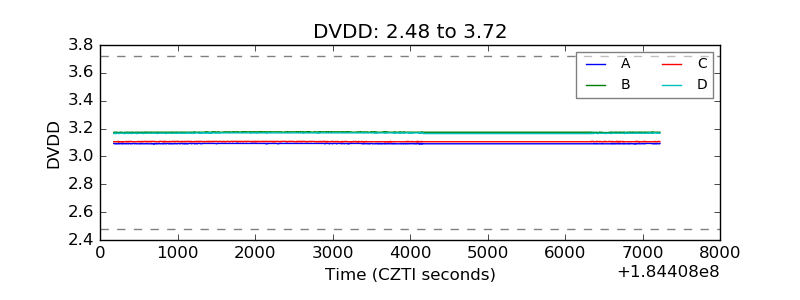 |
| Temperature 1 | 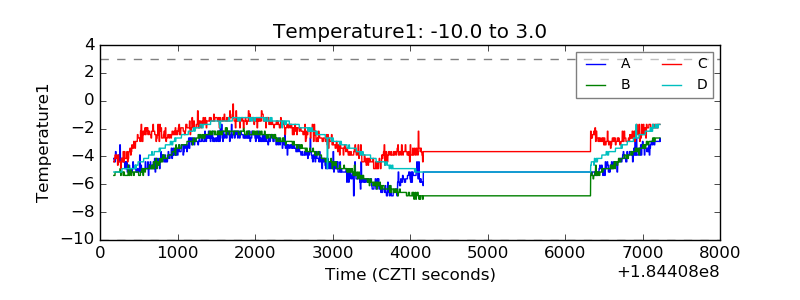 |
| Veto HV Monitor | 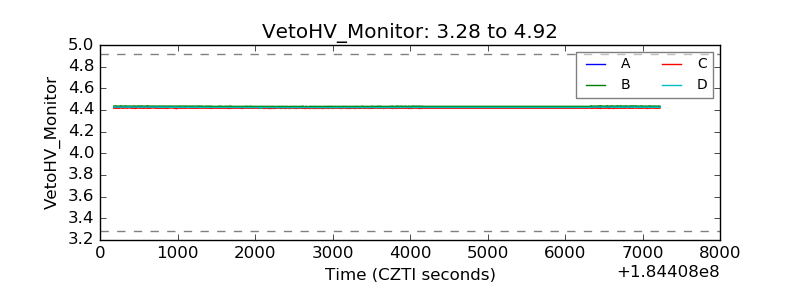 |
| Veto LLD | 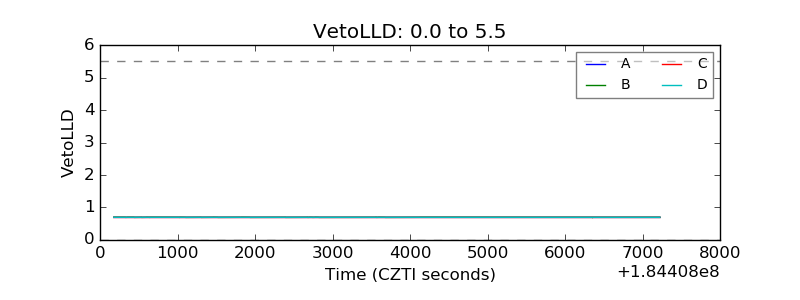 |
| Alpha Counter | 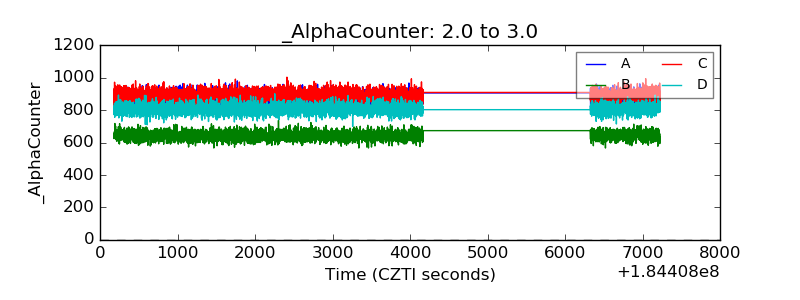 |
| _CPM_Rate | 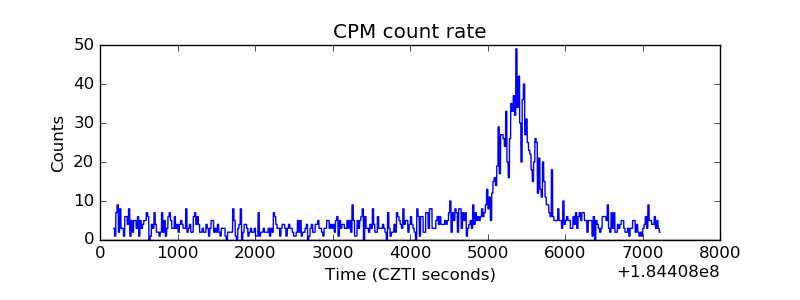 |
| CZT Counter | 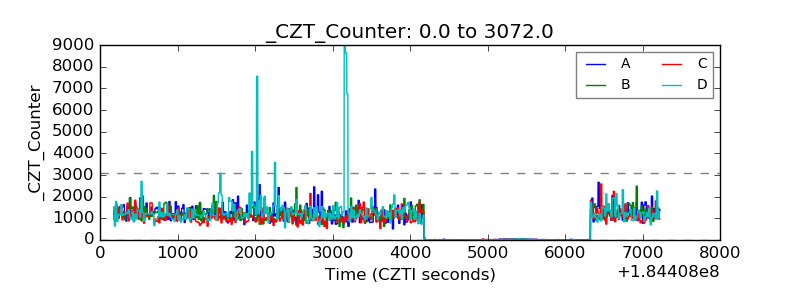 |
| +2.5 Volts monitor | 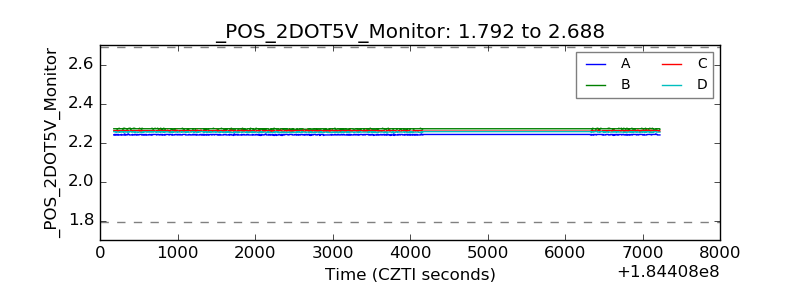 |
| +5 Volts monitor | 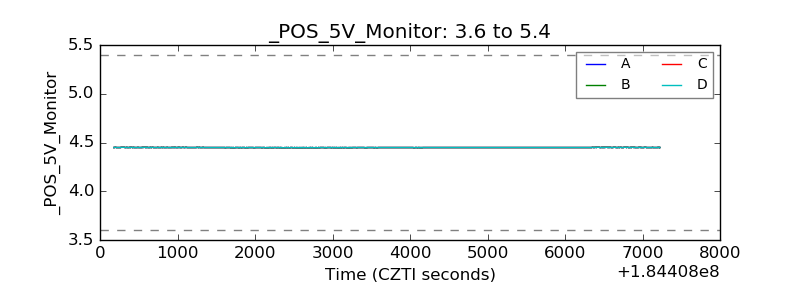 |
| _ROLL_ROT | 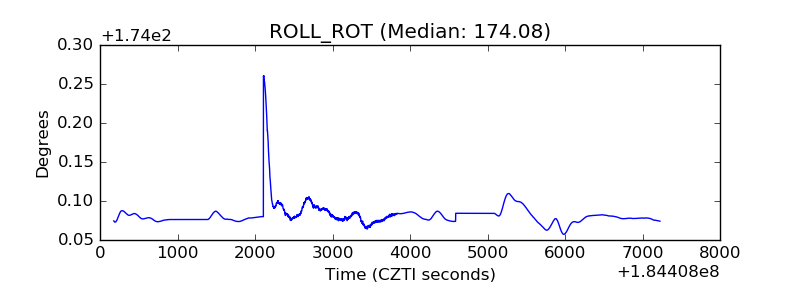 |
| _Roll_DEC | 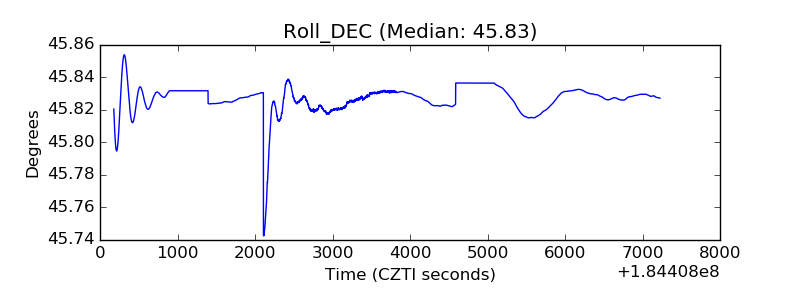 |
| _Roll_RA | 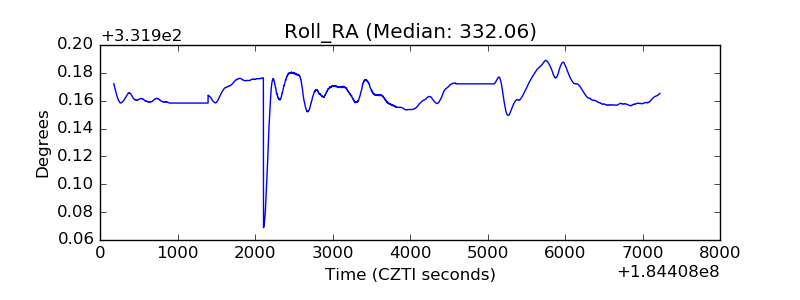 |
| Veto Counter | 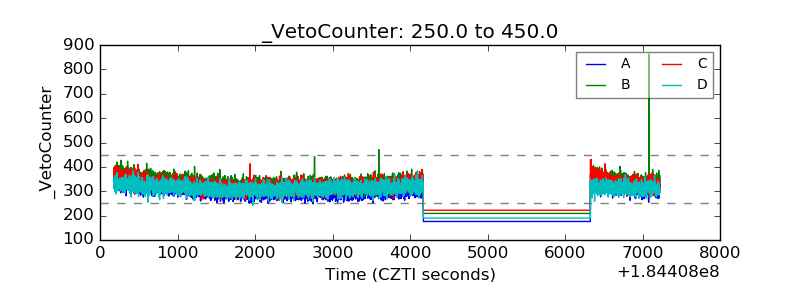 |