| Param | Original file | Final file |
|---|---|---|
| Filename | modeM0/AS1P01_014T06_9000000078_00569cztM0_level2.evt | modeM0/AS1P01_014T06_9000000078_00569cztM0_level2_quad_clean.evt |
| Size (bytes) | 694,707,840 | 50,091,840 |
| Size | 662.5 MB | 47.8 MB |
| Events in quadrant A | 5,101,670 | 303,737 |
| Events in quadrant B | 4,791,688 | 289,595 |
| Events in quadrant C | 4,412,786 | 301,410 |
| Events in quadrant D | 6,457,945 | 330,389 |
| Mode SS | |||
|---|---|---|---|
| Quadrant | BADHDUFLAG | Total packets | Discarded packets |
| A | 0 | 84 | 0 |
| B | 0 | 84 | 0 |
| C | 0 | 84 | 0 |
| D | 0 | 84 | 0 |
| Mode M9 | |||
|---|---|---|---|
| Quadrant | BADHDUFLAG | Total packets | Discarded packets |
| A | 0 | 24 | 0 |
| B | 0 | 24 | 0 |
| C | 0 | 24 | 0 |
| D | 0 | 25 | 0 |
| Mode M0 | |||
|---|---|---|---|
| Quadrant | BADHDUFLAG | Total packets | Discarded packets |
| A | 0 | 18086 | 1 |
| B | 0 | 17188 | 1 |
| C | 0 | 16025 | 1 |
| D | 0 | 22131 | 1 |
| Quadrant | Total seconds | Saturated seconds | Saturation percentage |
|---|---|---|---|
| A | 4134 | 159 | 3.846154% |
| B | 4134 | 4 | 0.096759% |
| C | 4134 | 2 | 0.048379% |
| D | 4134 | 223 | 5.394291% |
Noise dominated data is calculated using 1-second bins in cleaned event files. If a bin has >2000 counts, and if more than 50% of those come from <1% of pixels, then it is considered to be noise-dominated and hence unusable.
| Quadrant | # 1 sec bins | Bins with >0 counts | Bins with >2000 counts | High rate bins dominated by noise | Noise dominated (total time) | Noise dominated (detector-on time) | Marked lightcurve |
|---|---|---|---|---|---|---|---|
| A | 6291 | 4135 | 230 | 230 | 3.66% | 5.56% | 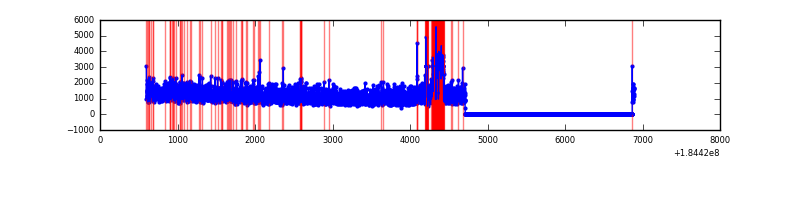 |
| B | 6291 | 4135 | 46 | 46 | 0.73% | 1.11% | 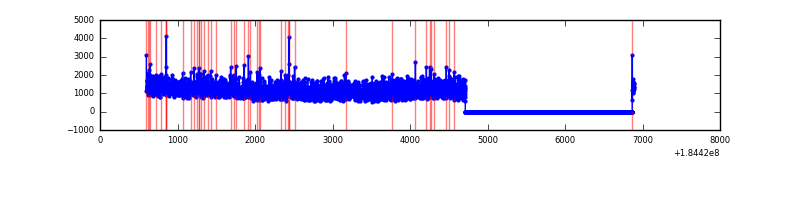 |
| C | 6291 | 4135 | 27 | 27 | 0.43% | 0.65% | 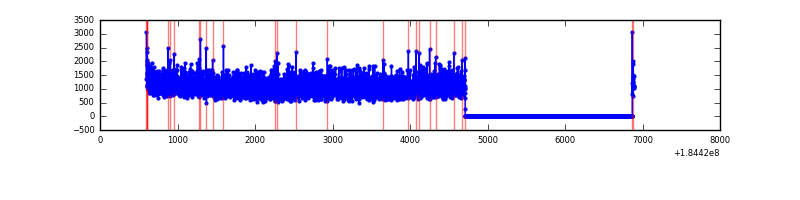 |
| D | 6291 | 4135 | 836 | 836 | 13.29% | 20.22% | 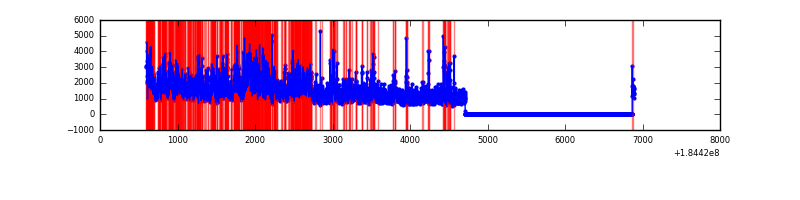 |
Top three noisy pixels from each quadrant. If the there are fewer than three noisy pixels in the level2.evt file, extra rows are filled as -1
| Pixel properties | Quadrant properties | ||||||
|---|---|---|---|---|---|---|---|
| Quadrant | DetID | PixID | Counts | Sigma | Mean | Median | Sigma |
| A | 0 | 149 | 428246 | 1619.67 | 1187 | 1177 | 263.7 |
| A | 0 | 238 | 55618 | 206.47 | 1187 | 1177 | 263.7 |
| A | 0 | 5 | 11130 | 37.75 | 1187 | 1177 | 263.7 |
| B | 4 | 250 | 79179 | 274.44 | 1202 | 1209 | 284.1 |
| B | 8 | 4 | 23039 | 76.84 | 1202 | 1209 | 284.1 |
| B | 4 | 206 | 18058 | 59.3 | 1202 | 1209 | 284.1 |
| C | 5 | 249 | 57649 | 182.21 | 1104 | 1147 | 310.1 |
| C | 15 | 241 | 10710 | 30.84 | 1104 | 1147 | 310.1 |
| C | 7 | 159 | 4309 | 10.2 | 1104 | 1147 | 310.1 |
| D | 12 | 237 | 786514 | 2347.89 | 1064 | 1104 | 334.5 |
| D | 13 | 216 | 738770 | 2205.16 | 1064 | 1104 | 334.5 |
| D | 1 | 4 | 263504 | 784.41 | 1064 | 1104 | 334.5 |
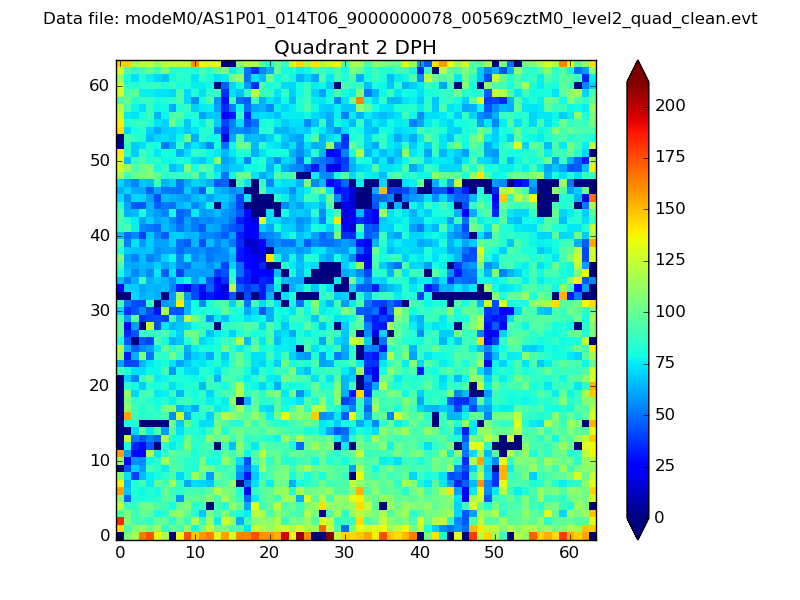
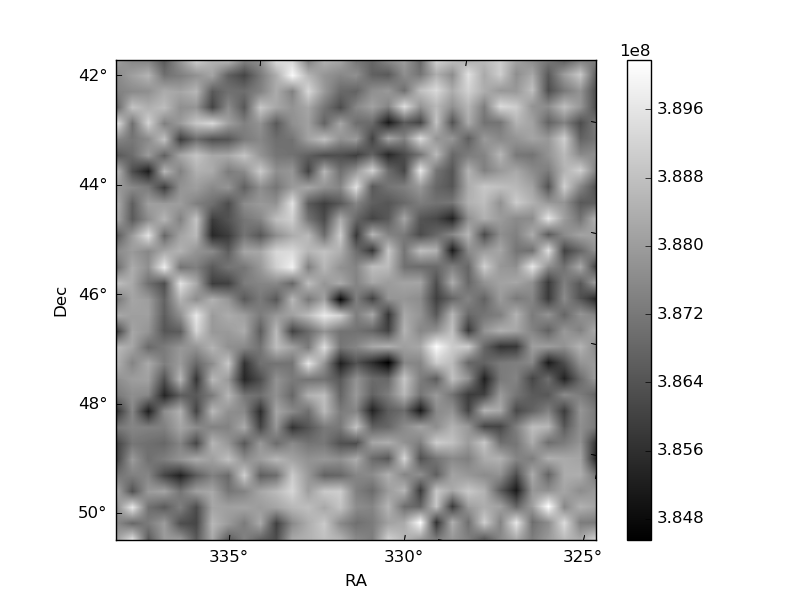
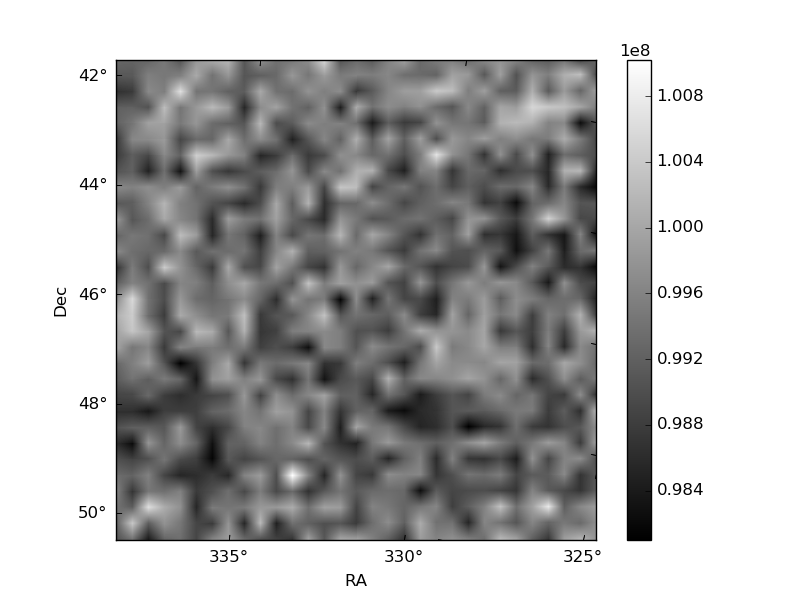
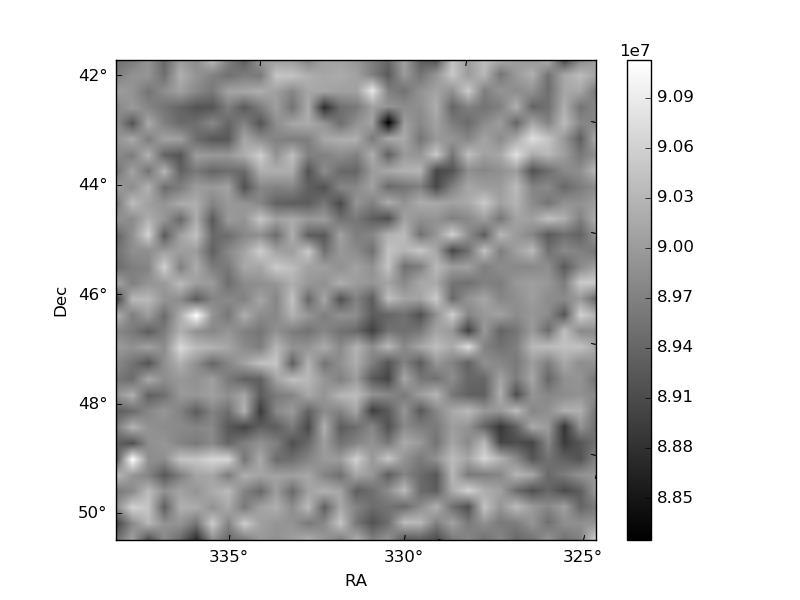
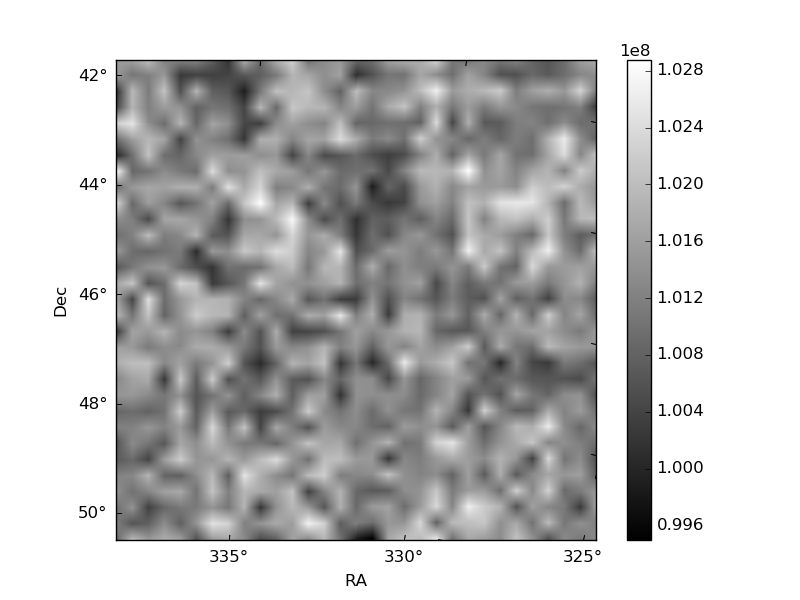
Histogram calculated using DETX and DETY for each event in the final _common_clean file
| Quadrant A | 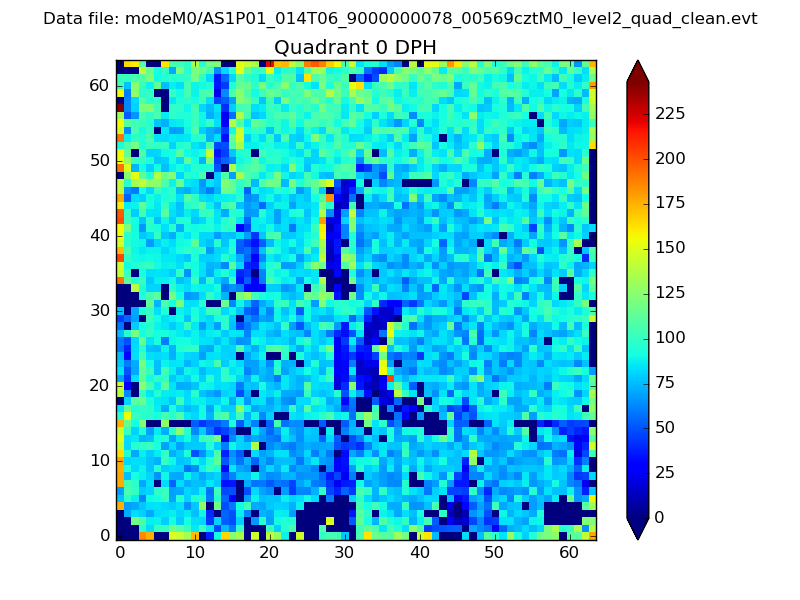 |
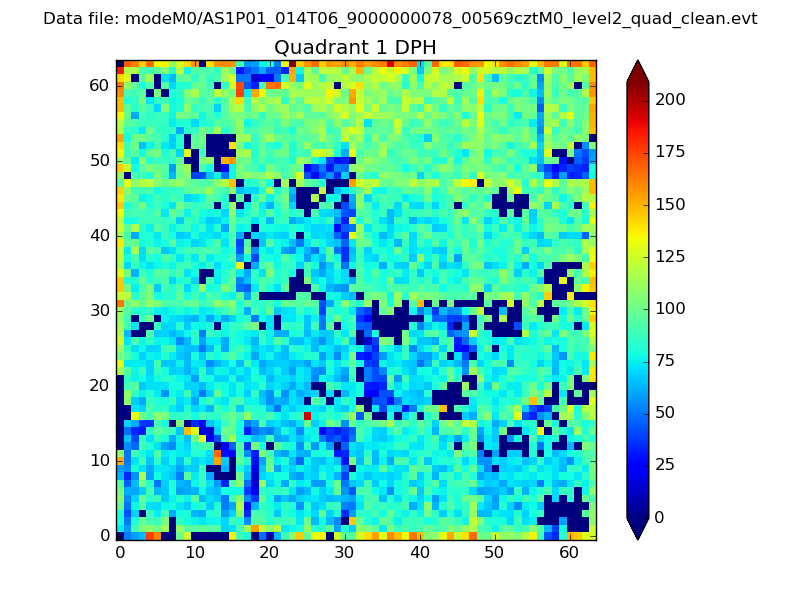 |
Quadrant B |
|---|---|---|---|
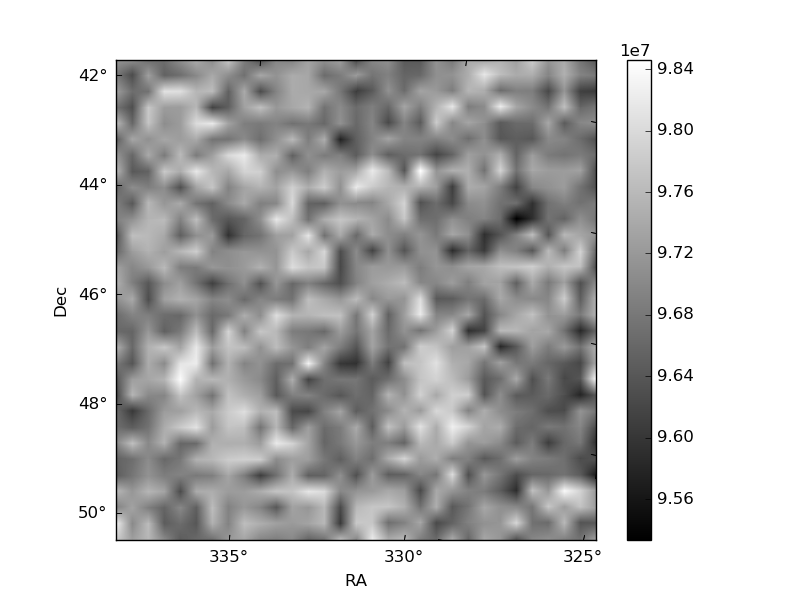
| Quadrant D | 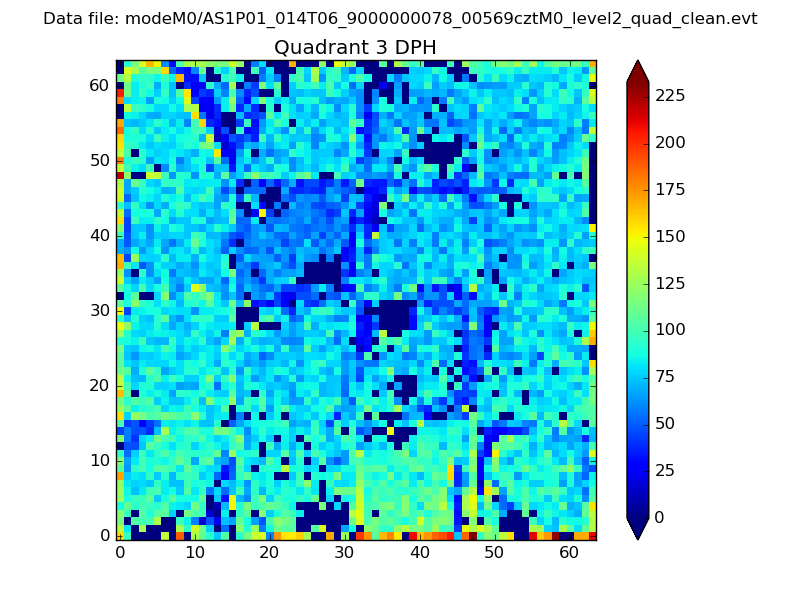 |
 |
Quadrant C |
| Plot type | Count rate plots | Images |
|---|---|---|
| Comparison with Poisson distribution Blue bars denote a histogram of data divided into 1 sec bins. Red curve is a Poisson curve with rate = median count rate of data. |
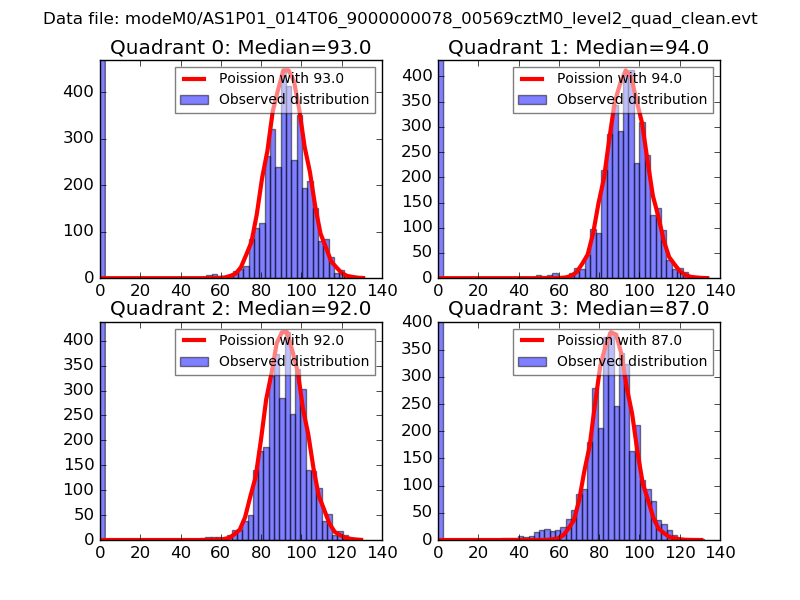 |
 |
| Quadrant-wise count rates Data is divided into 100 sec bins |
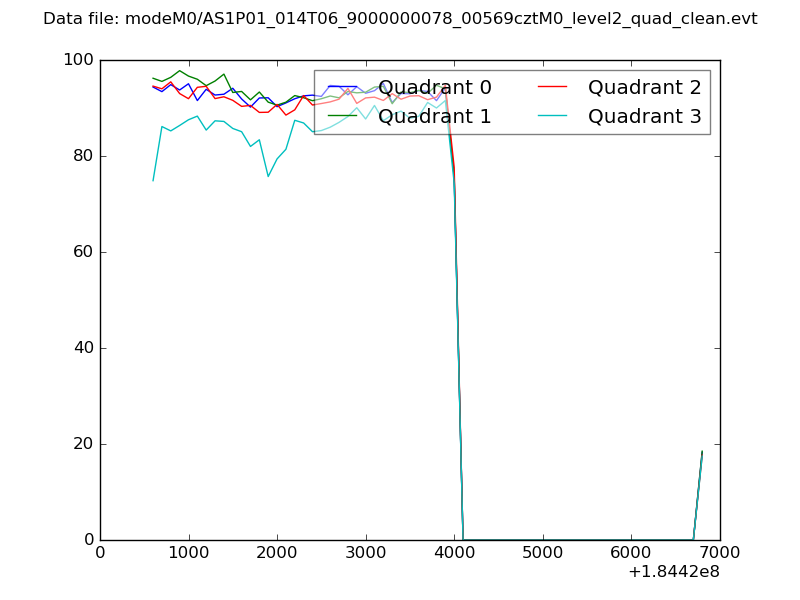 |
|
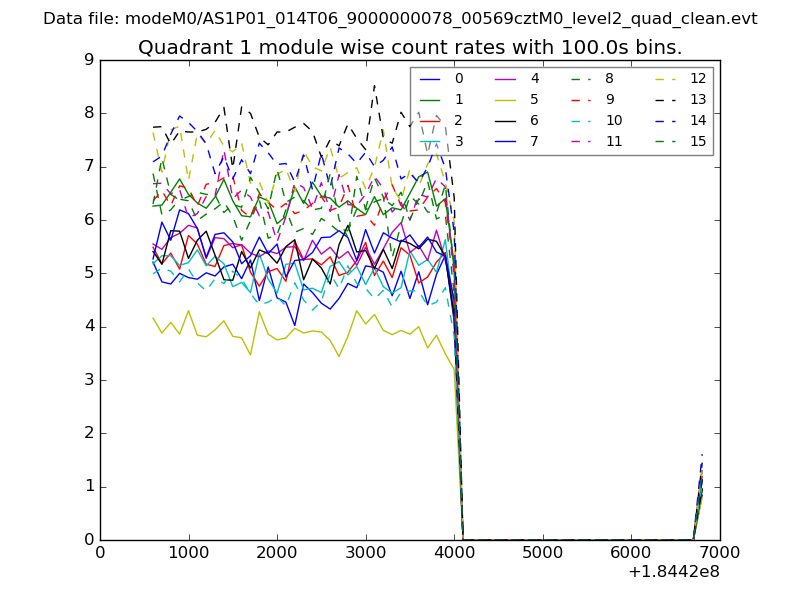
| Module-wise count rates for Quadrant A Data is divided into 100 sec bins |
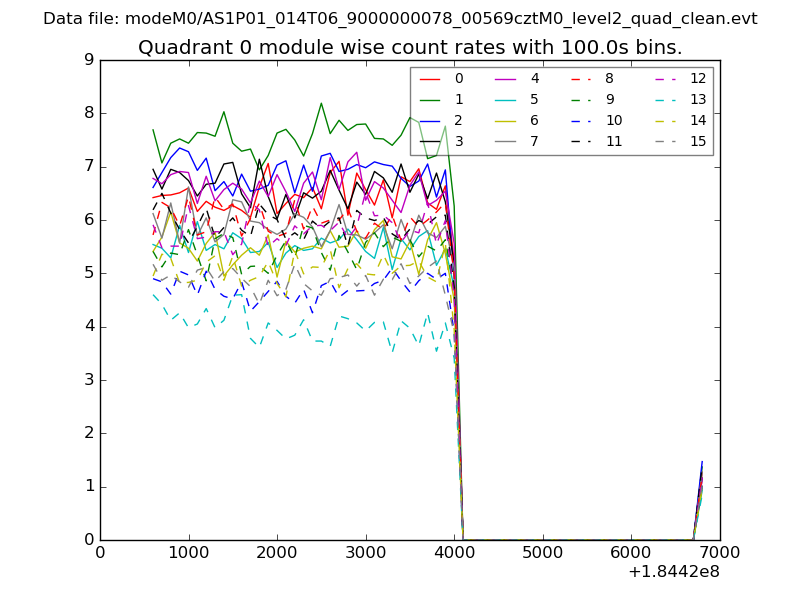 |
 |
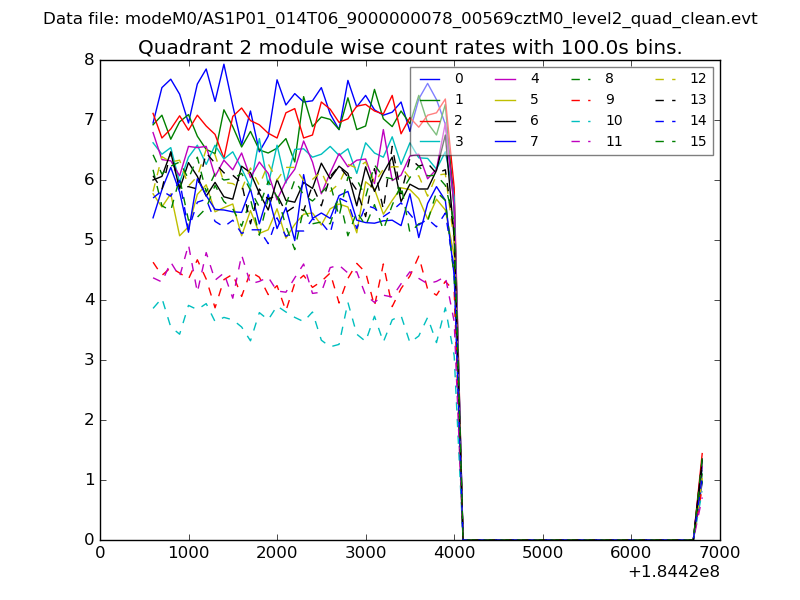
| Module-wise count rates for Quadrant B Data is divided into 100 sec bins |
 |
 |
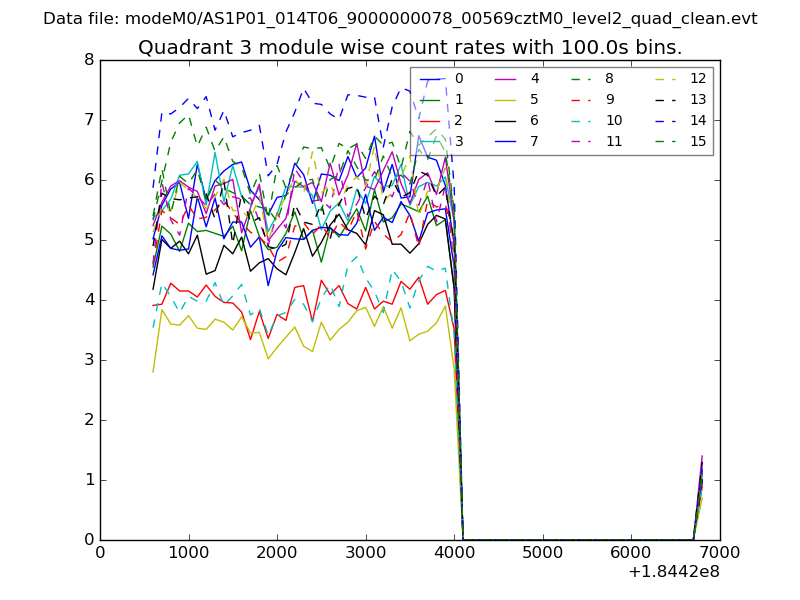
| Module-wise count rates for Quadrant C Data is divided into 100 sec bins |
 |
 |
| Module-wise count rates for Quadrant D Data is divided into 100 sec bins |
 |
 |
| Parameter | Plot |
|---|---|
| CZT HV Monitor | 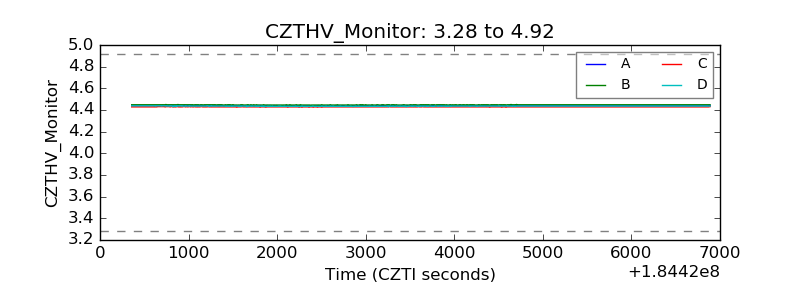 |
| D_VDD | 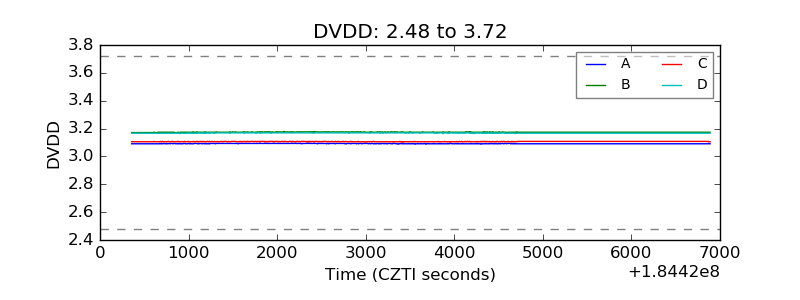 |
| Temperature 1 | 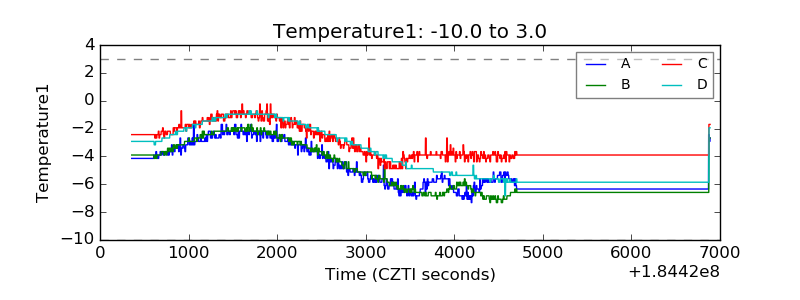 |
| Veto HV Monitor | 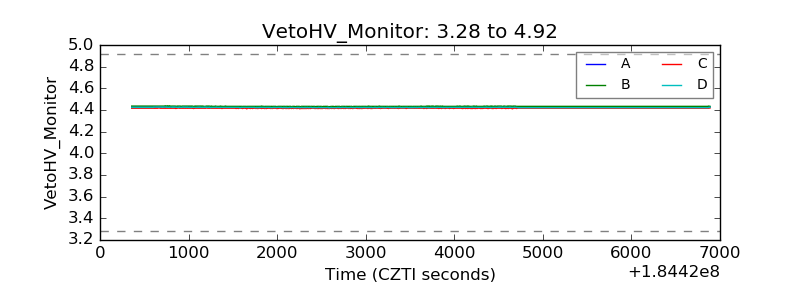 |
| Veto LLD | 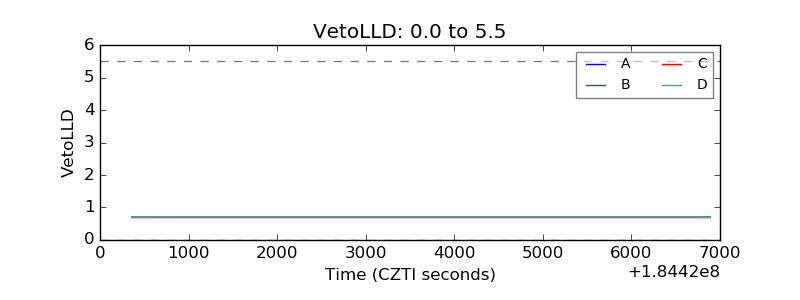 |
| Alpha Counter | 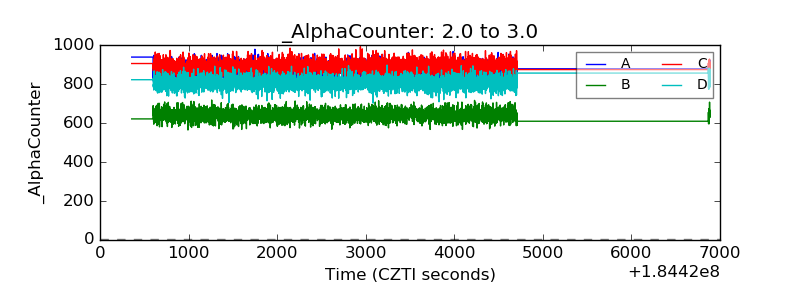 |
| _CPM_Rate | 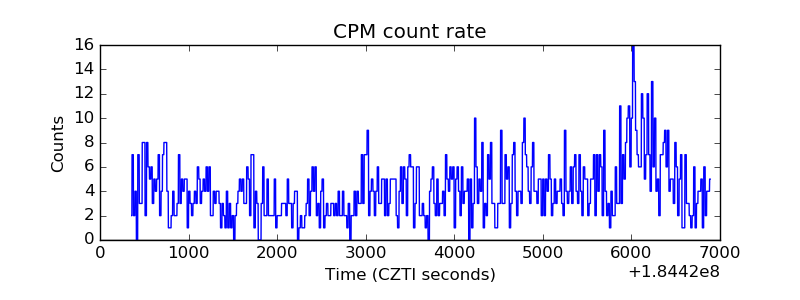 |
| CZT Counter | 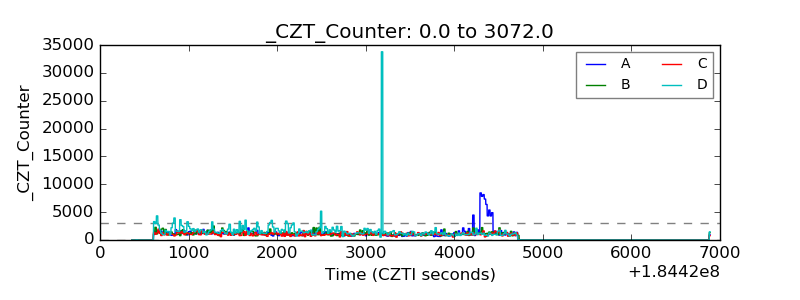 |
| +2.5 Volts monitor |  |
| +5 Volts monitor | 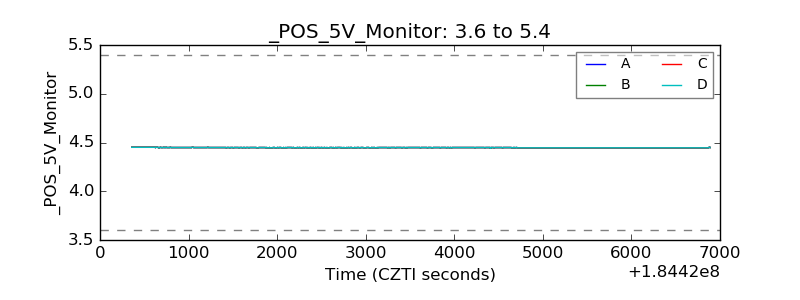 |
| _ROLL_ROT | 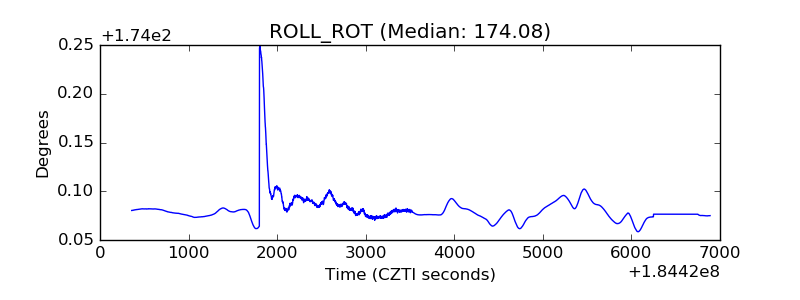 |
| _Roll_DEC | 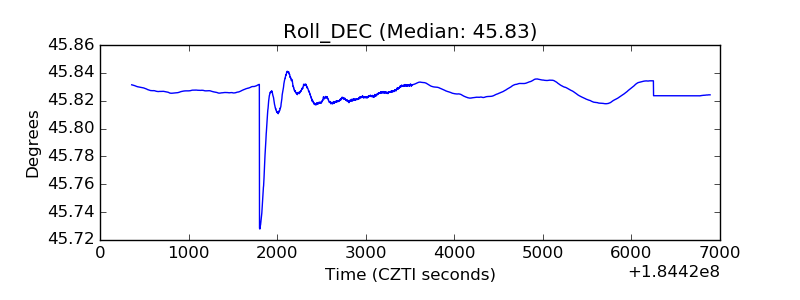 |
| _Roll_RA | 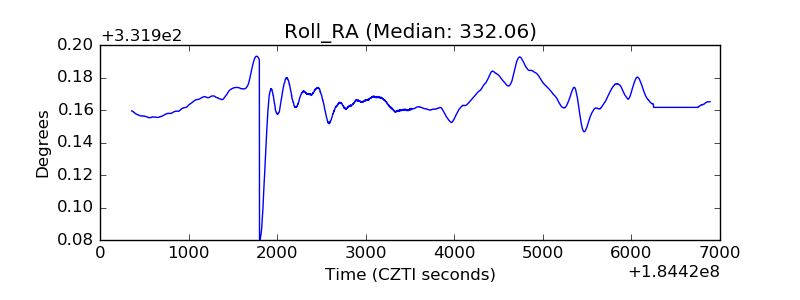 |
| Veto Counter | 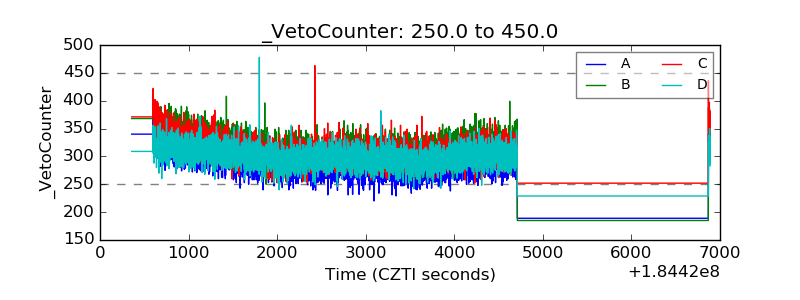 |