| Param | Original file | Final file |
|---|---|---|
| Filename | modeM0/AS1P01_118T02_9000000082cztM0_level2.fits | modeM0/AS1P01_118T02_9000000082cztM0_level2_quad_clean.evt |
| Size (bytes) | 430,920,000 | 475,162,560 |
| Size | 411.0 MB | 453.2 MB |
| Events in quadrant A | 2,439,722 | 2,780,001 |
| Events in quadrant B | 2,451,970 | 2,818,463 |
| Events in quadrant C | 2,419,322 | 2,694,147 |
| Events in quadrant D | 2,056,014 | 2,415,112 |
| Mode M0 | |||
|---|---|---|---|
| Quadrant | BADHDUFLAG | Total packets | Discarded packets |
| A | 0 | 230280 | 0 |
| B | 0 | 232201 | 0 |
| C | 0 | 212771 | 0 |
| D | 0 | 234105 | 0 |
| Mode SS | |||
|---|---|---|---|
| Quadrant | BADHDUFLAG | Total packets | Discarded packets |
| A | 0 | 1098 | 0 |
| B | 0 | 1098 | 0 |
| C | 0 | 1098 | 0 |
| D | 0 | 1098 | 0 |
| Mode M9 | |||
|---|---|---|---|
| Quadrant | BADHDUFLAG | Total packets | Discarded packets |
| A | 0 | 276 | 0 |
| B | 0 | 276 | 0 |
| C | 0 | 276 | 0 |
| D | 0 | 276 | 0 |
| Quadrant | Total seconds | Saturated seconds | Saturation percentage |
|---|---|---|---|
| A | 53672 | 477 | 0.888732% |
| B | 53679 | 223 | 0.415432% |
| C | 53670 | 187 | 0.348426% |
| D | 53674 | 1181 | 2.200320% |
Noise dominated data is calculated using 1-second bins in cleaned event files. If a bin has >2000 counts, and if more than 50% of those come from <1% of pixels, then it is considered to be noise-dominated and hence unusable.
| Quadrant | # 1 sec bins | Bins with >0 counts | Bins with >2000 counts | High rate bins dominated by noise | Noise dominated (total time) | Noise dominated (detector-on time) | Marked lightcurve |
|---|---|---|---|---|---|---|---|
| A | 79384 | 53683 | 0 | 0 | 0.00% | 0.00% |  |
| B | 79384 | 53684 | 0 | 0 | 0.00% | 0.00% |  |
| C | 79384 | 53683 | 0 | 0 | 0.00% | 0.00% |  |
| D | 79384 | 53647 | 0 | 0 | 0.00% | 0.00% |  |
Top three noisy pixels from each quadrant. If the there are fewer than three noisy pixels in the level2.evt file, extra rows are filled as -1
| Pixel properties | Quadrant properties | ||||||
|---|---|---|---|---|---|---|---|
| Quadrant | DetID | PixID | Counts | Sigma | Mean | Median | Sigma |
| A | 7 | 110 | 2470 | 12.8 | 633 | 592 | 146.7 |
| A | 0 | 29 | 2327 | 11.83 | 633 | 592 | 146.7 |
| A | 0 | 30 | 1781 | 8.11 | 633 | 592 | 146.7 |
| B | 2 | 9 | 1968 | 11.86 | 646 | 616 | 114.0 |
| B | 14 | 254 | 1590 | 8.55 | 646 | 616 | 114.0 |
| B | 2 | 8 | 1541 | 8.12 | 646 | 616 | 114.0 |
| C | 2 | 191 | 1672 | 6.87 | 639 | 591 | 157.4 |
| C | 12 | 241 | 1607 | 6.45 | 639 | 591 | 157.4 |
| C | 3 | 187 | 1554 | 6.12 | 639 | 591 | 157.4 |
| D | 6 | 44 | 1542 | 7.12 | 585 | 536 | 141.3 |
| D | 6 | 231 | 1538 | 7.09 | 585 | 536 | 141.3 |
| D | 15 | 30 | 1479 | 6.67 | 585 | 536 | 141.3 |
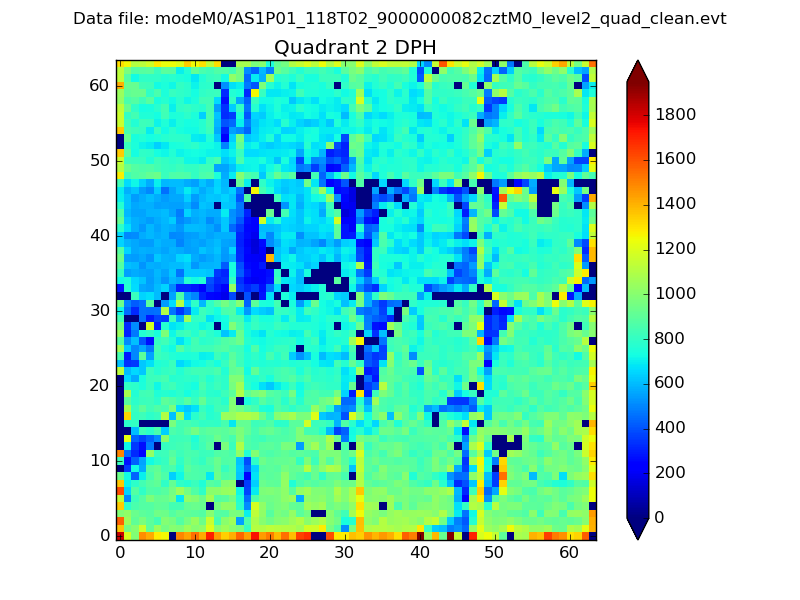
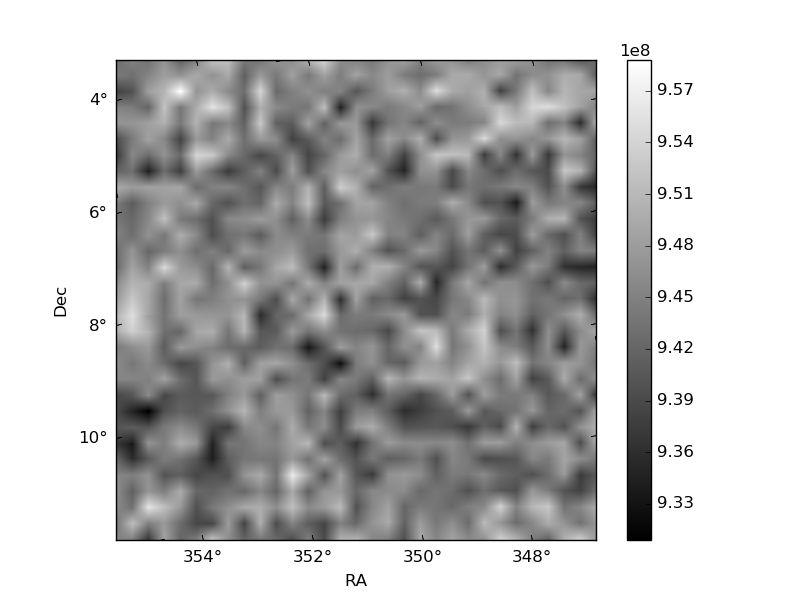
Histogram calculated using DETX and DETY for each event in the final _common_clean file
| Quadrant A | 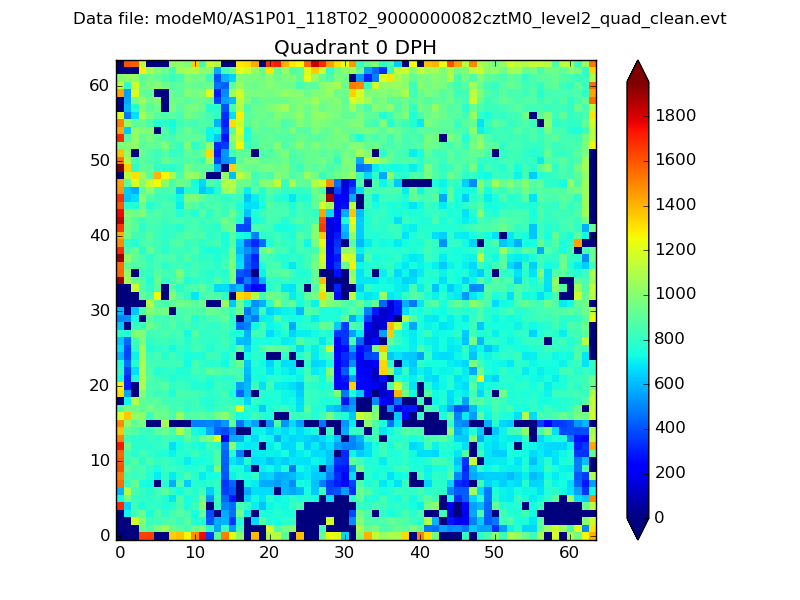 |
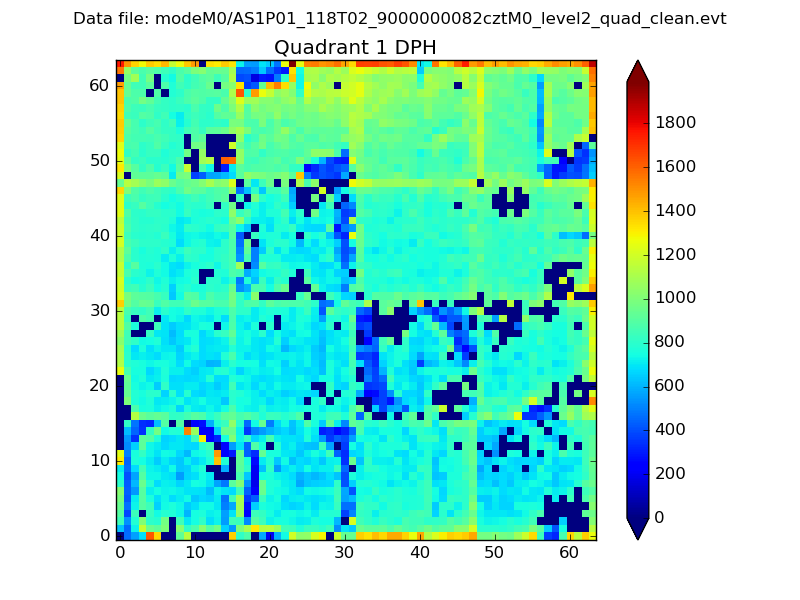 |
Quadrant B |
|---|---|---|---|
| Quadrant D | 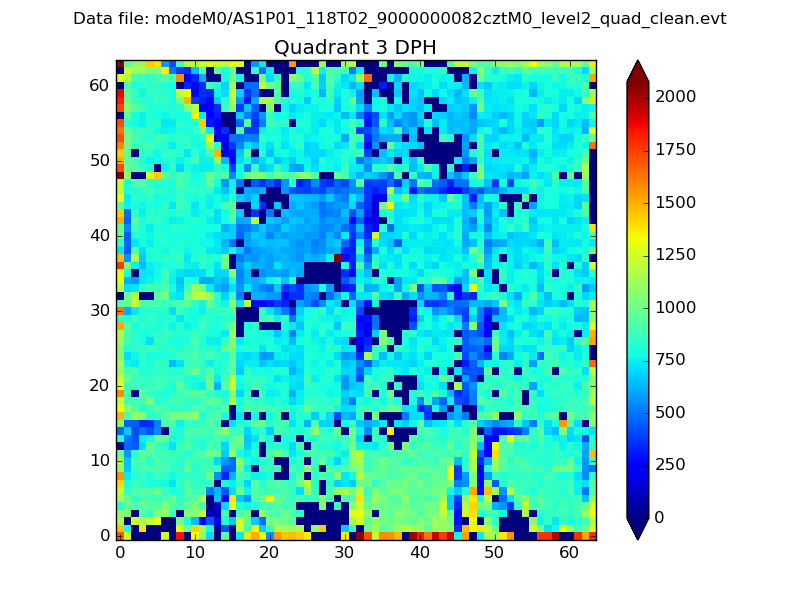 |
 |
Quadrant C |
| Plot type | Count rate plots | Images |
|---|---|---|
| Comparison with Poisson distribution Blue bars denote a histogram of data divided into 1 sec bins. Red curve is a Poisson curve with rate = median count rate of data. |
 |
 |
| Quadrant-wise count rates Data is divided into 100 sec bins |
 |
|
| Module-wise count rates for Quadrant A Data is divided into 100 sec bins |
 |
 |
| Module-wise count rates for Quadrant B Data is divided into 100 sec bins |
 |
 |
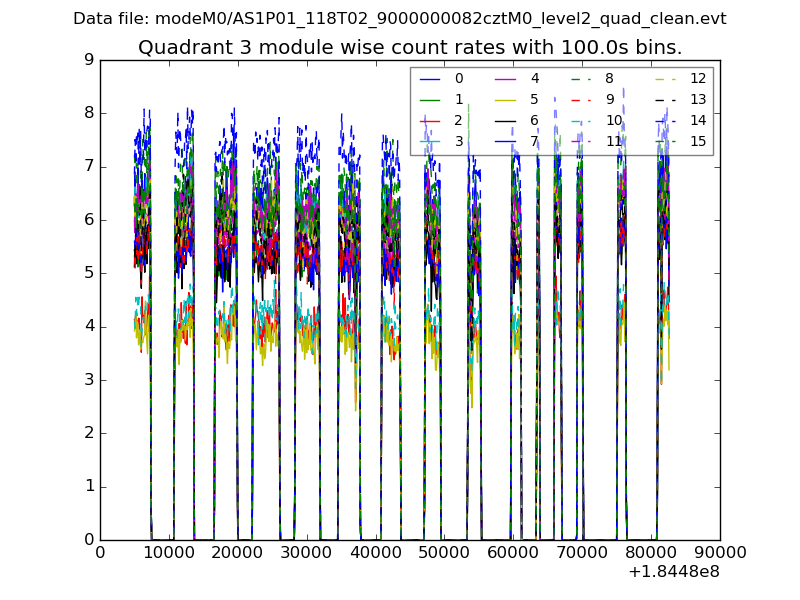
| Module-wise count rates for Quadrant C Data is divided into 100 sec bins |
 |
 |
| Module-wise count rates for Quadrant D Data is divided into 100 sec bins |
 |
 |
| Parameter | Plot |
|---|---|
| CZT HV Monitor | 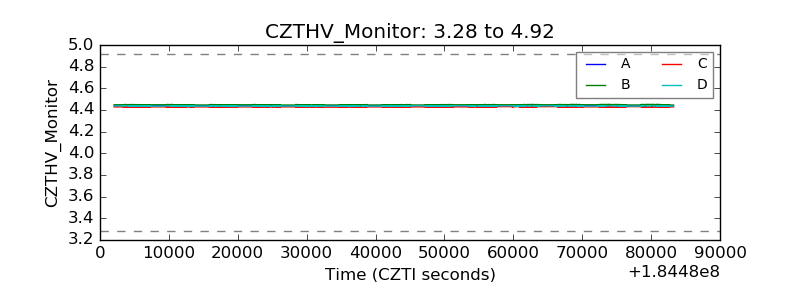 |
| D_VDD |  |
| Temperature 1 |  |
| Veto HV Monitor |  |
| Veto LLD |  |
| Alpha Counter |  |
| _CPM_Rate |  |
| CZT Counter | 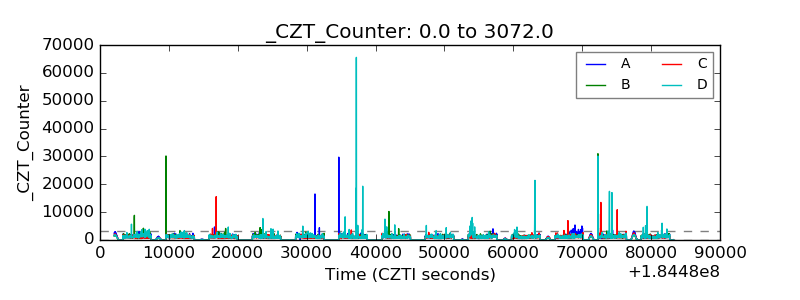 |
| +2.5 Volts monitor |  |
| +5 Volts monitor | 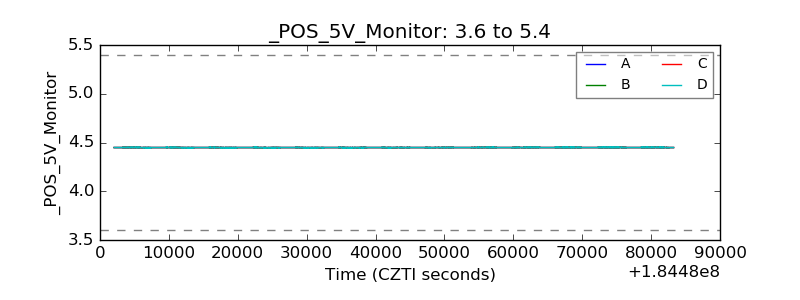 |
| _ROLL_ROT |  |
| _Roll_DEC | 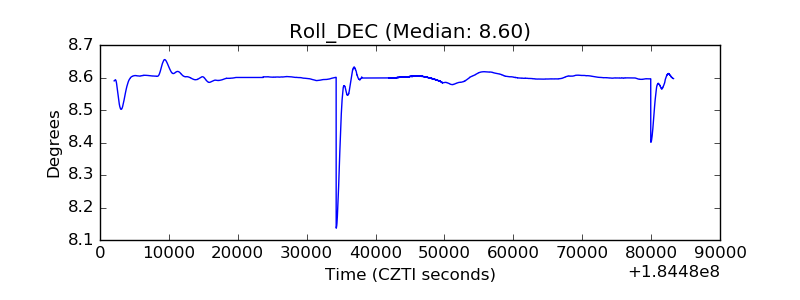 |
| _Roll_RA |  |
| Veto Counter |  |