| Param | Original file | Final file |
|---|---|---|
| Filename | modeM0/AS1P01_118T02_9000000082_00580cztM0_level2.evt | modeM0/AS1P01_118T02_9000000082_00580cztM0_level2_quad_clean.evt |
| Size (bytes) | 865,903,680 | 43,272,000 |
| Size | 825.8 MB | 41.3 MB |
| Events in quadrant A | 6,305,226 | 241,622 |
| Events in quadrant B | 6,564,792 | 243,434 |
| Events in quadrant C | 5,827,819 | 242,433 |
| Events in quadrant D | 7,189,332 | 226,178 |
| Mode M0 | |||
|---|---|---|---|
| Quadrant | BADHDUFLAG | Total packets | Discarded packets |
| A | 0 | 22337 | 3 |
| B | 0 | 23083 | 2 |
| C | 0 | 20936 | 2 |
| D | 0 | 24963 | 2 |
| Mode SS | |||
|---|---|---|---|
| Quadrant | BADHDUFLAG | Total packets | Discarded packets |
| A | 0 | 102 | 0 |
| B | 0 | 102 | 0 |
| C | 0 | 102 | 0 |
| D | 0 | 102 | 0 |
| Mode M9 | |||
|---|---|---|---|
| Quadrant | BADHDUFLAG | Total packets | Discarded packets |
| A | 0 | 35 | 0 |
| B | 0 | 35 | 0 |
| C | 0 | 35 | 0 |
| D | 0 | 35 | 0 |
| Quadrant | Total seconds | Saturated seconds | Saturation percentage |
|---|---|---|---|
| A | 5084 | 4 | 0.078678% |
| B | 5084 | 54 | 1.062156% |
| C | 5084 | 8 | 0.157356% |
| D | 5084 | 128 | 2.517703% |
Noise dominated data is calculated using 1-second bins in cleaned event files. If a bin has >2000 counts, and if more than 50% of those come from <1% of pixels, then it is considered to be noise-dominated and hence unusable.
| Quadrant | # 1 sec bins | Bins with >0 counts | Bins with >2000 counts | High rate bins dominated by noise | Noise dominated (total time) | Noise dominated (detector-on time) | Marked lightcurve |
|---|---|---|---|---|---|---|---|
| A | 7239 | 5085 | 121 | 121 | 1.67% | 2.38% | 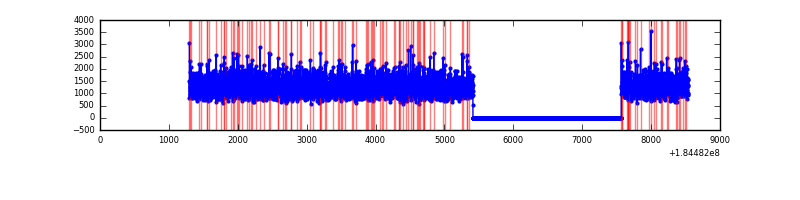 |
| B | 7239 | 5085 | 183 | 183 | 2.53% | 3.60% | 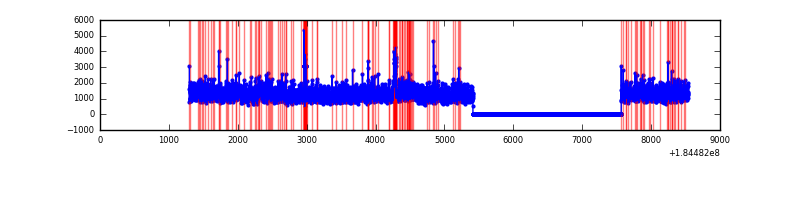 |
| C | 7239 | 5085 | 85 | 85 | 1.17% | 1.67% | 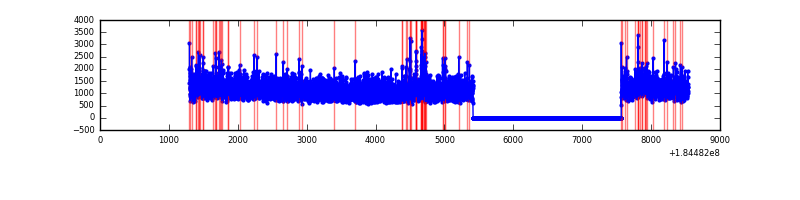 |
| D | 7239 | 5085 | 559 | 559 | 7.72% | 10.99% | 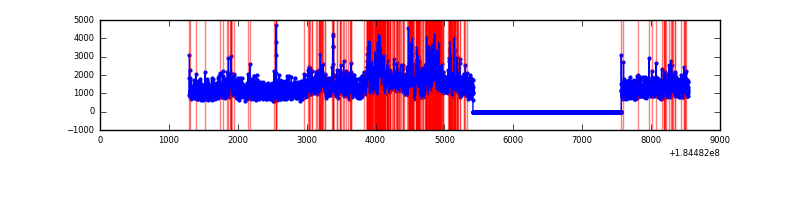 |
Top three noisy pixels from each quadrant. If the there are fewer than three noisy pixels in the level2.evt file, extra rows are filled as -1
| Pixel properties | Quadrant properties | ||||||
|---|---|---|---|---|---|---|---|
| Quadrant | DetID | PixID | Counts | Sigma | Mean | Median | Sigma |
| A | 0 | 238 | 29759 | 78.65 | 1617 | 1603 | 358.0 |
| A | 15 | 171 | 15292 | 38.24 | 1617 | 1603 | 358.0 |
| A | 0 | 149 | 9007 | 20.68 | 1617 | 1603 | 358.0 |
| B | 7 | 221 | 272098 | 720.75 | 1588 | 1603 | 375.3 |
| B | 4 | 206 | 71282 | 185.66 | 1588 | 1603 | 375.3 |
| B | 5 | 249 | 63192 | 164.11 | 1588 | 1603 | 375.3 |
| C | 1 | 1 | 100643 | 248.13 | 1433 | 1485 | 399.6 |
| C | 9 | 241 | 45018 | 108.94 | 1433 | 1485 | 399.6 |
| C | 15 | 241 | 38011 | 91.4 | 1433 | 1485 | 399.6 |
| D | 1 | 4 | 728683 | 1645.82 | 1398 | 1457 | 441.9 |
| D | 12 | 237 | 567965 | 1282.09 | 1398 | 1457 | 441.9 |
| D | 13 | 216 | 226581 | 509.49 | 1398 | 1457 | 441.9 |
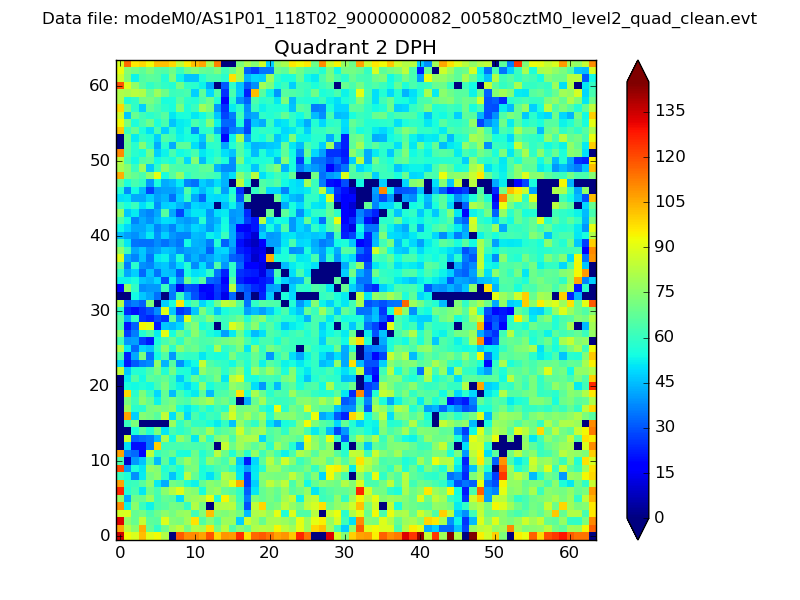
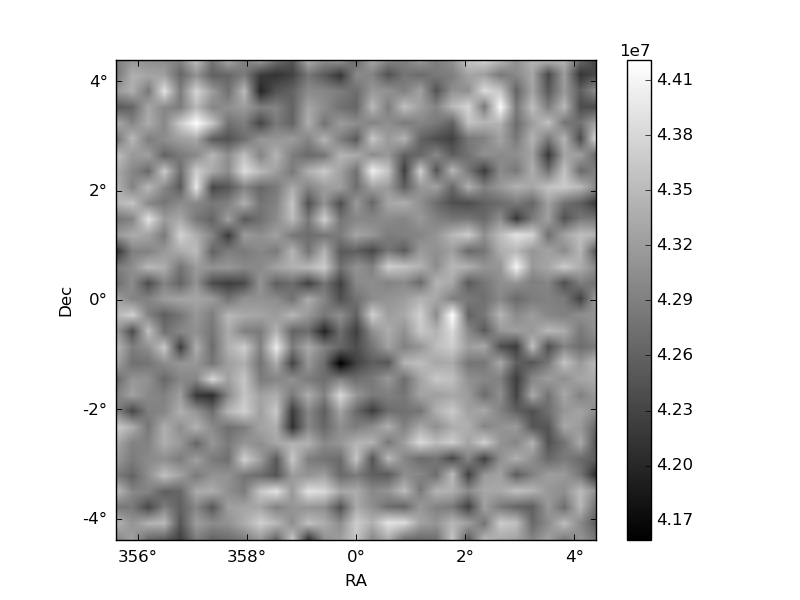
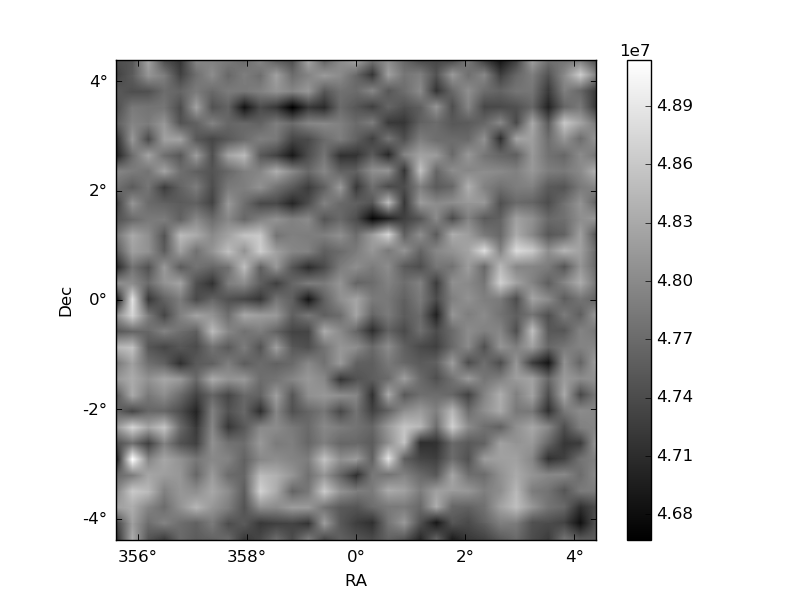
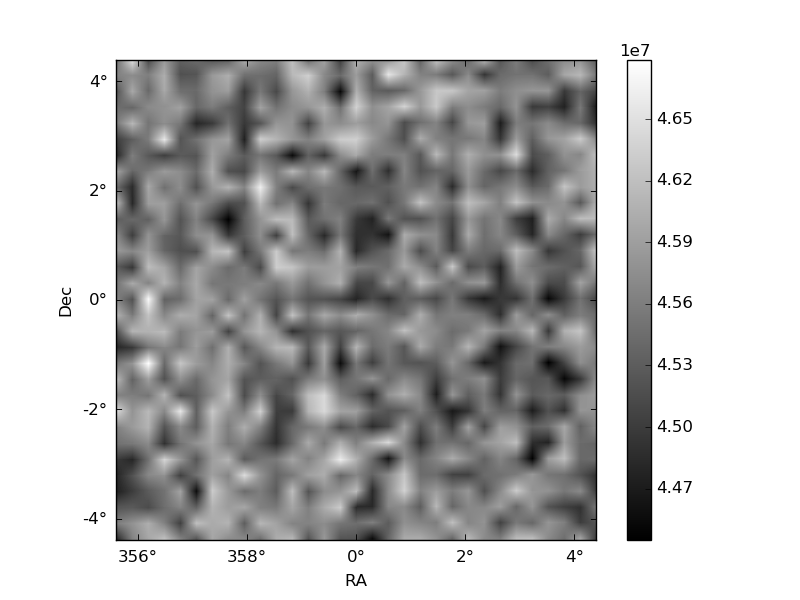
Histogram calculated using DETX and DETY for each event in the final _common_clean file
| Quadrant A | 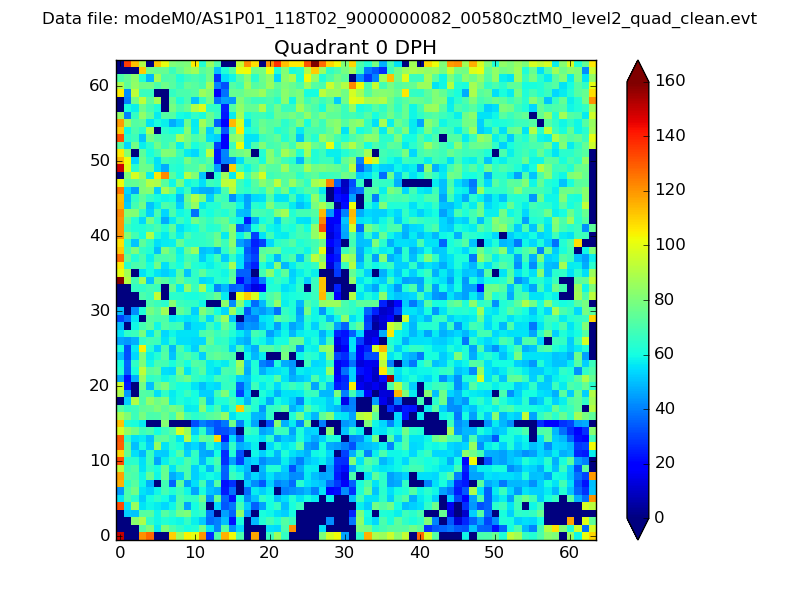 |
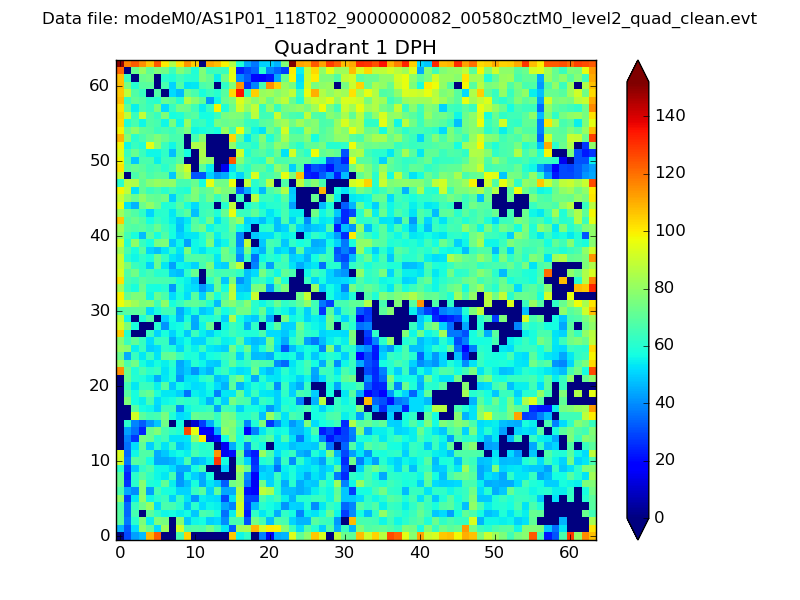 |
Quadrant B |
|---|---|---|---|
| Quadrant D | 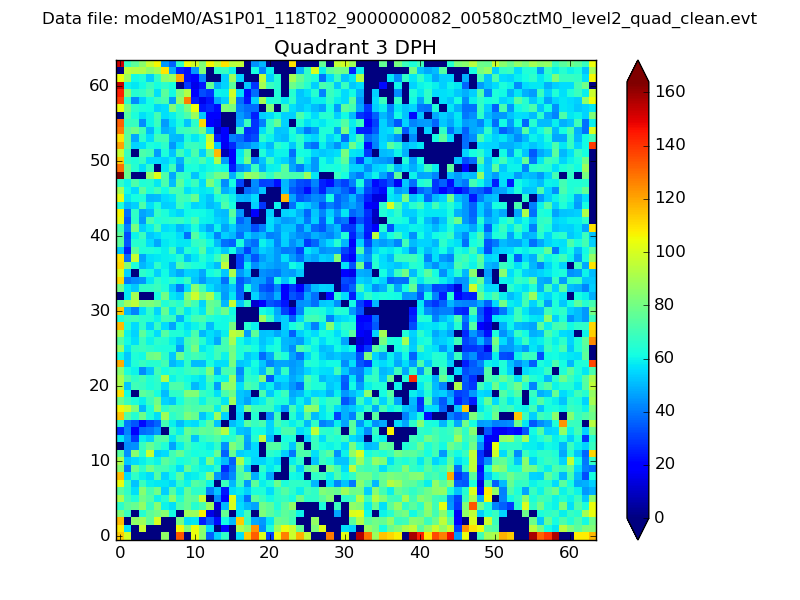 |
 |
Quadrant C |
| Plot type | Count rate plots | Images |
|---|---|---|
| Comparison with Poisson distribution Blue bars denote a histogram of data divided into 1 sec bins. Red curve is a Poisson curve with rate = median count rate of data. |
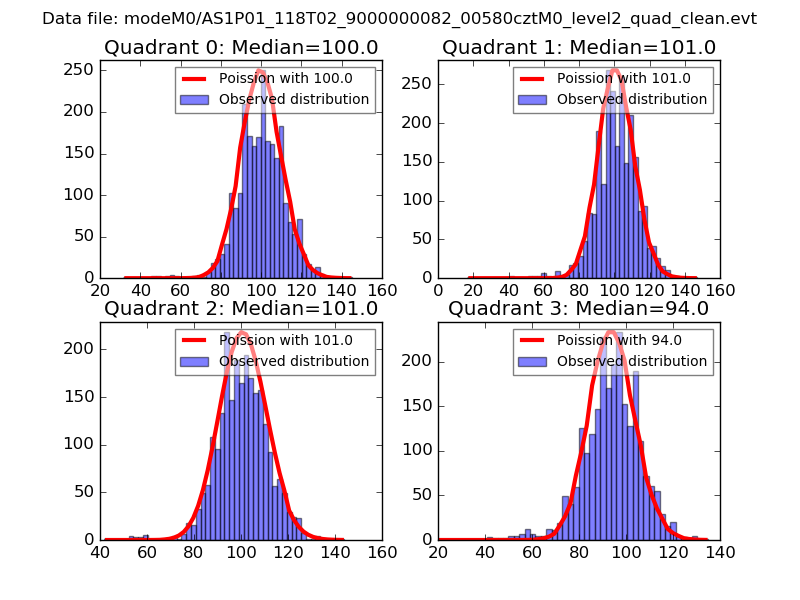 |
 |
| Quadrant-wise count rates Data is divided into 100 sec bins |
 |
|
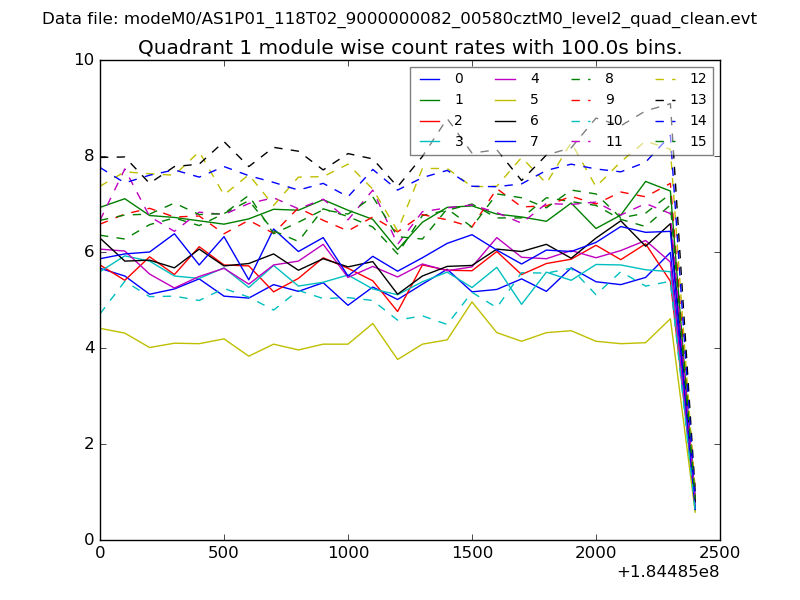
| Module-wise count rates for Quadrant A Data is divided into 100 sec bins |
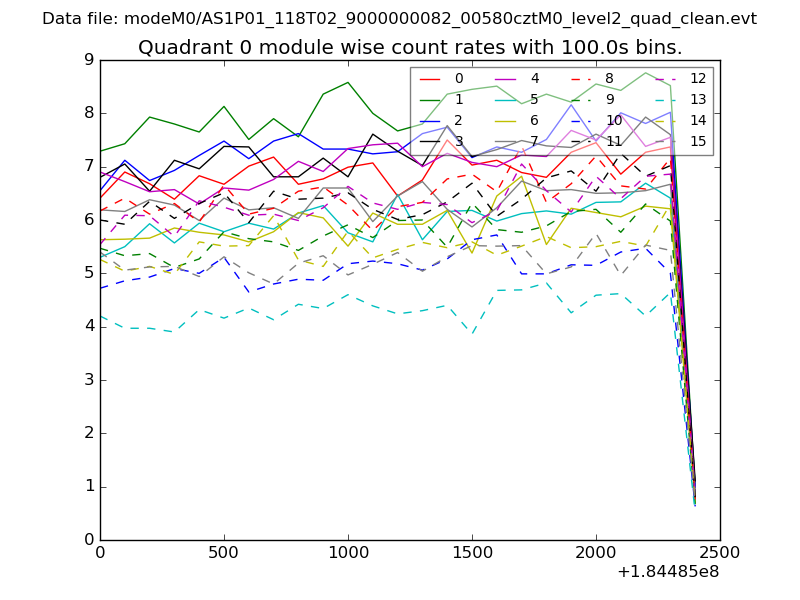 |
 |
| Module-wise count rates for Quadrant B Data is divided into 100 sec bins |
 |
 |
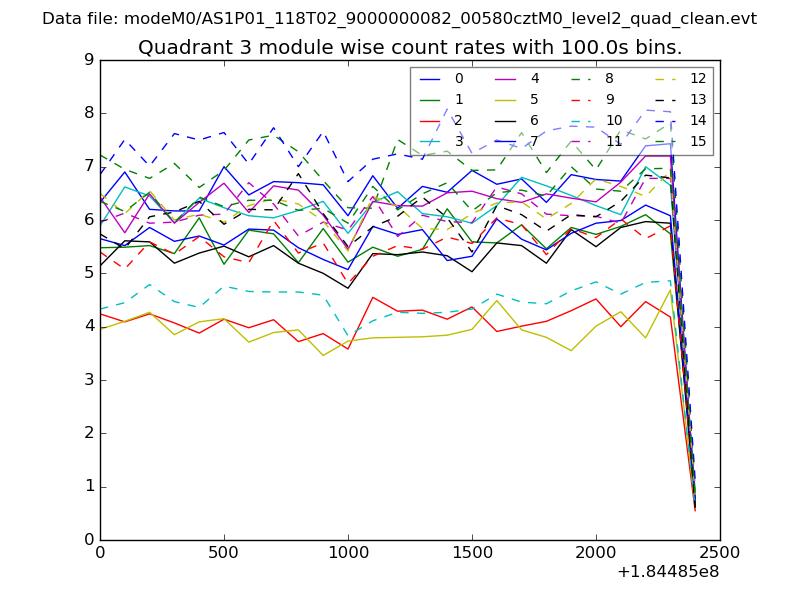
| Module-wise count rates for Quadrant C Data is divided into 100 sec bins |
 |
 |
| Module-wise count rates for Quadrant D Data is divided into 100 sec bins |
 |
 |
| Parameter | Plot |
|---|---|
| CZT HV Monitor | 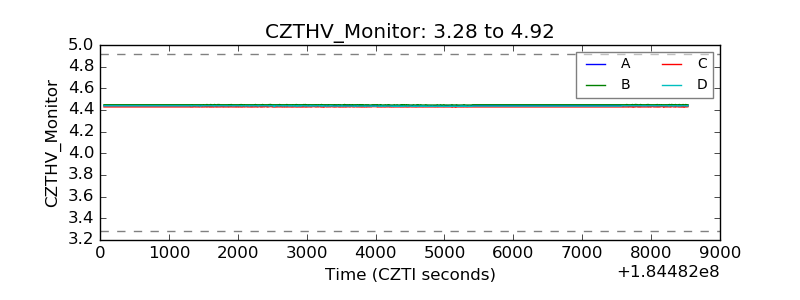 |
| D_VDD | 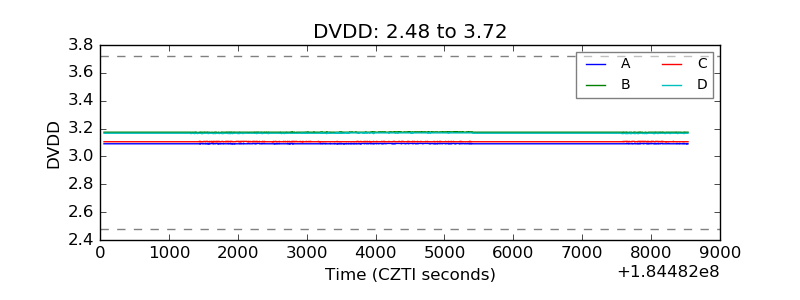 |
| Temperature 1 | 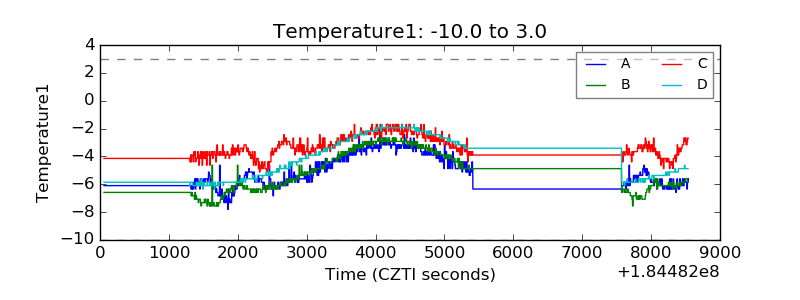 |
| Veto HV Monitor | 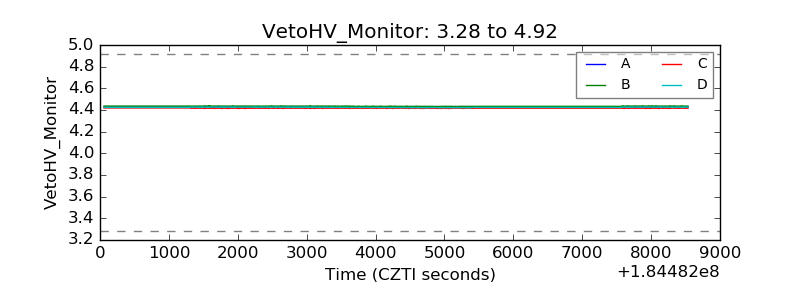 |
| Veto LLD | 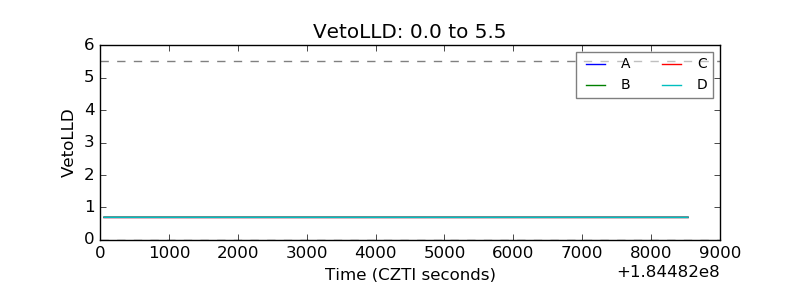 |
| Alpha Counter | 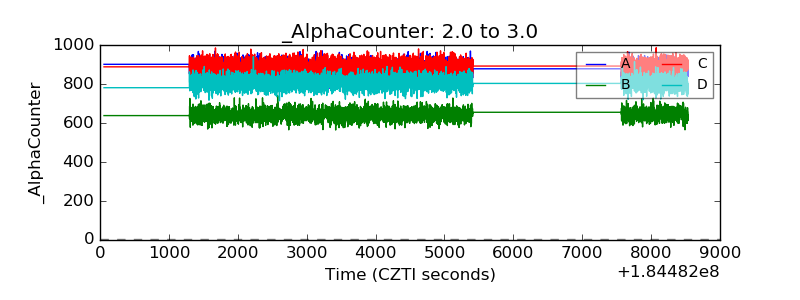 |
| _CPM_Rate | 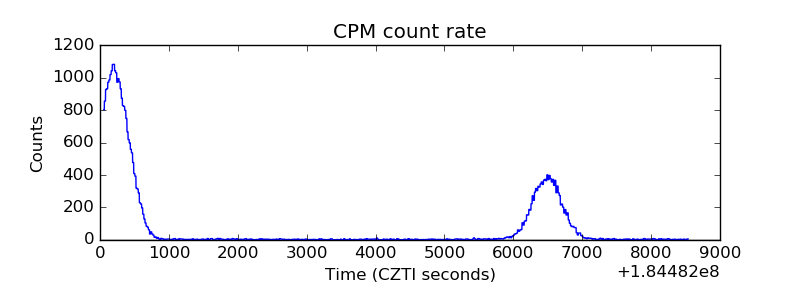 |
| CZT Counter | 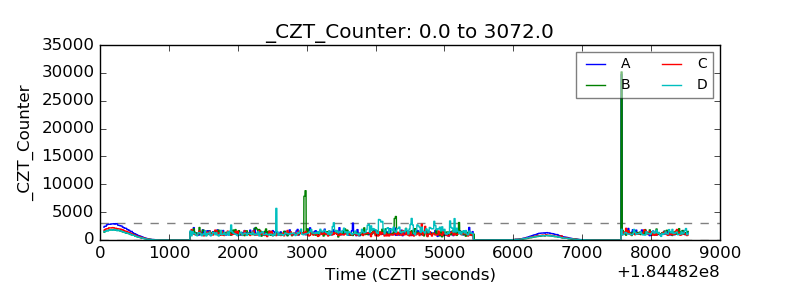 |
| +2.5 Volts monitor |  |
| +5 Volts monitor |  |
| _ROLL_ROT | 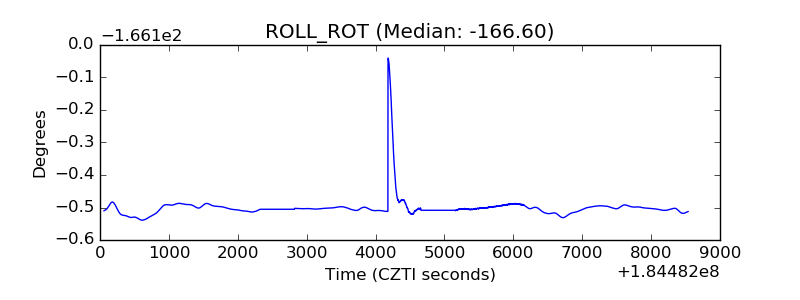 |
| _Roll_DEC | 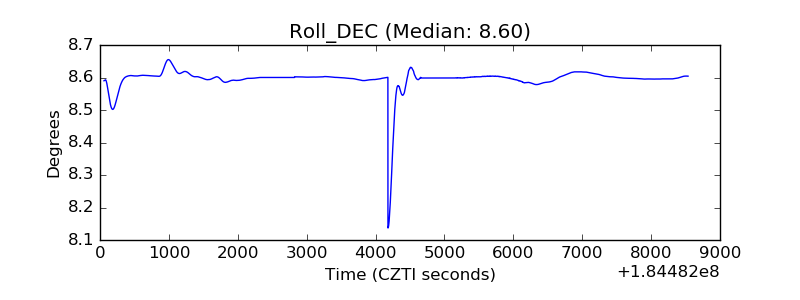 |
| _Roll_RA | 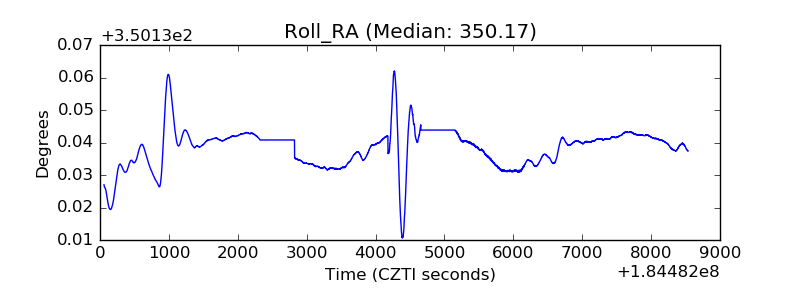 |
| Veto Counter | 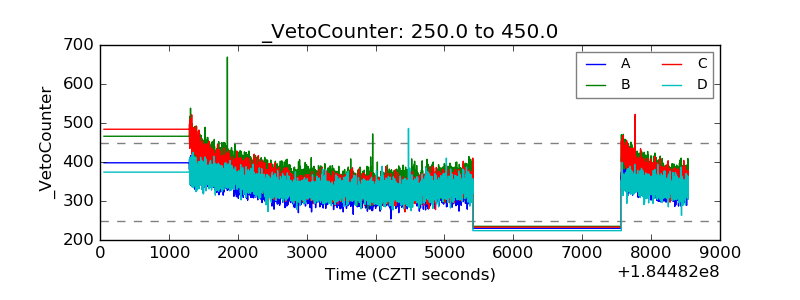 |