| Param | Original file | Final file |
|---|---|---|
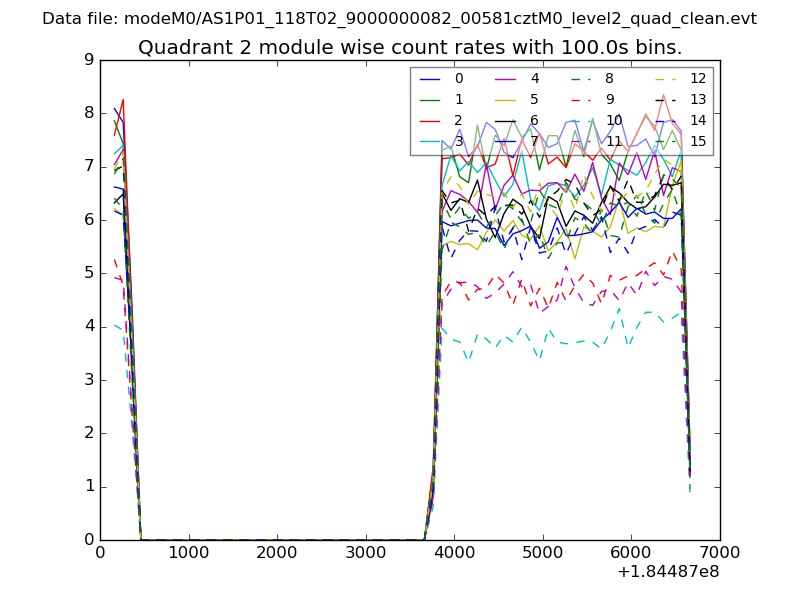
| Filename | modeM0/AS1P01_118T02_9000000082_00581cztM0_level2.evt | modeM0/AS1P01_118T02_9000000082_00581cztM0_level2_quad_clean.evt |
| Size (bytes) | 851,927,040 | 51,785,280 |
| Size | 812.5 MB | 49.4 MB |
| Events in quadrant A | 6,426,532 | 302,207 |
| Events in quadrant B | 6,494,633 | 305,459 |
| Events in quadrant C | 5,821,403 | 304,362 |
| Events in quadrant D | 6,712,792 | 291,195 |
| Mode M0 | |||
|---|---|---|---|
| Quadrant | BADHDUFLAG | Total packets | Discarded packets |
| A | 0 | 22799 | 3 |
| B | 0 | 23003 | 2 |
| C | 0 | 20974 | 2 |
| D | 0 | 23627 | 2 |
| Mode SS | |||
|---|---|---|---|
| Quadrant | BADHDUFLAG | Total packets | Discarded packets |
| A | 0 | 108 | 0 |
| B | 0 | 108 | 0 |
| C | 0 | 108 | 0 |
| D | 0 | 108 | 0 |
| Mode M9 | |||
|---|---|---|---|
| Quadrant | BADHDUFLAG | Total packets | Discarded packets |
| A | 0 | 43 | 0 |
| B | 0 | 43 | 0 |
| C | 0 | 43 | 0 |
| D | 0 | 43 | 0 |
| Quadrant | Total seconds | Saturated seconds | Saturation percentage |
|---|---|---|---|
| A | 5201 | 7 | 0.134590% |
| B | 5201 | 15 | 0.288406% |
| C | 5201 | 6 | 0.115362% |
| D | 5201 | 18 | 0.346087% |
Noise dominated data is calculated using 1-second bins in cleaned event files. If a bin has >2000 counts, and if more than 50% of those come from <1% of pixels, then it is considered to be noise-dominated and hence unusable.
| Quadrant | # 1 sec bins | Bins with >0 counts | Bins with >2000 counts | High rate bins dominated by noise | Noise dominated (total time) | Noise dominated (detector-on time) | Marked lightcurve |
|---|---|---|---|---|---|---|---|
| A | 9510 | 5203 | 125 | 125 | 1.31% | 2.40% | 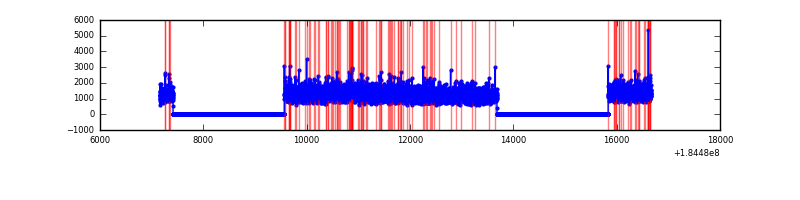 |
| B | 9510 | 5203 | 111 | 111 | 1.17% | 2.13% | 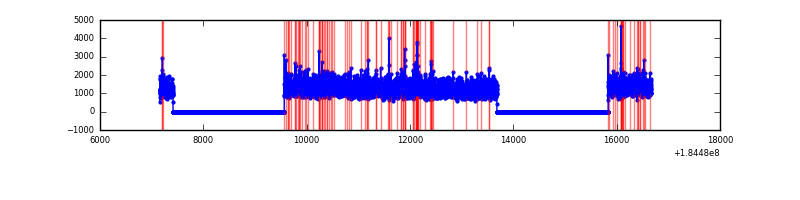 |
| C | 9510 | 5203 | 69 | 69 | 0.73% | 1.33% | 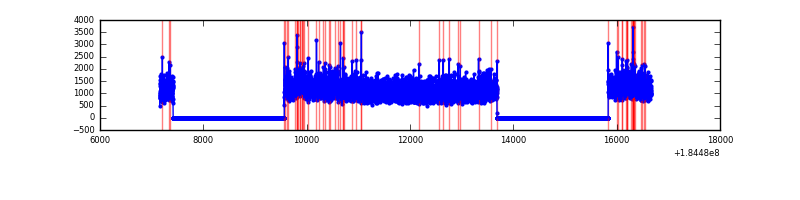 |
| D | 9510 | 5203 | 228 | 228 | 2.40% | 4.38% | 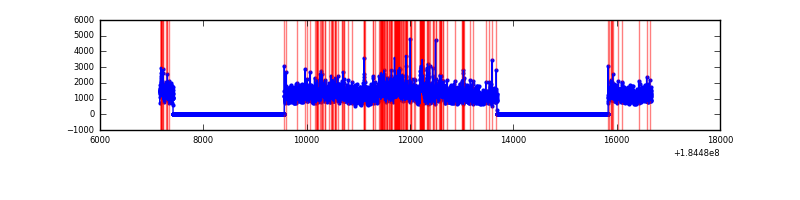 |
Top three noisy pixels from each quadrant. If the there are fewer than three noisy pixels in the level2.evt file, extra rows are filled as -1
| Pixel properties | Quadrant properties | ||||||
|---|---|---|---|---|---|---|---|
| Quadrant | DetID | PixID | Counts | Sigma | Mean | Median | Sigma |
| A | 0 | 149 | 66030 | 178.21 | 1627 | 1611 | 361.5 |
| A | 0 | 69 | 38660 | 102.49 | 1627 | 1611 | 361.5 |
| A | 0 | 238 | 24208 | 62.51 | 1627 | 1611 | 361.5 |
| B | 7 | 221 | 223444 | 578.44 | 1611 | 1625 | 383.5 |
| B | 0 | 230 | 51643 | 130.43 | 1611 | 1625 | 383.5 |
| B | 15 | 185 | 17170 | 40.54 | 1611 | 1625 | 383.5 |
| C | 1 | 1 | 48024 | 114.7 | 1451 | 1500 | 405.6 |
| C | 15 | 241 | 36415 | 86.08 | 1451 | 1500 | 405.6 |
| C | 10 | 19 | 20938 | 47.92 | 1451 | 1500 | 405.6 |
| D | 1 | 4 | 791788 | 1785.84 | 1414 | 1475 | 442.5 |
| D | 12 | 237 | 92490 | 205.66 | 1414 | 1475 | 442.5 |
| D | 13 | 216 | 85553 | 189.99 | 1414 | 1475 | 442.5 |
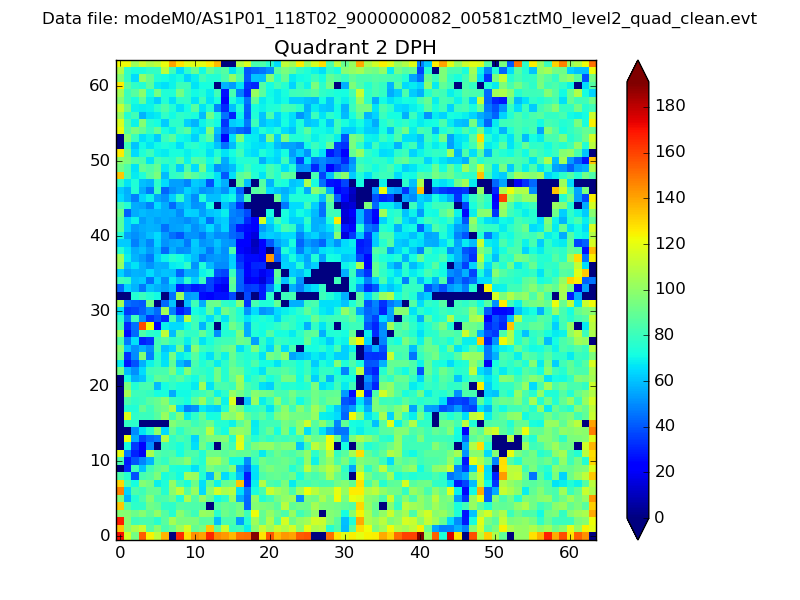
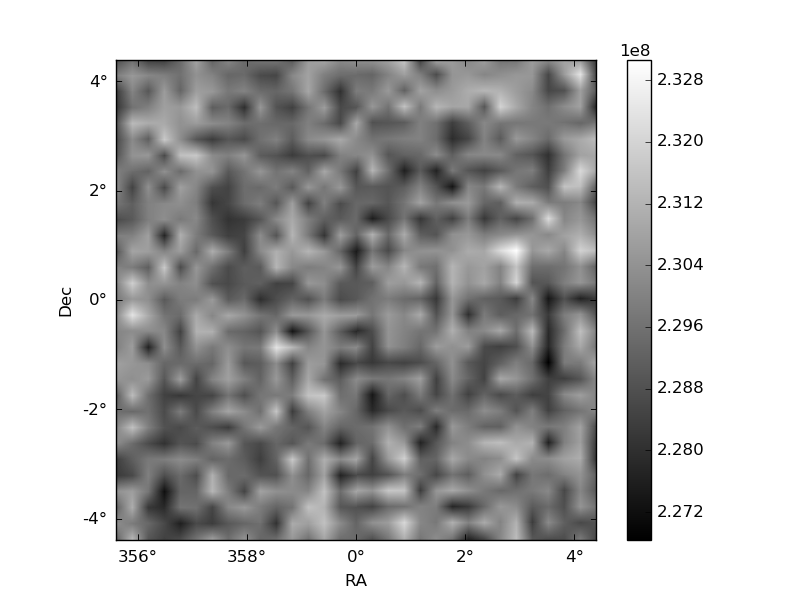
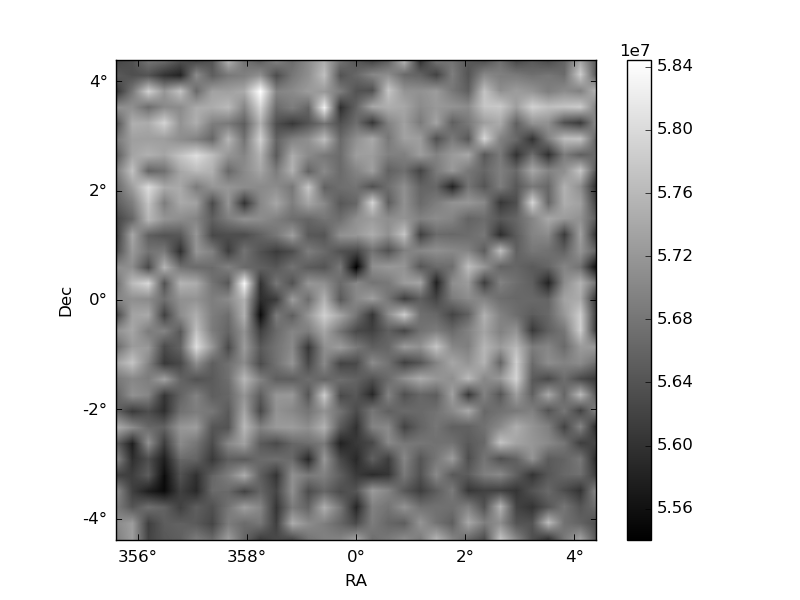
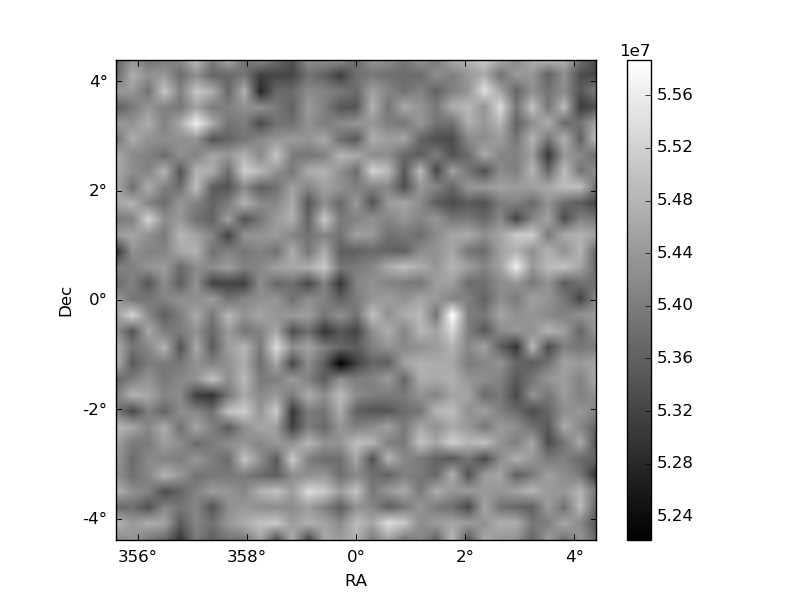
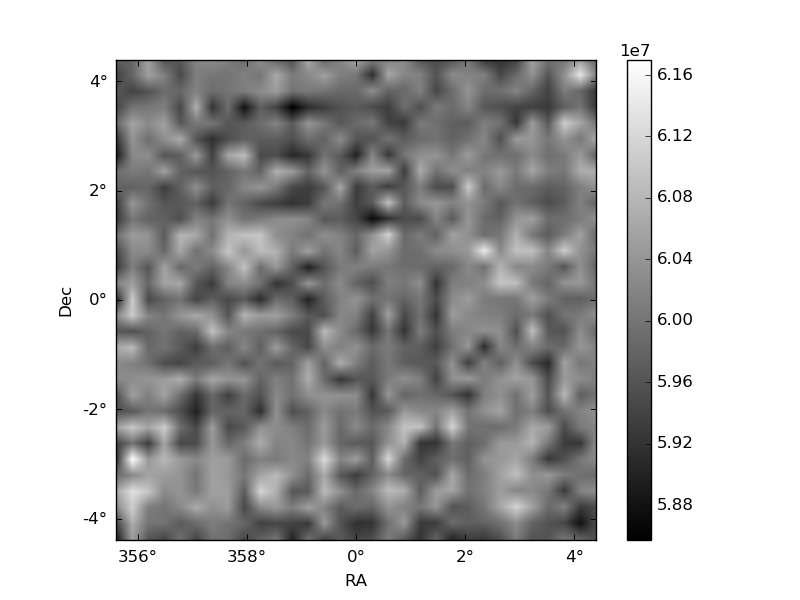
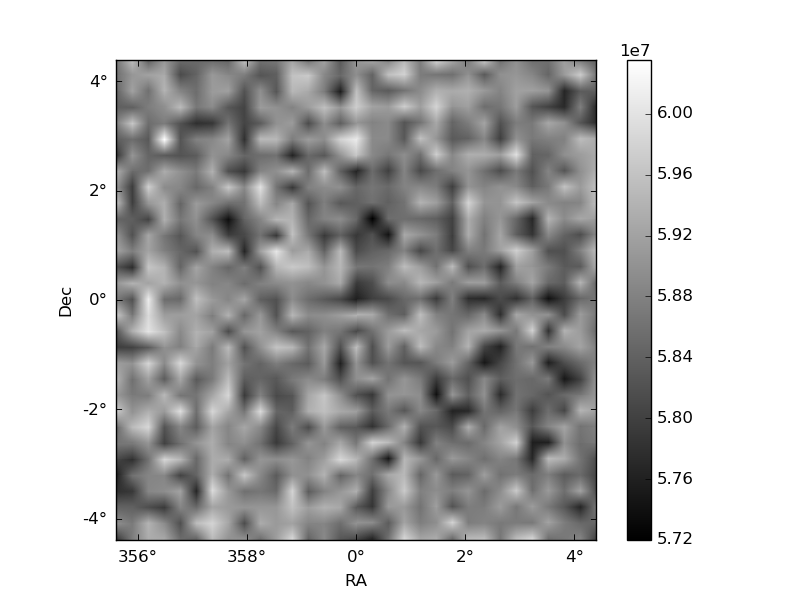
Histogram calculated using DETX and DETY for each event in the final _common_clean file
| Quadrant A | 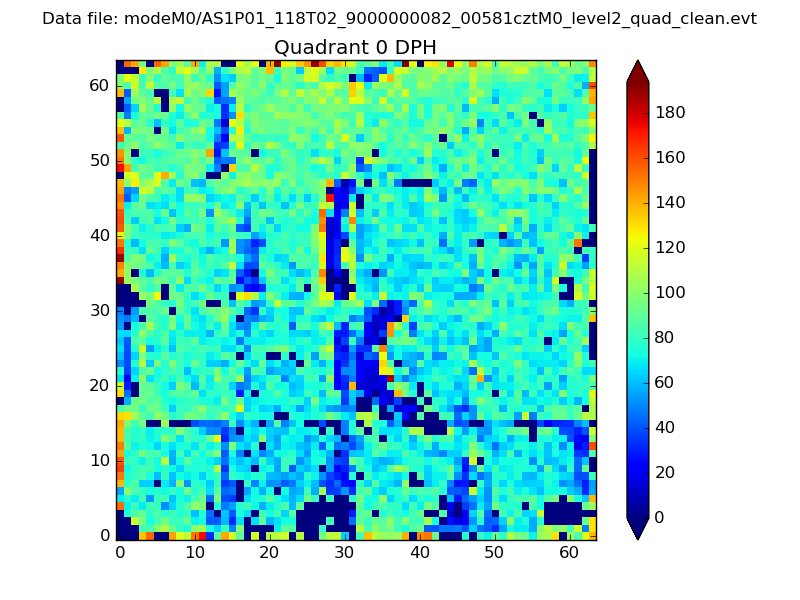 |
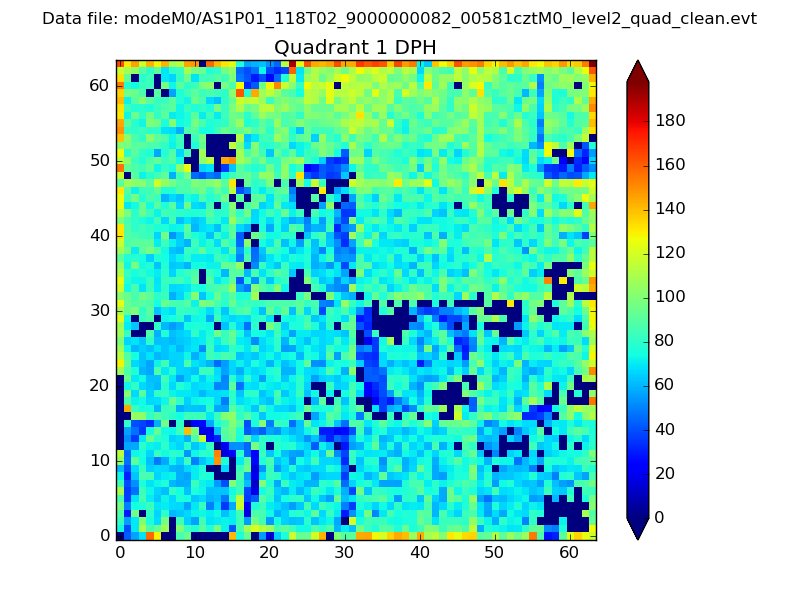 |
Quadrant B |
|---|---|---|---|
| Quadrant D | 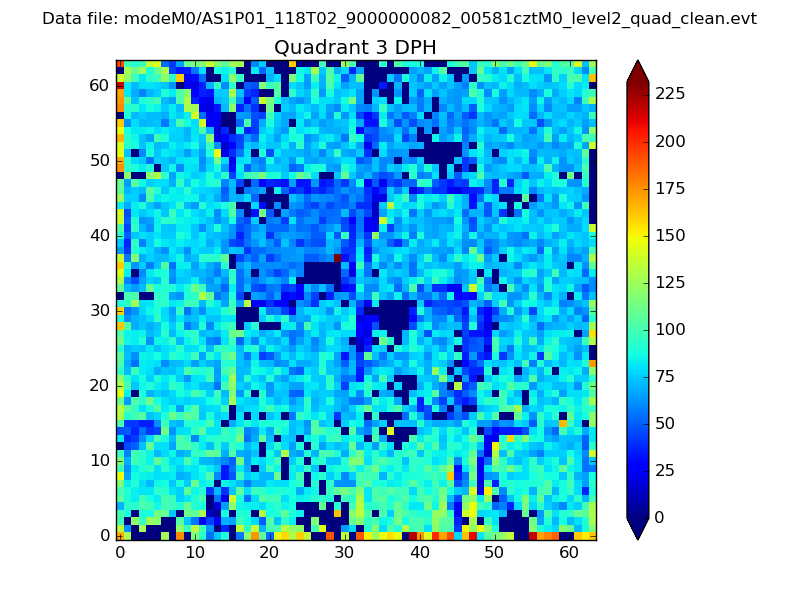 |
 |
Quadrant C |
| Plot type | Count rate plots | Images |
|---|---|---|
| Comparison with Poisson distribution Blue bars denote a histogram of data divided into 1 sec bins. Red curve is a Poisson curve with rate = median count rate of data. |
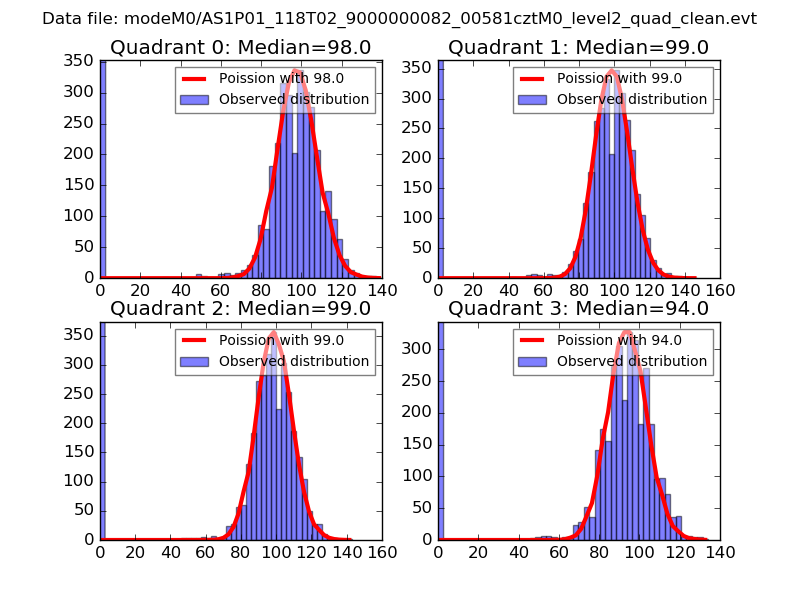 |
 |
| Quadrant-wise count rates Data is divided into 100 sec bins |
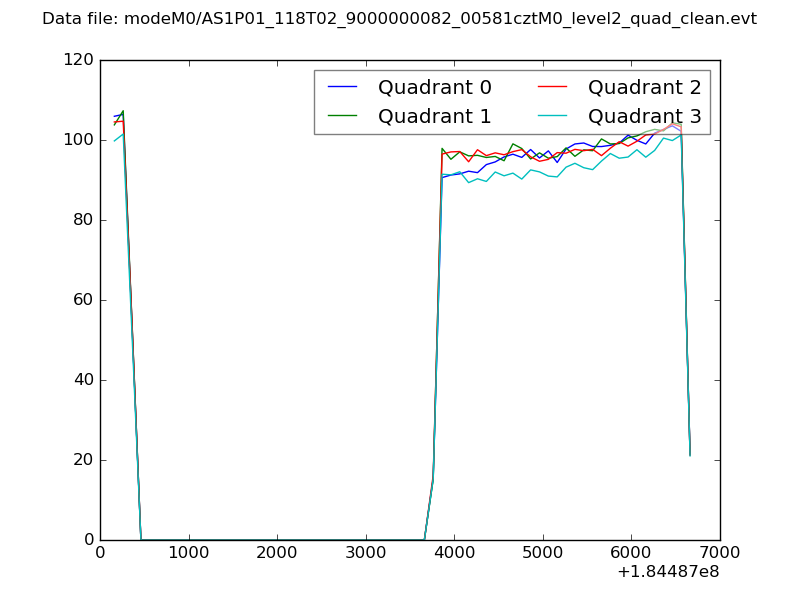 |
|
| Module-wise count rates for Quadrant A Data is divided into 100 sec bins |
 |
 |
| Module-wise count rates for Quadrant B Data is divided into 100 sec bins |
 |
 |
| Module-wise count rates for Quadrant C Data is divided into 100 sec bins |
 |
 |
| Module-wise count rates for Quadrant D Data is divided into 100 sec bins |
 |
 |
| Parameter | Plot |
|---|---|
| CZT HV Monitor | 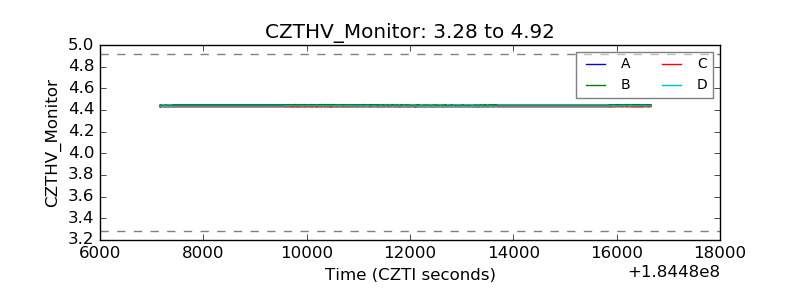 |
| D_VDD | 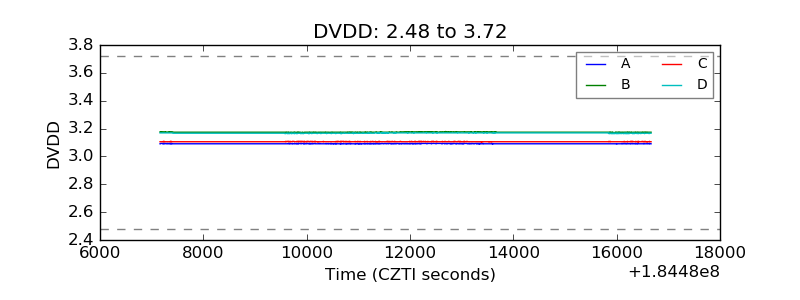 |
| Temperature 1 | 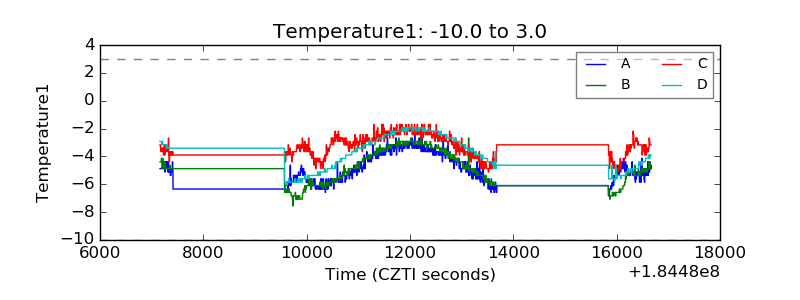 |
| Veto HV Monitor |  |
| Veto LLD | 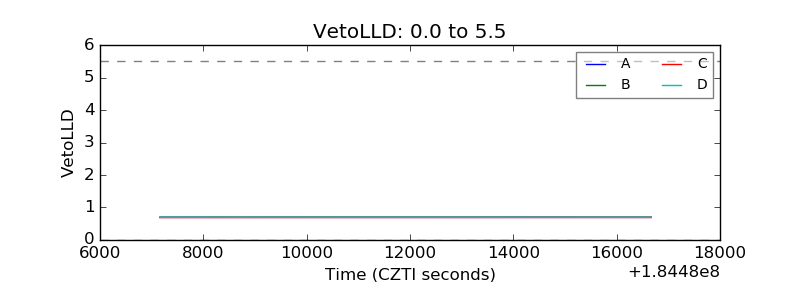 |
| Alpha Counter | 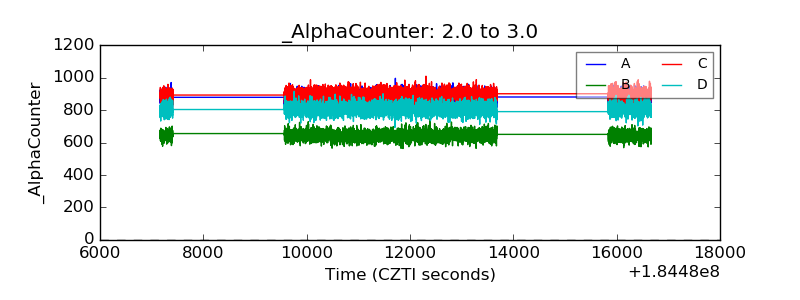 |
| _CPM_Rate | 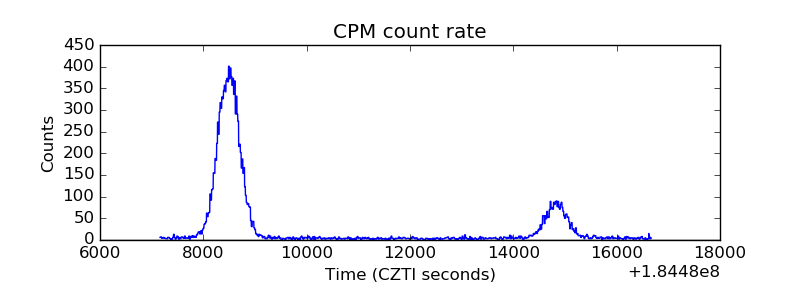 |
| CZT Counter | 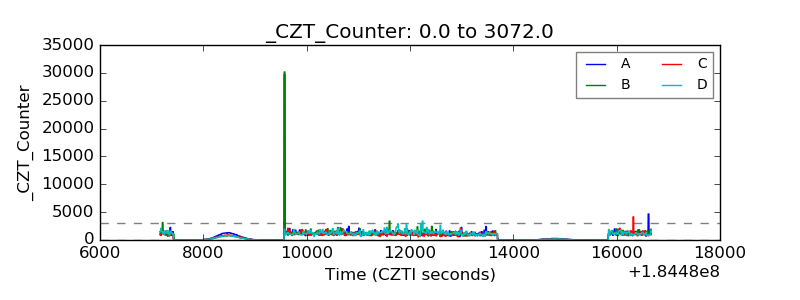 |
| +2.5 Volts monitor |  |
| +5 Volts monitor |  |
| _ROLL_ROT | 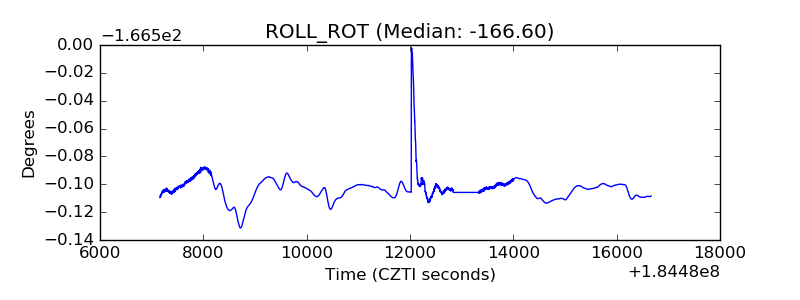 |
| _Roll_DEC |  |
| _Roll_RA | 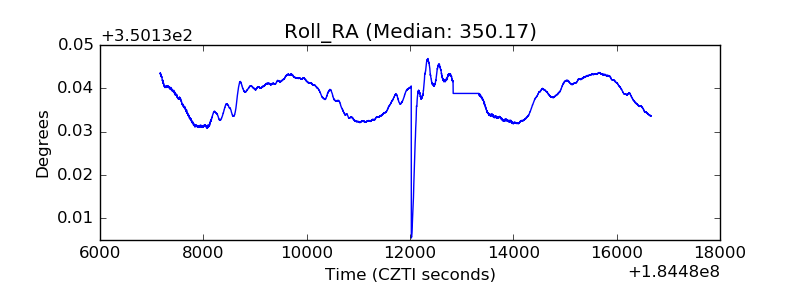 |
| Veto Counter |  |