| Param | Original file | Final file |
|---|---|---|
| Filename | modeM0/AS1P01_118T02_9000000082_00582cztM0_level2.evt | modeM0/AS1P01_118T02_9000000082_00582cztM0_level2_quad_clean.evt |
| Size (bytes) | 873,236,160 | 63,875,520 |
| Size | 832.8 MB | 60.9 MB |
| Events in quadrant A | 6,532,251 | 390,445 |
| Events in quadrant B | 6,812,346 | 394,839 |
| Events in quadrant C | 6,115,117 | 392,466 |
| Events in quadrant D | 6,627,939 | 378,426 |
| Mode M0 | |||
|---|---|---|---|
| Quadrant | BADHDUFLAG | Total packets | Discarded packets |
| A | 0 | 23190 | 3 |
| B | 0 | 24053 | 2 |
| C | 0 | 22044 | 2 |
| D | 0 | 23517 | 2 |
| Mode SS | |||
|---|---|---|---|
| Quadrant | BADHDUFLAG | Total packets | Discarded packets |
| A | 0 | 112 | 0 |
| B | 0 | 112 | 0 |
| C | 0 | 112 | 0 |
| D | 0 | 112 | 0 |
| Mode M9 | |||
|---|---|---|---|
| Quadrant | BADHDUFLAG | Total packets | Discarded packets |
| A | 0 | 43 | 0 |
| B | 0 | 43 | 0 |
| C | 0 | 43 | 0 |
| D | 0 | 43 | 0 |
| Quadrant | Total seconds | Saturated seconds | Saturation percentage |
|---|---|---|---|
| A | 5395 | 7 | 0.129750% |
| B | 5395 | 29 | 0.537535% |
| C | 5395 | 35 | 0.648749% |
| D | 5395 | 50 | 0.926784% |
Noise dominated data is calculated using 1-second bins in cleaned event files. If a bin has >2000 counts, and if more than 50% of those come from <1% of pixels, then it is considered to be noise-dominated and hence unusable.
| Quadrant | # 1 sec bins | Bins with >0 counts | Bins with >2000 counts | High rate bins dominated by noise | Noise dominated (total time) | Noise dominated (detector-on time) | Marked lightcurve |
|---|---|---|---|---|---|---|---|
| A | 9705 | 5397 | 124 | 124 | 1.28% | 2.30% | 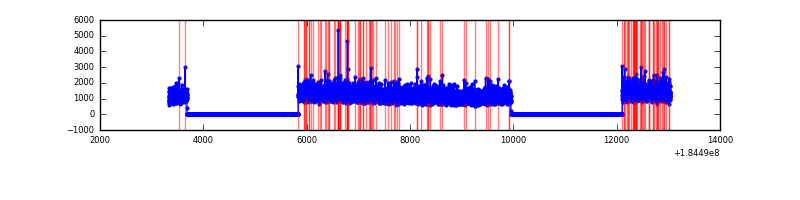 |
| B | 9705 | 5397 | 175 | 175 | 1.80% | 3.24% | 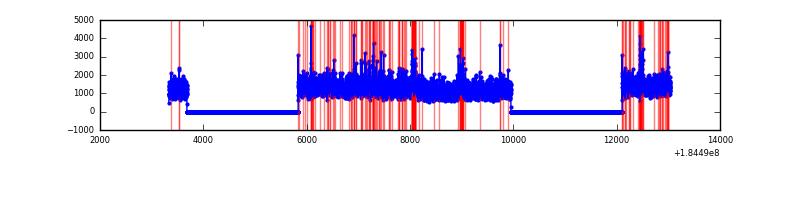 |
| C | 9705 | 5397 | 133 | 133 | 1.37% | 2.46% | 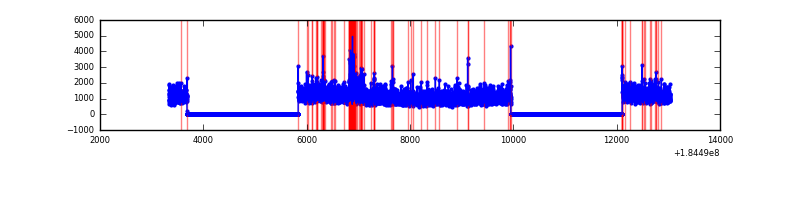 |
| D | 9705 | 5397 | 207 | 207 | 2.13% | 3.84% | 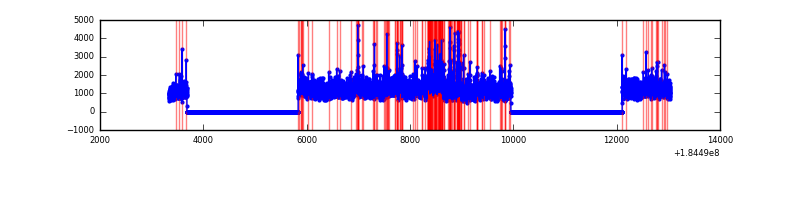 |
Top three noisy pixels from each quadrant. If the there are fewer than three noisy pixels in the level2.evt file, extra rows are filled as -1
| Pixel properties | Quadrant properties | ||||||
|---|---|---|---|---|---|---|---|
| Quadrant | DetID | PixID | Counts | Sigma | Mean | Median | Sigma |
| A | 13 | 160 | 35634 | 91.67 | 1667 | 1653 | 370.7 |
| A | 0 | 69 | 22735 | 56.87 | 1667 | 1653 | 370.7 |
| A | 0 | 238 | 12983 | 30.56 | 1667 | 1653 | 370.7 |
| B | 7 | 221 | 343330 | 877.42 | 1638 | 1649 | 389.4 |
| B | 0 | 230 | 73675 | 184.96 | 1638 | 1649 | 389.4 |
| B | 4 | 250 | 39541 | 97.31 | 1638 | 1649 | 389.4 |
| C | 3 | 159 | 238567 | 571.13 | 1475 | 1523 | 415.0 |
| C | 15 | 241 | 44364 | 103.22 | 1475 | 1523 | 415.0 |
| C | 1 | 1 | 23541 | 53.05 | 1475 | 1523 | 415.0 |
| D | 13 | 216 | 271699 | 592.15 | 1455 | 1513 | 456.3 |
| D | 12 | 237 | 216780 | 471.79 | 1455 | 1513 | 456.3 |
| D | 1 | 4 | 160511 | 348.47 | 1455 | 1513 | 456.3 |
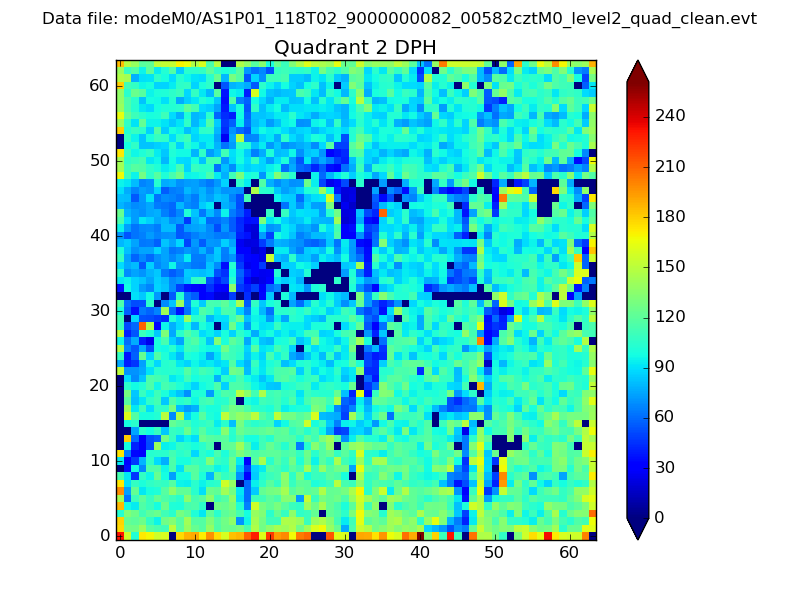
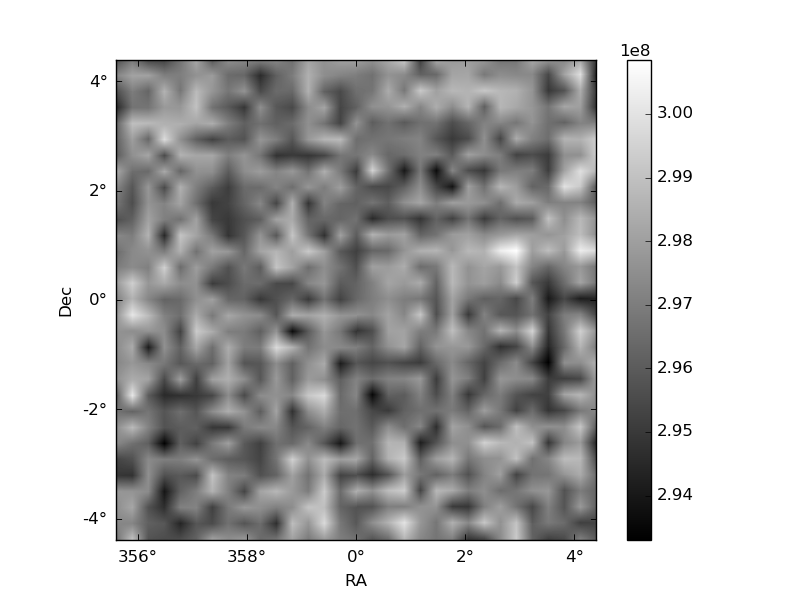
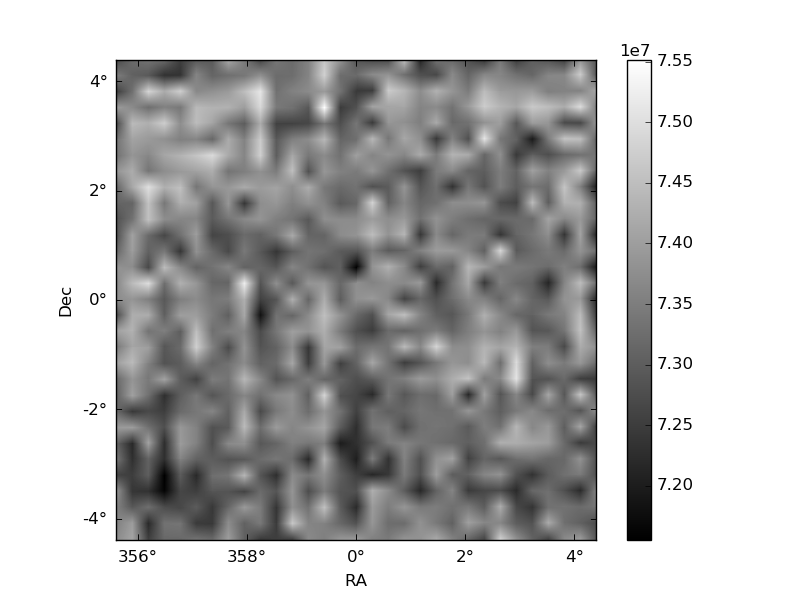
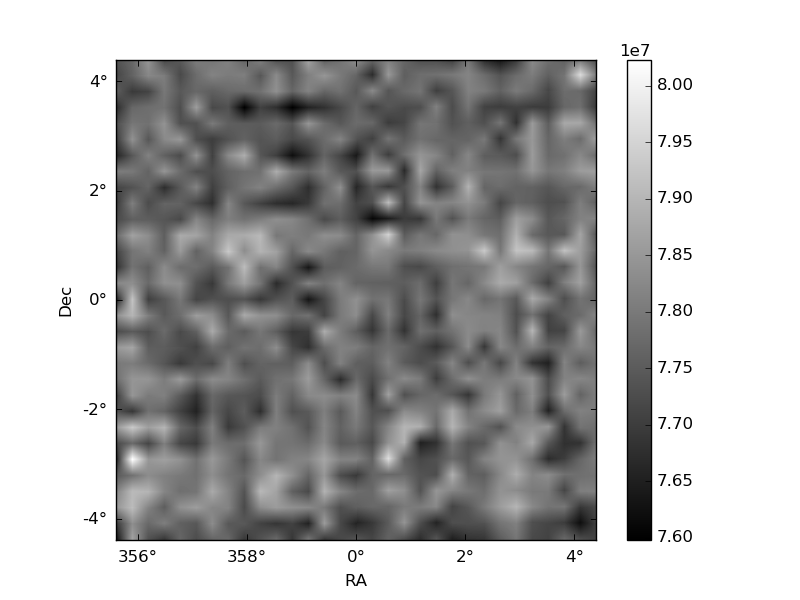
Histogram calculated using DETX and DETY for each event in the final _common_clean file
| Quadrant A | 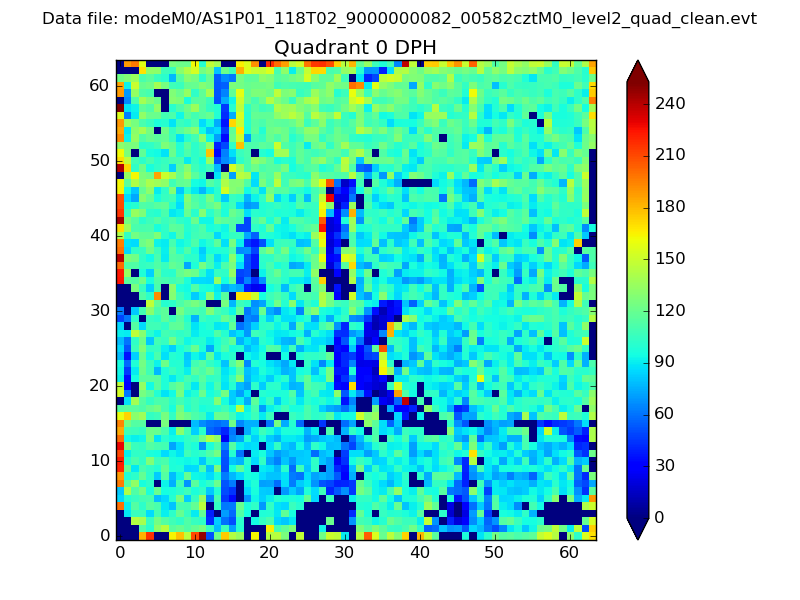 |
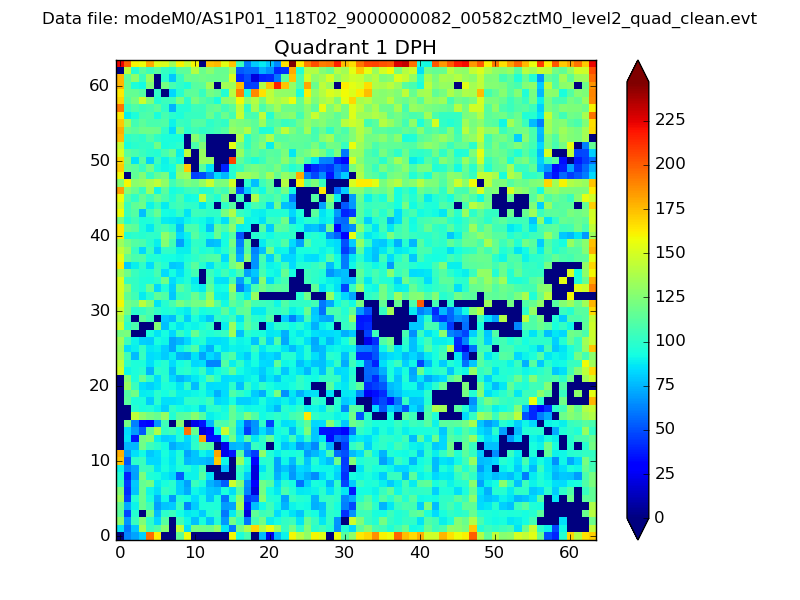 |
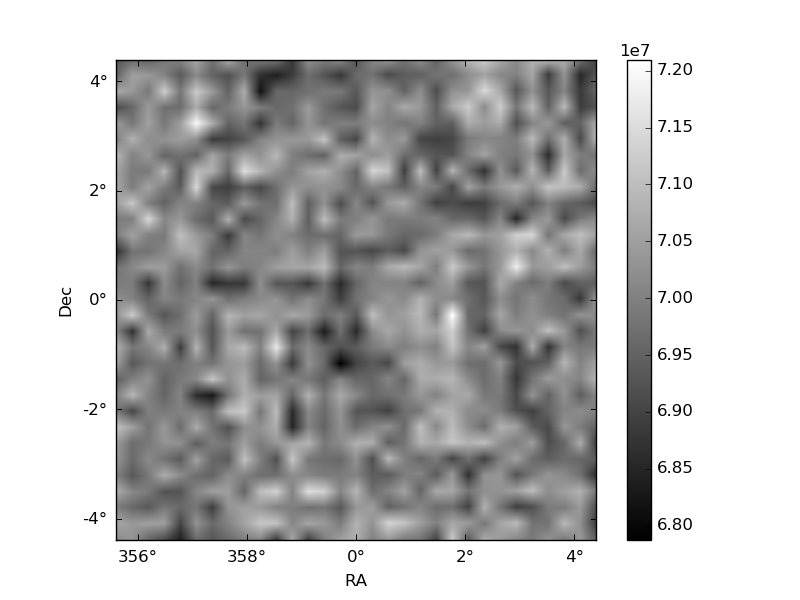
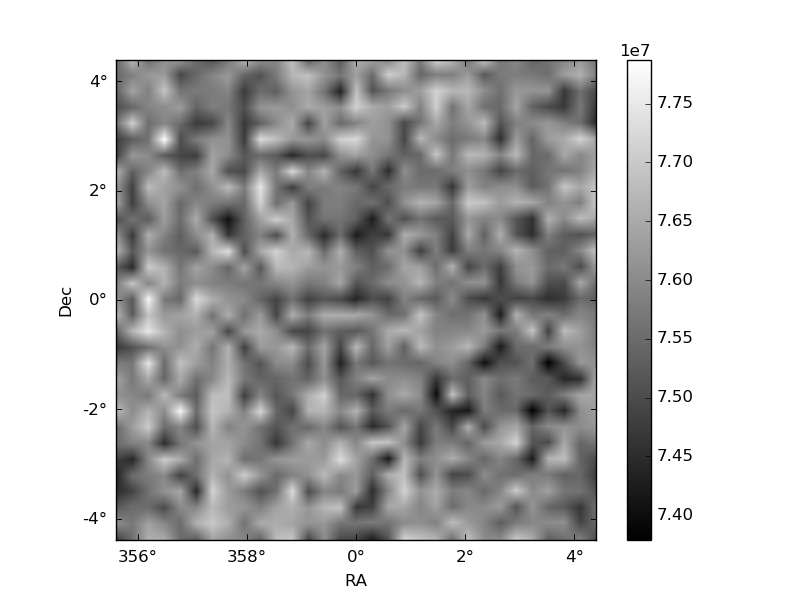
Quadrant B |
|---|---|---|---|
| Quadrant D | 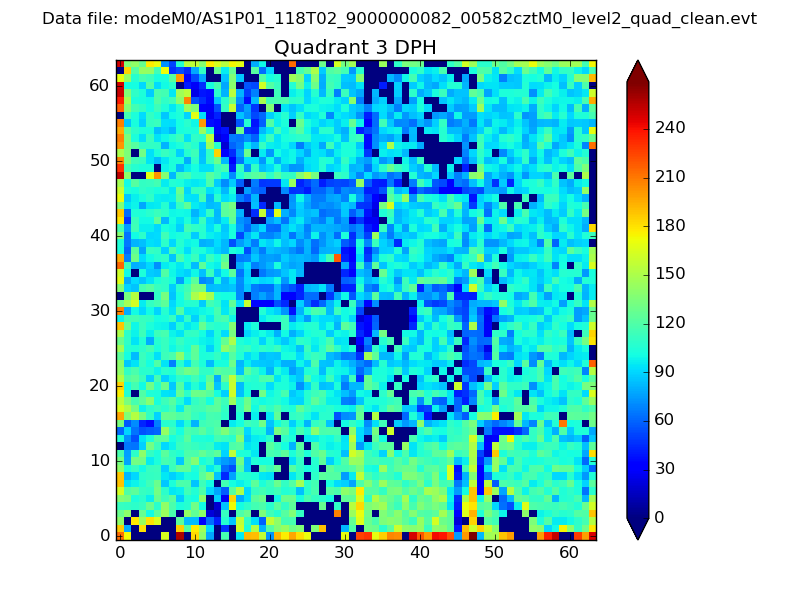 |
 |
Quadrant C |
| Plot type | Count rate plots | Images |
|---|---|---|
| Comparison with Poisson distribution Blue bars denote a histogram of data divided into 1 sec bins. Red curve is a Poisson curve with rate = median count rate of data. |
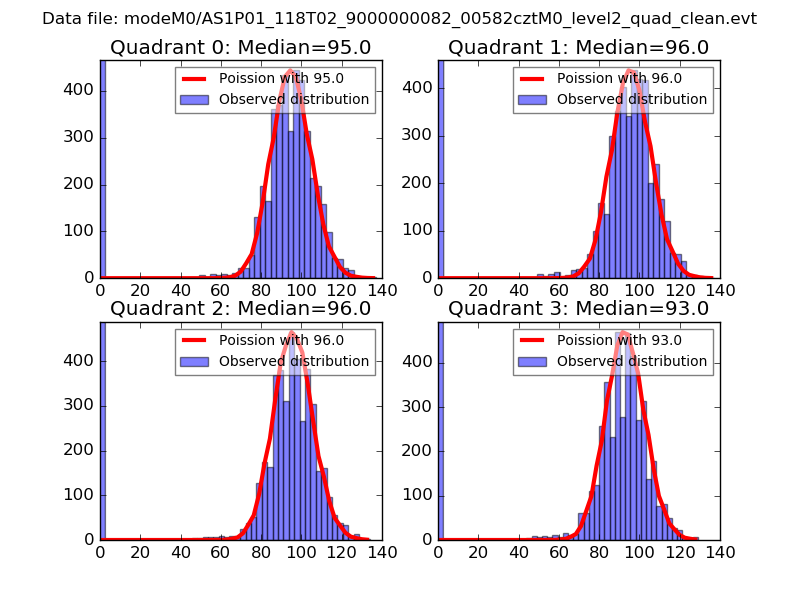 |
 |
| Quadrant-wise count rates Data is divided into 100 sec bins |
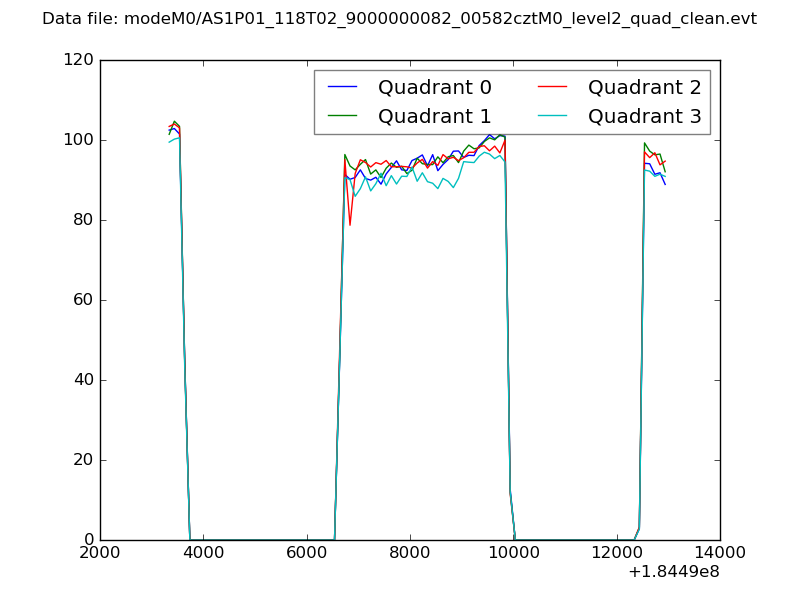 |
|
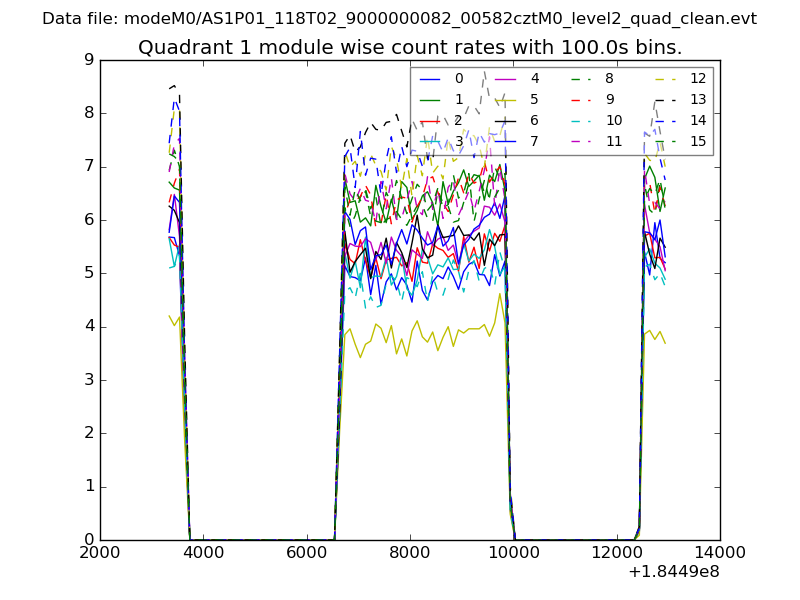
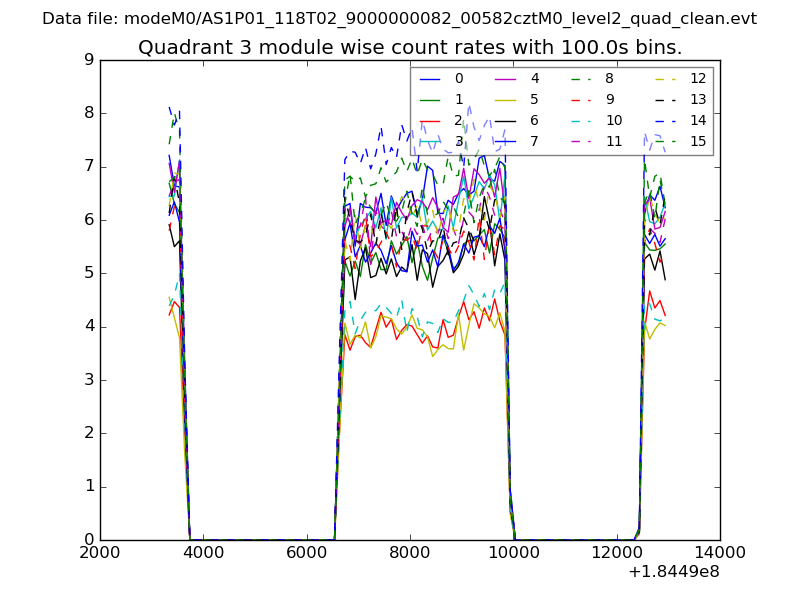
| Module-wise count rates for Quadrant A Data is divided into 100 sec bins |
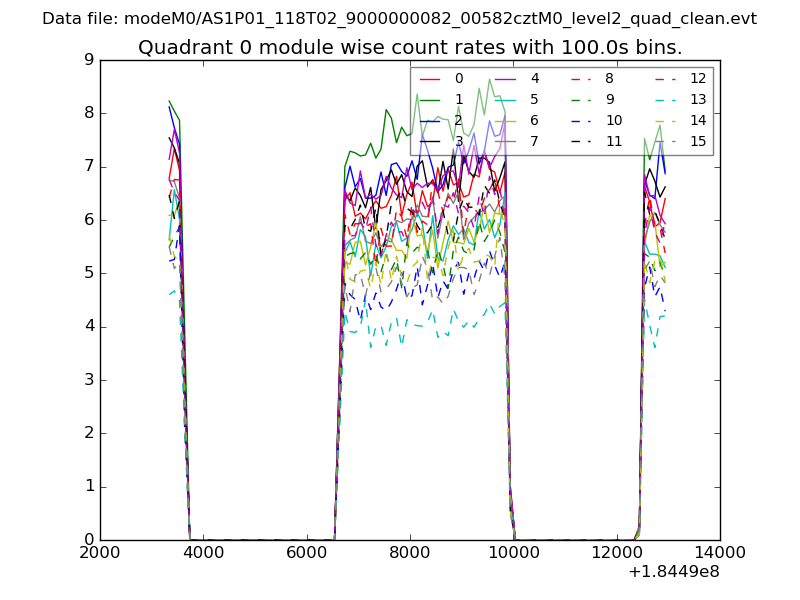 |
 |
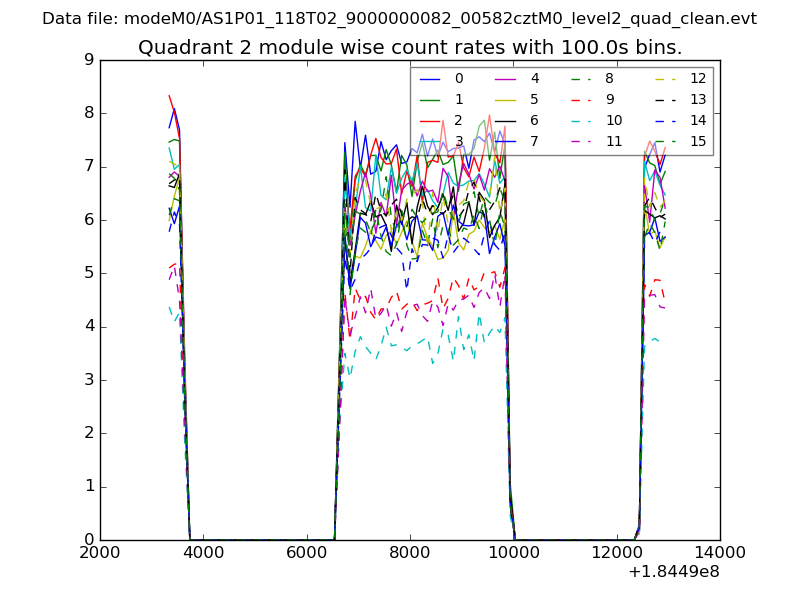
| Module-wise count rates for Quadrant B Data is divided into 100 sec bins |
 |
 |
| Module-wise count rates for Quadrant C Data is divided into 100 sec bins |
 |
 |
| Module-wise count rates for Quadrant D Data is divided into 100 sec bins |
 |
 |
| Parameter | Plot |
|---|---|
| CZT HV Monitor | 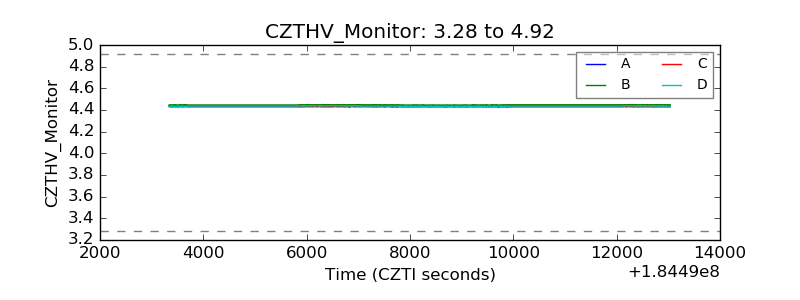 |
| D_VDD | 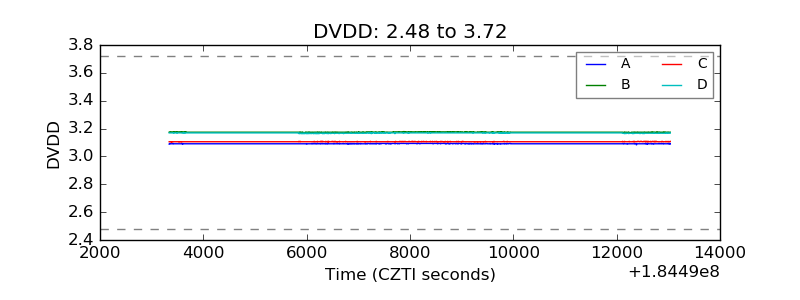 |
| Temperature 1 | 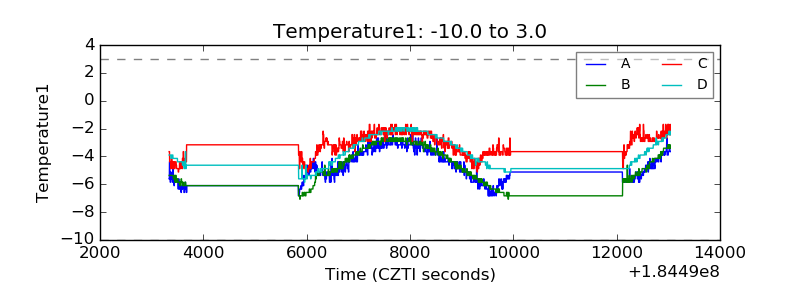 |
| Veto HV Monitor | 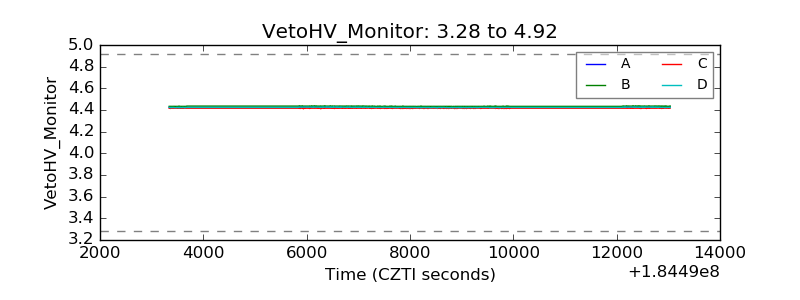 |
| Veto LLD | 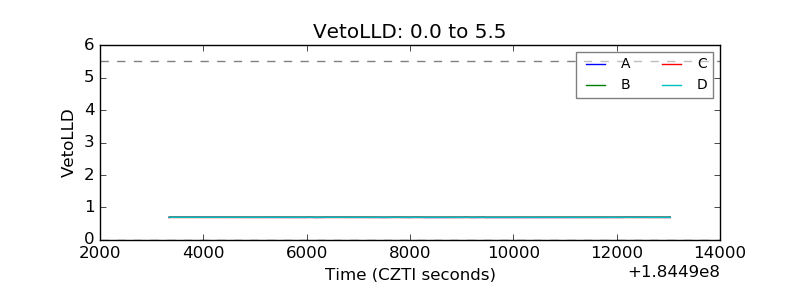 |
| Alpha Counter | 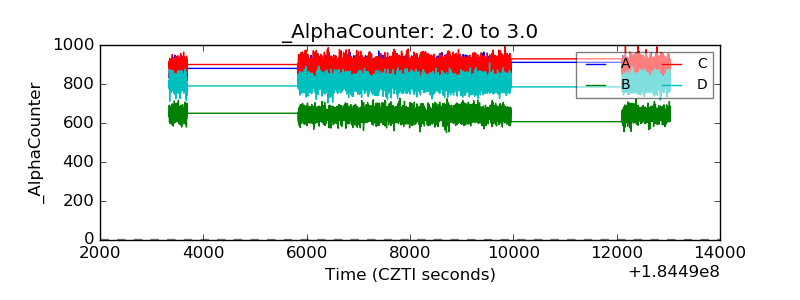 |
| _CPM_Rate | 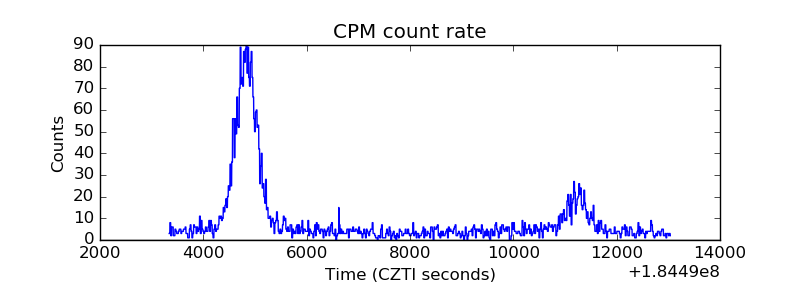 |
| CZT Counter | 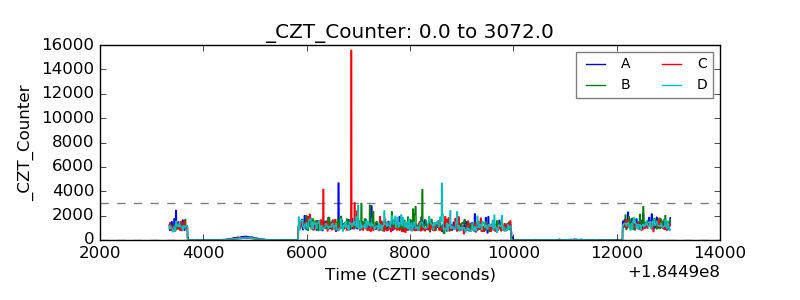 |
| +2.5 Volts monitor |  |
| +5 Volts monitor |  |
| _ROLL_ROT | 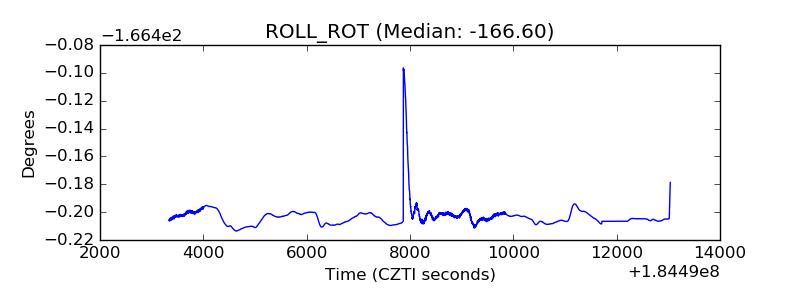 |
| _Roll_DEC | 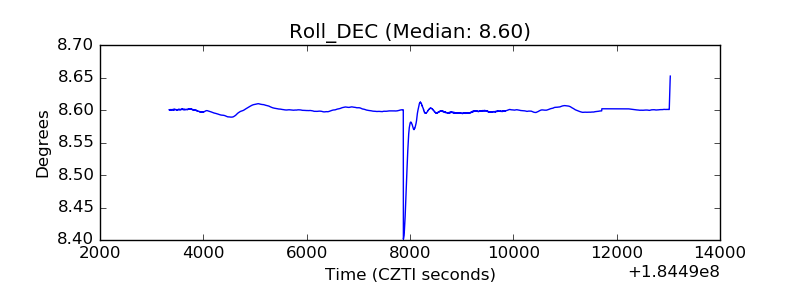 |
| _Roll_RA | 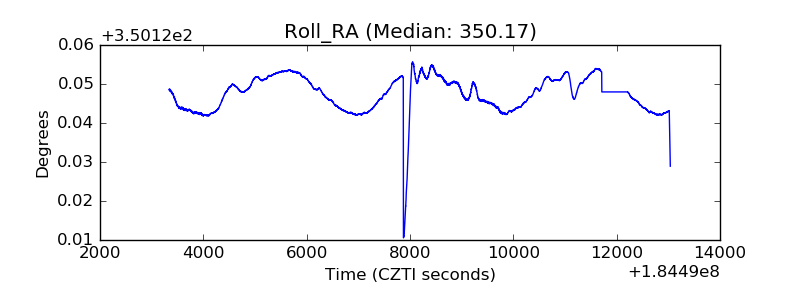 |
| Veto Counter | 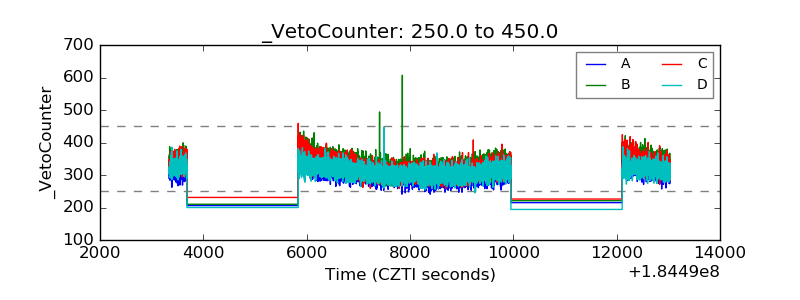 |